Platinum Sells Off 4.4%
· Commodities · QuoteReporter
Platinum Sells Off 4.4%
Analysis Date: May 15, 2026
📊 Current Market Data
CURRENT PRICE
$1992.10
DAILY CHANGE
-4.39%
WEEKLY CHANGE
-2.69%
52W HIGH
$2852.40
52W LOW
$990.20
💡 Key Market Factors
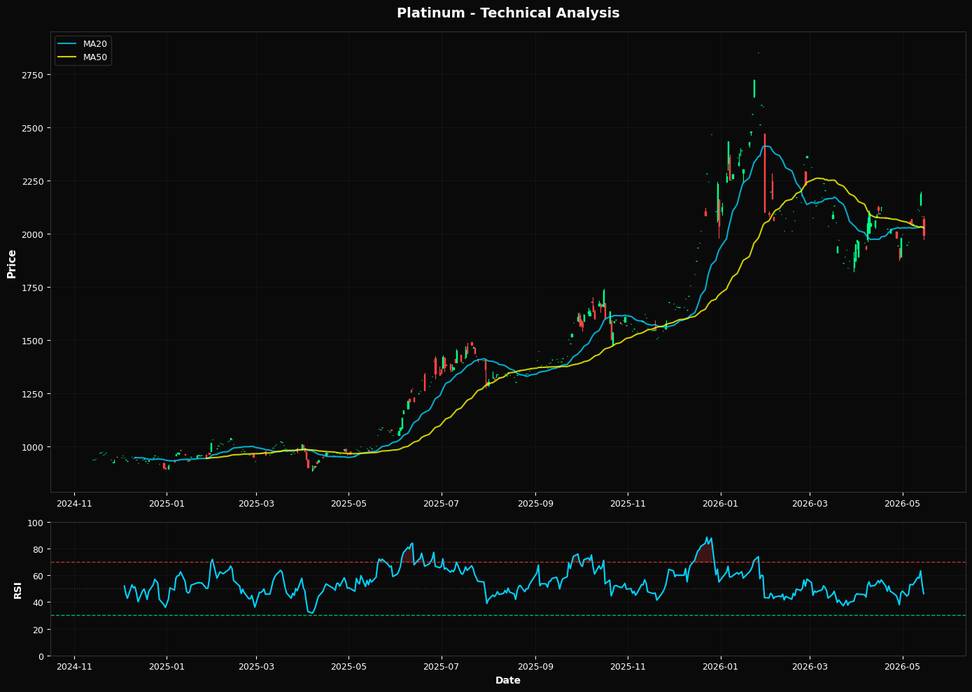
Platinum's recent price movement, with a daily decline of 4.39% and a weekly drop of 2.69%, suggests significant pressure, likely influenced by macroeconomic factors such as inflation and Federal Reserve policies. With inflationary pressures persisting, the Fed's stance on interest rates remains a critical factor. Higher interest rates can strengthen the U.S. dollar, making dollar-denominated commodities like platinum more expensive for foreign buyers, thereby potentially dampening demand. From a technical perspective, the Relative Strength Index (RSI) at 46.3 indicates that platinum is approaching oversold territory, but not yet at a critical level. The price is currently below both the 20-day and 50-day moving averages ($2026.47 and $2027.55, respectively), suggesting a bearish short-term trend. The nearest Fibonacci retracement level at 50.0% is $1952.05, which could act as a potential support if the price continues to decline. Geopolitical events, unless major, have not been highlighted as significant factors impacting platinum prices in this analysis. However, any substantial geopolitical shifts could alter market dynamics by affecting supply chains or altering investor risk appetite. Overall, the interplay between inflationary trends, Fed policy, and technical indicators will likely continue to influence platinum's price trajectory in the near term.📈 Technical Indicators Summary
RSI (14)
46.3
50-Day MA
$2027.55
200-Day MA
$1835.10
Fib Level
50.0%
📊 Technical Analysis Chart (18-Month View)
📐 Fibonacci Retracement Analysis
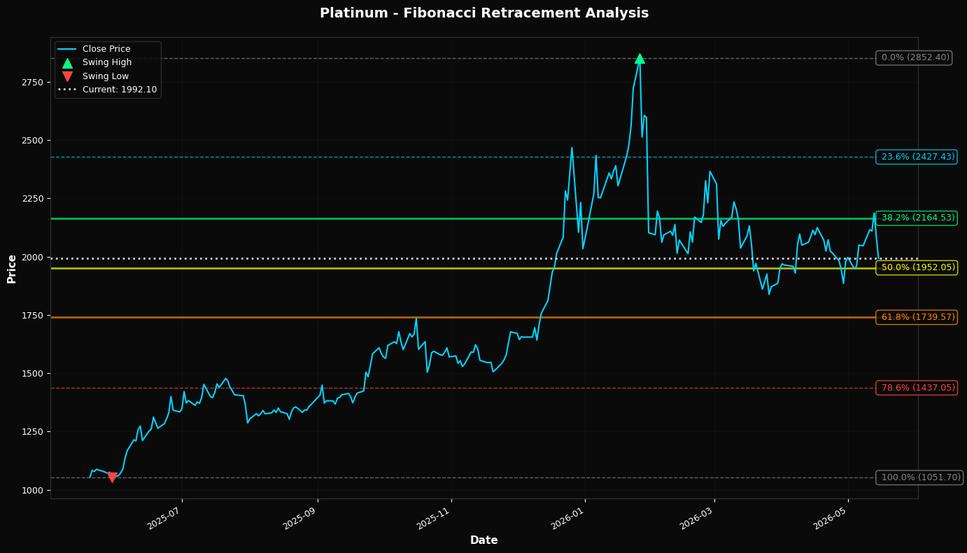
🎯 Key Trading Levels
Key Fibonacci Levels:
- 38.2%: $2164.53
- 50.0%: $1952.05
- 61.8%: $1739.57
Support: $1051.70 (Swing Low), $2027.55 (50-Day MA)
Resistance: $2852.40 (Swing High)
Disclaimer
The content on MarketsFN.com is provided for educational and informational purposes only. It does not constitute financial advice, investment recommendations, or trading guidance. All investments involve risks, and past performance does not guarantee future results. You are solely responsible for your investment decisions and should conduct independent research and consult a qualified financial advisor before acting. MarketsFN.com and its authors are not liable for any losses or damages arising from your use of this information.