Platinum: Up 0.6% to $1879.90 — Below MA50 ($1990.69) — Caution
· Commodities · QuoteReporter
Platinum: Up 0.6% to $1879.90 — Below MA50 ($1990.69) — Caution
Analysis Date: June 04, 2026
📊 Current Market Data
CURRENT PRICE
$1879.90
DAILY CHANGE
+0.60%
WEEKLY CHANGE
-2.17%
52W HIGH
$2852.40
52W LOW
$1085.90
💡 Key Market Factors
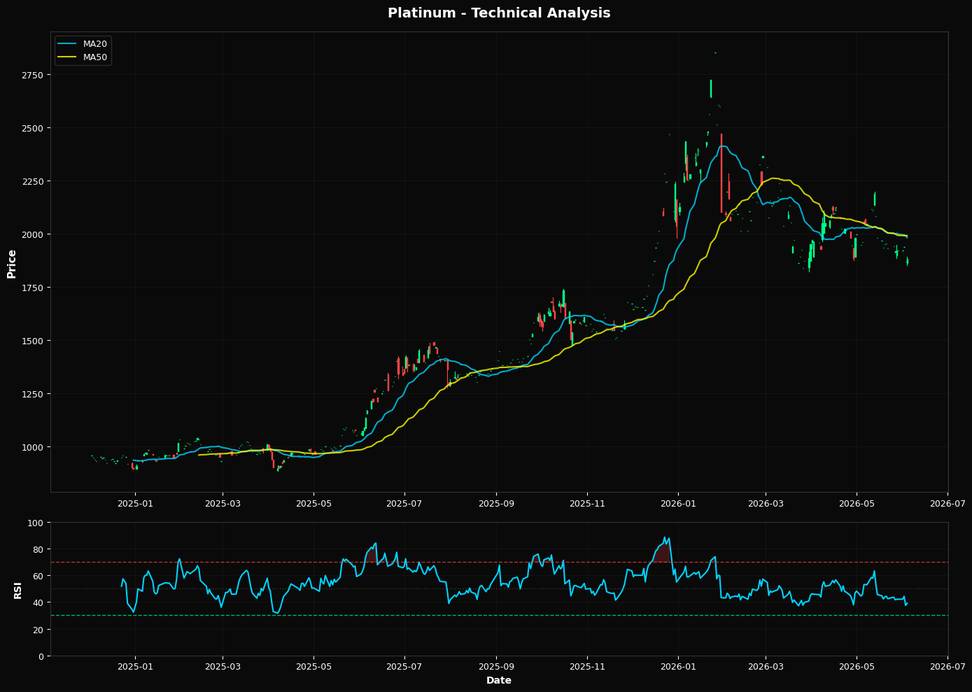
Platinum's current price action suggests a bearish outlook, with the most pressing macro driver being the strength of the U.S. dollar. As platinum is priced in dollars, a stronger USD typically exerts downward pressure on its price. Given the Federal Reserve's recent hawkish stance, signaling potential for further rate hikes to combat persistent inflation, the dollar has been buoyed, making platinum less attractive to non-U.S. investors. This dynamic is crucial as it directly impacts demand and pricing for the metal, overshadowing other macro factors like inflation itself or broader economic growth concerns. From a technical perspective, platinum's Relative Strength Index (RSI) of 39.1 indicates that it is approaching oversold territory, yet not quite there, suggesting further downside potential. The current price of $1879.90 is below both the 20-day moving average of $1981.21 and the 50-day moving average of $1990.69, reinforcing a bearish trend. However, it is slightly above the 200-day moving average of $1874.10, which could act as a tentative support. The nearest Fibonacci support level at $1817.06 is critical; a breach below this could accelerate selling pressure. The technical setup suggests a bearish bias unless the price can reclaim and sustain above these moving averages. A key risk that could alter this bearish outlook is a significant shift in Federal Reserve policy. Should upcoming economic data, such as the next Consumer Price Index (CPI) release, show a marked decrease in inflation, it could prompt the Fed to pause or even reverse its tightening cycle. This would likely weaken the USD, providing a tailwind for platinum prices. Conversely, stronger-than-expected inflation data could reinforce the Fed's hawkish stance, further strengthening the dollar and pressuring platinum. The market may be underpricing the potential for geopolitical tensions to disrupt supply chains, which could provide unexpected support for platinum prices. Any significant disruption in South African mining operations, a major source of global platinum supply, could lead to a supply squeeze. Investors should closely monitor geopolitical developments and upcoming Fed communications for cues on the future trajectory of the USD and, consequently, platinum prices. The next Federal Open Market Committee (FOMC) meeting minutes release will be pivotal in confirming or challenging the current bearish outlook.📈 Technical Indicators Summary
RSI (14)
39.1
50-Day MA
$1990.69
200-Day MA
$1874.10
Fib Level
61.8%
📊 Technical Analysis Chart (18-Month View)
📐 Fibonacci Retracement Analysis
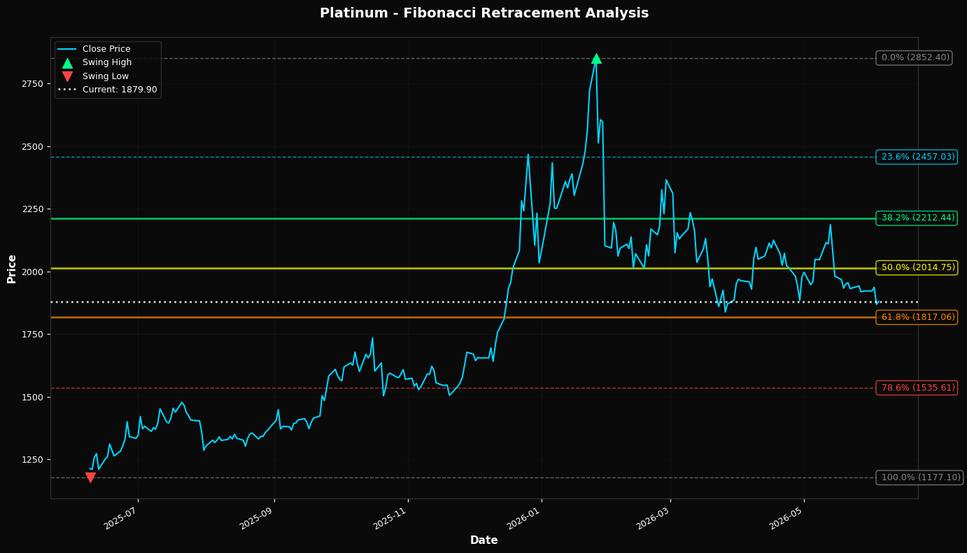
🎯 Key Trading Levels
Key Fibonacci Levels:
- 38.2%: $2212.44
- 50.0%: $2014.75
- 61.8%: $1817.06
Support: $1177.10 (Swing Low), $1990.69 (50-Day MA)
Resistance: $2852.40 (Swing High)
Disclaimer
The content on MarketsFN.com is provided for educational and informational purposes only. It does not constitute financial advice, investment recommendations, or trading guidance. All investments involve risks, and past performance does not guarantee future results. You are solely responsible for your investment decisions and should conduct independent research and consult a qualified financial advisor before acting. MarketsFN.com and its authors are not liable for any losses or damages arising from your use of this information.