S&P 500 2026 YTD Highs & Lows Radar: Bank Of America (BAC), Walmart (WMT) and more
· Stocks · MarketsFN Team
S&P 500 2026 YTD Highs & Lows Radar: Bank Of America (BAC), Walmart (WMT) and more
Screening all 503 S&P 500 constituents for stocks nearest to their 2026 year-to-date high and their 2026 YTD low. Data as of July 02, 2026. % Realized = total return since Jan 1 2026.
Legend: RSI > 70 = overbought · RSI < 30 = oversold · Green % Realized = positive YTD return · Red = negative.
📈 Nearest to 2026 High
Sectors represented: Financial (2), Industrials (1), Basic Materials (1), Technology (1)
| Ticker | Company | Sector | Price Last | % Realized | 2026 YTD High Date | RSI | % above MA200 | Trend |
|---|---|---|---|---|---|---|---|---|
| BAC | Bank Of America Corp | Financial | $58.36 | +4.31% | 2026-07-01 | 69.7 | +11.0% | Above MA20, MA50, MA200 |
| GE | GE Aerospace | Industrials | $374.94 | +16.89% | 2026-07-01 | 76.1 | +21.2% | Above MA20, MA50, MA200 |
| LIN | Linde Plc | Basic Materials | $533.55 | +24.34% | 2026-07-01 | 63.1 | +13.6% | Above MA20, MA50, MA200 |
| PGR | Progressive Corp | Financial | $225.30 | +6.21% | 2026-07-01 | 67.0 | +5.6% | Above MA20, MA50, MA200 |
| PANW | Palo Alto Networks Inc | Technology | $352.04 | +96.26% | 2026-07-01 | 79.3 | +74.7% | Above MA20, MA50, MA200 |
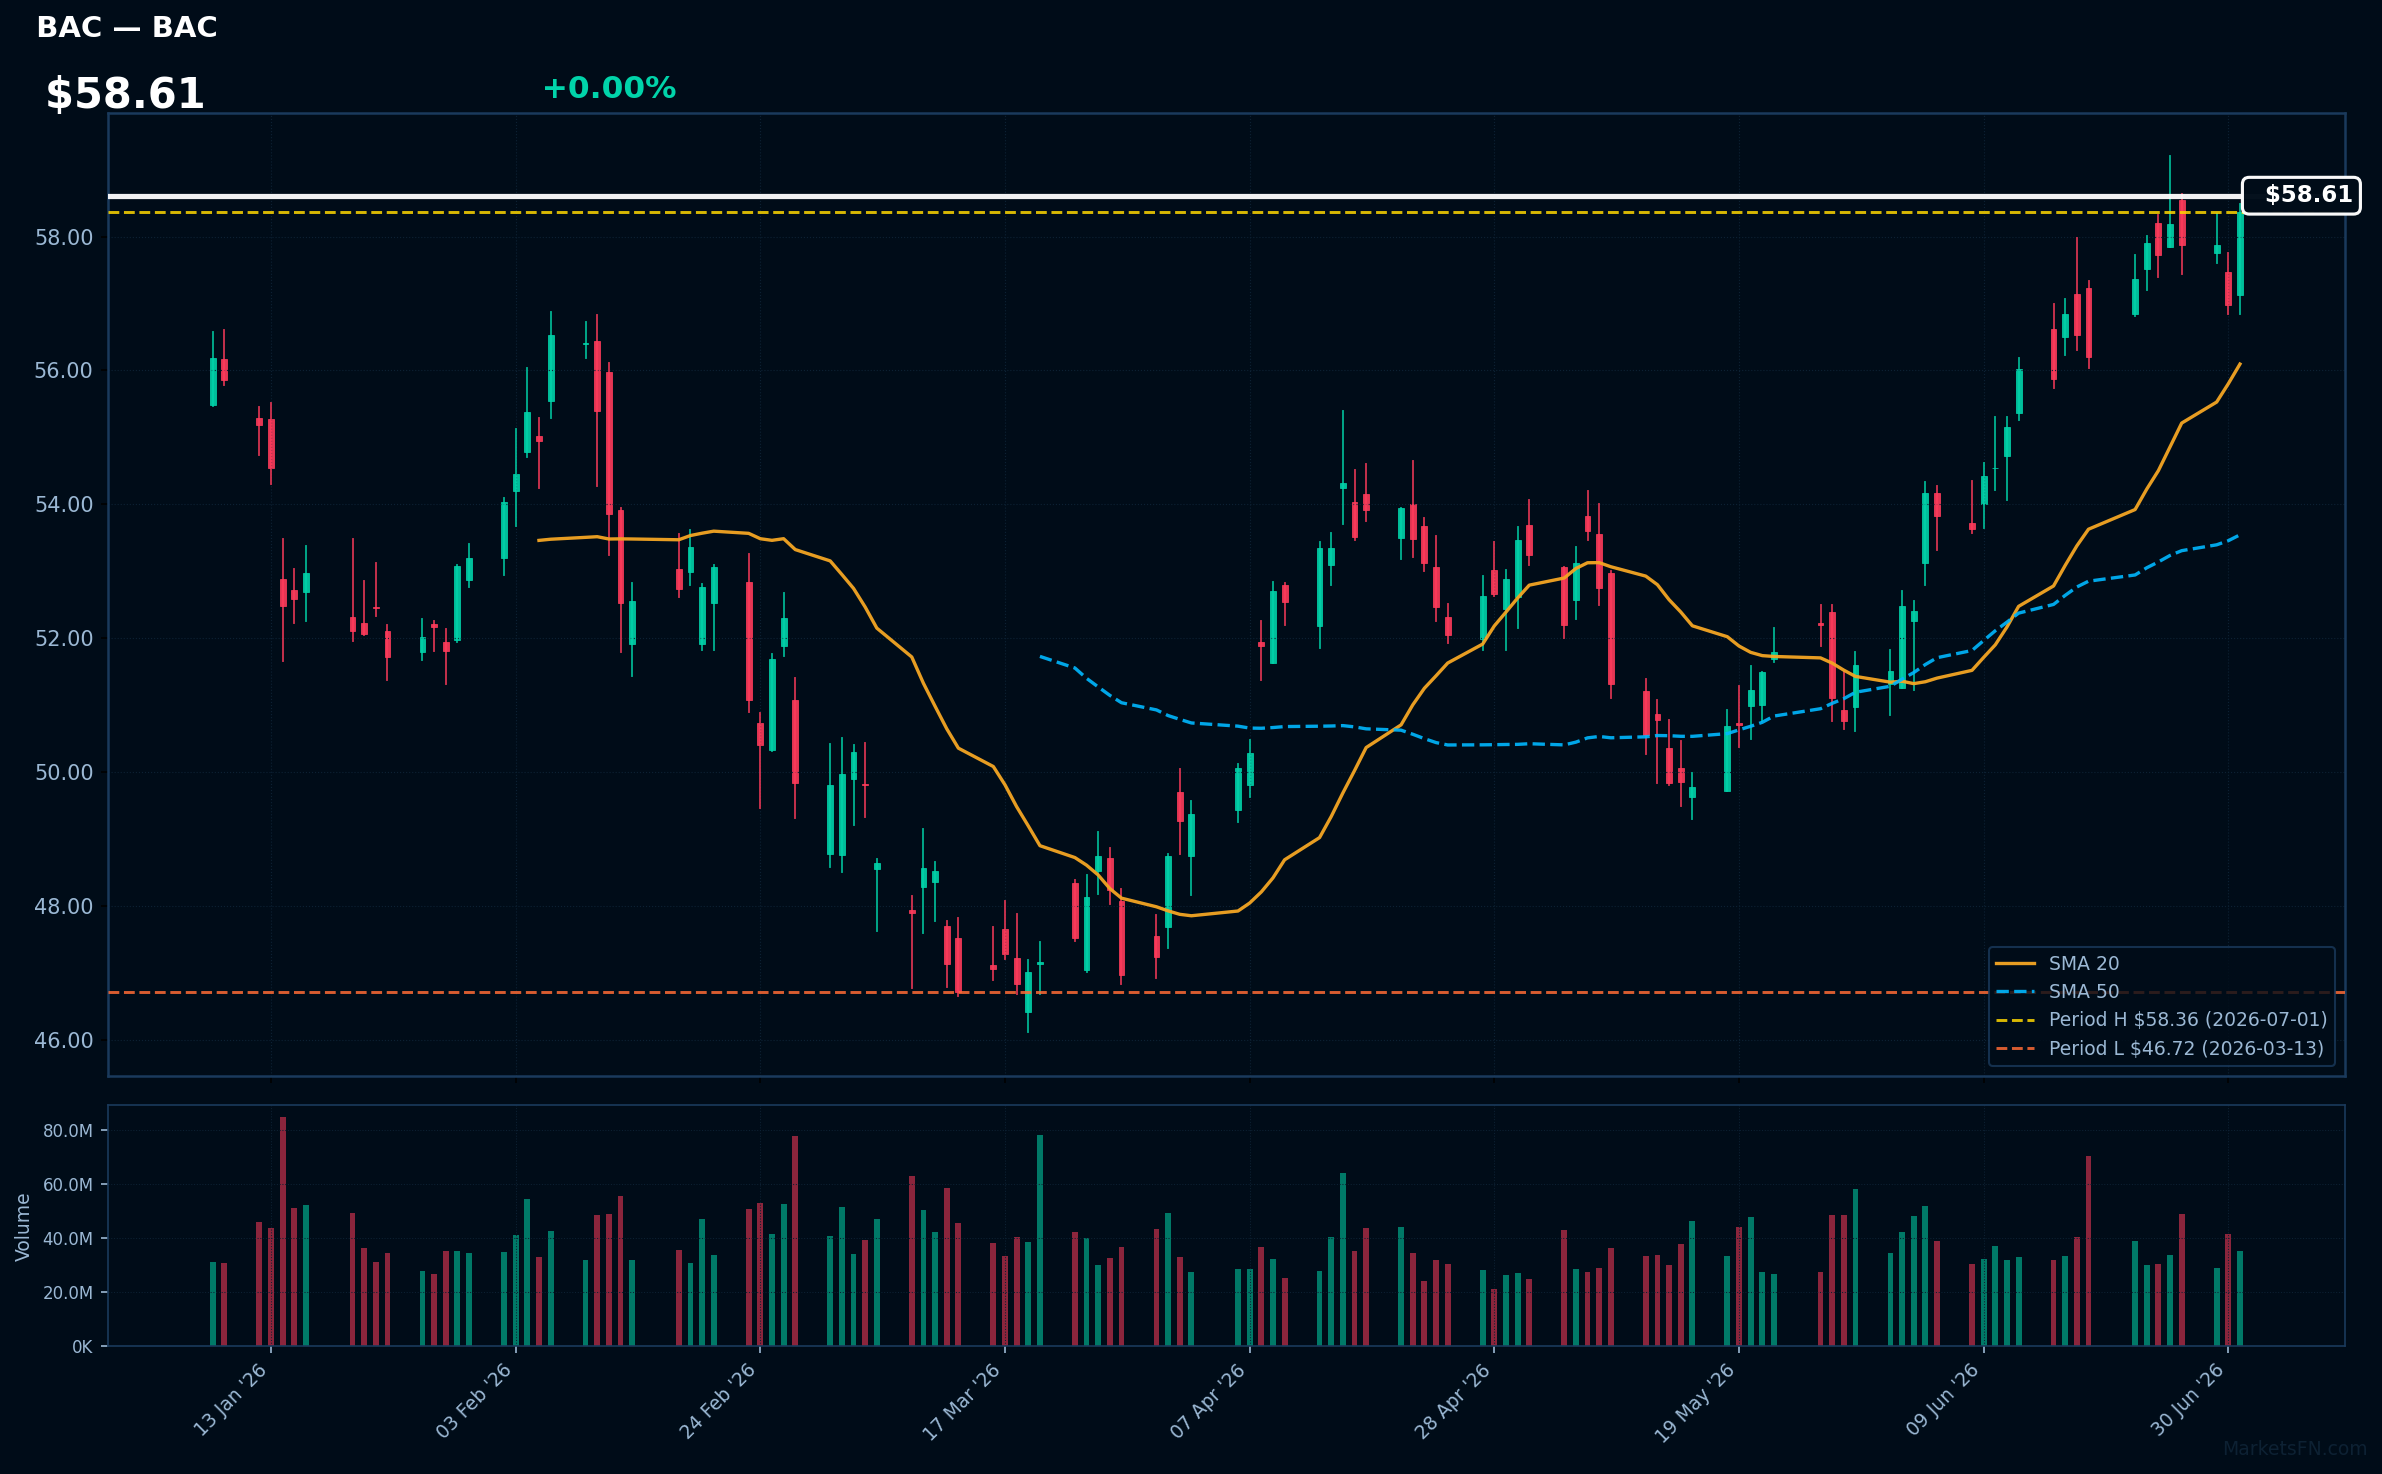
BAC | Bank Of America Corp | Financial | Price Last: $58.36 | % Realized: +4.31% | RSI: 69.7 | % above MA200: +11.0% | Trend: Above MA20, MA50, MA200
Bank Of America Corp (BAC) is a leading financial institution providing banking, investment, and wealth management services. Investors should care due to its significant market presence and potential for growth, especially in a rising interest rate environment, which can enhance profitability.
Currently, BAC shows bullish momentum with an RSI(14) of 69.7 and a strong MA alignment: price > MA20 > MA50 > MA200. It is 0.0% below its 2026 YTD high, indicating a potential breakout.
Related headlines
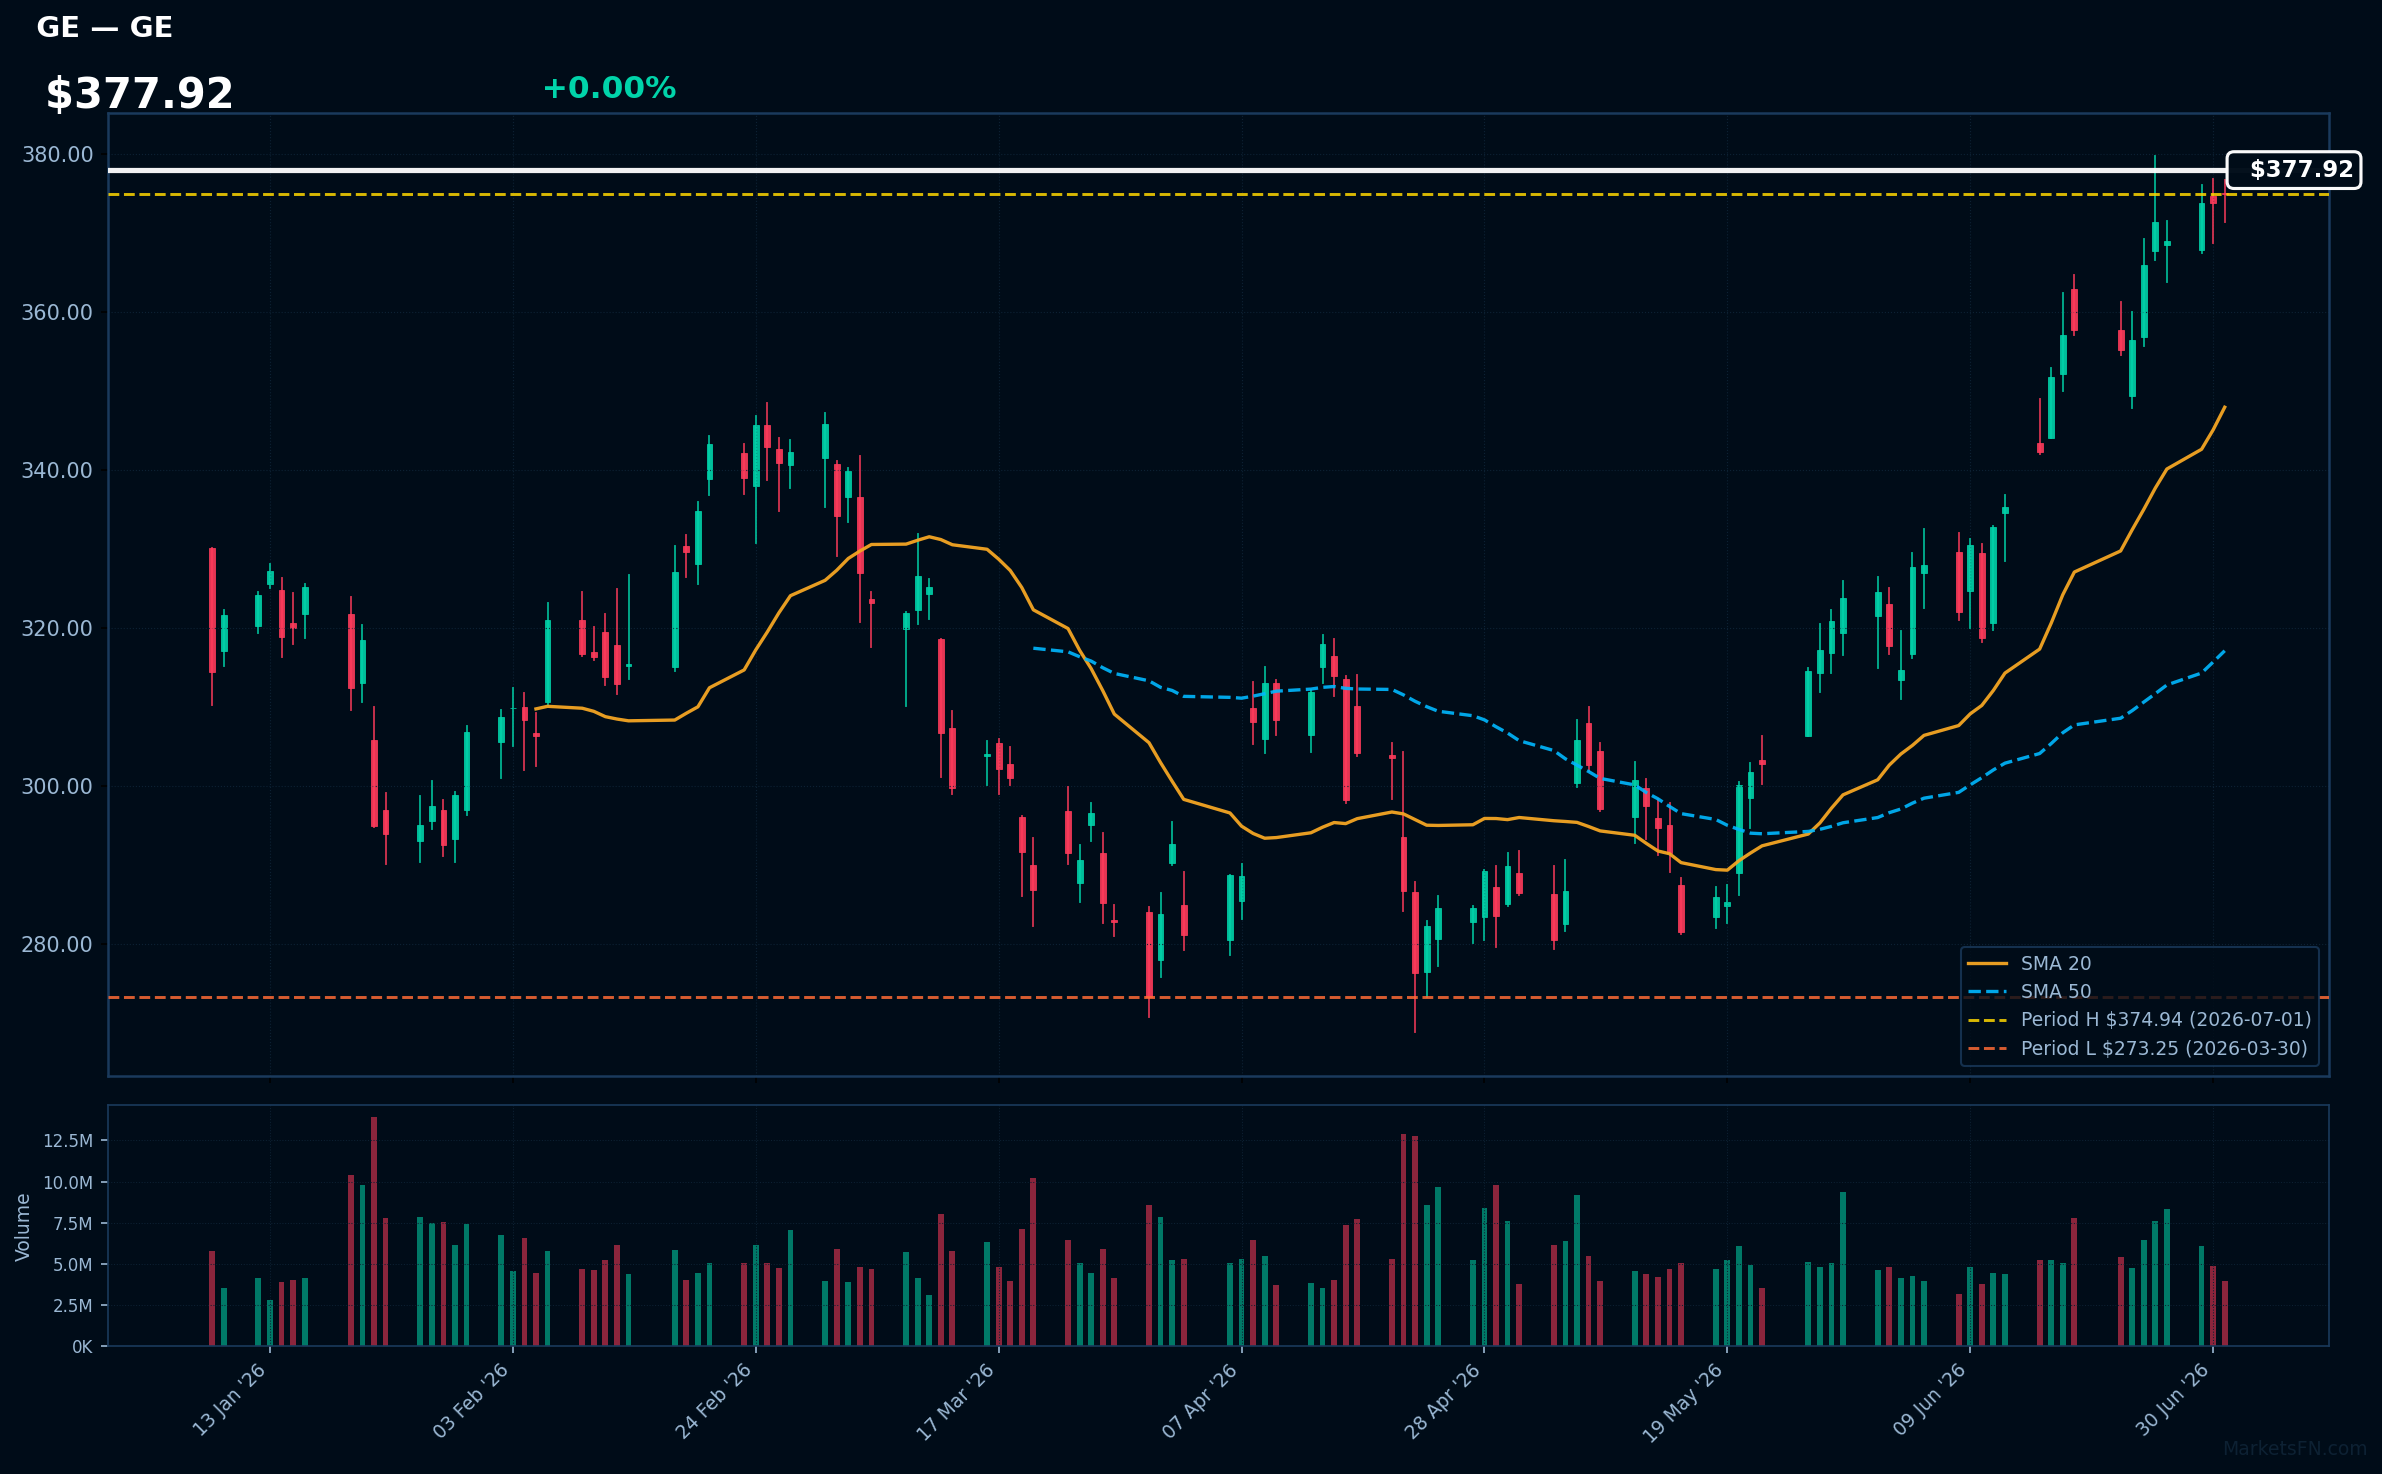
GE | GE Aerospace | Industrials | Price Last: $374.94 | % Realized: +16.89% | RSI: 76.1 | % above MA200: +21.2% | Trend: Above MA20, MA50, MA200
GE Aerospace specializes in jet engines, aircraft systems, and digital solutions for commercial and military aviation. Investors should care due to its critical role in the aerospace supply chain and potential growth driven by increasing air travel demand and defense spending.
The current technical situation indicates strong momentum, with an RSI(14) of 76.1 and a bullish MA alignment: price > MA20 > MA50 > MA200. The stock is also 0.0% below its 2026 YTD high, suggesting a potential breakout.
Related headlines
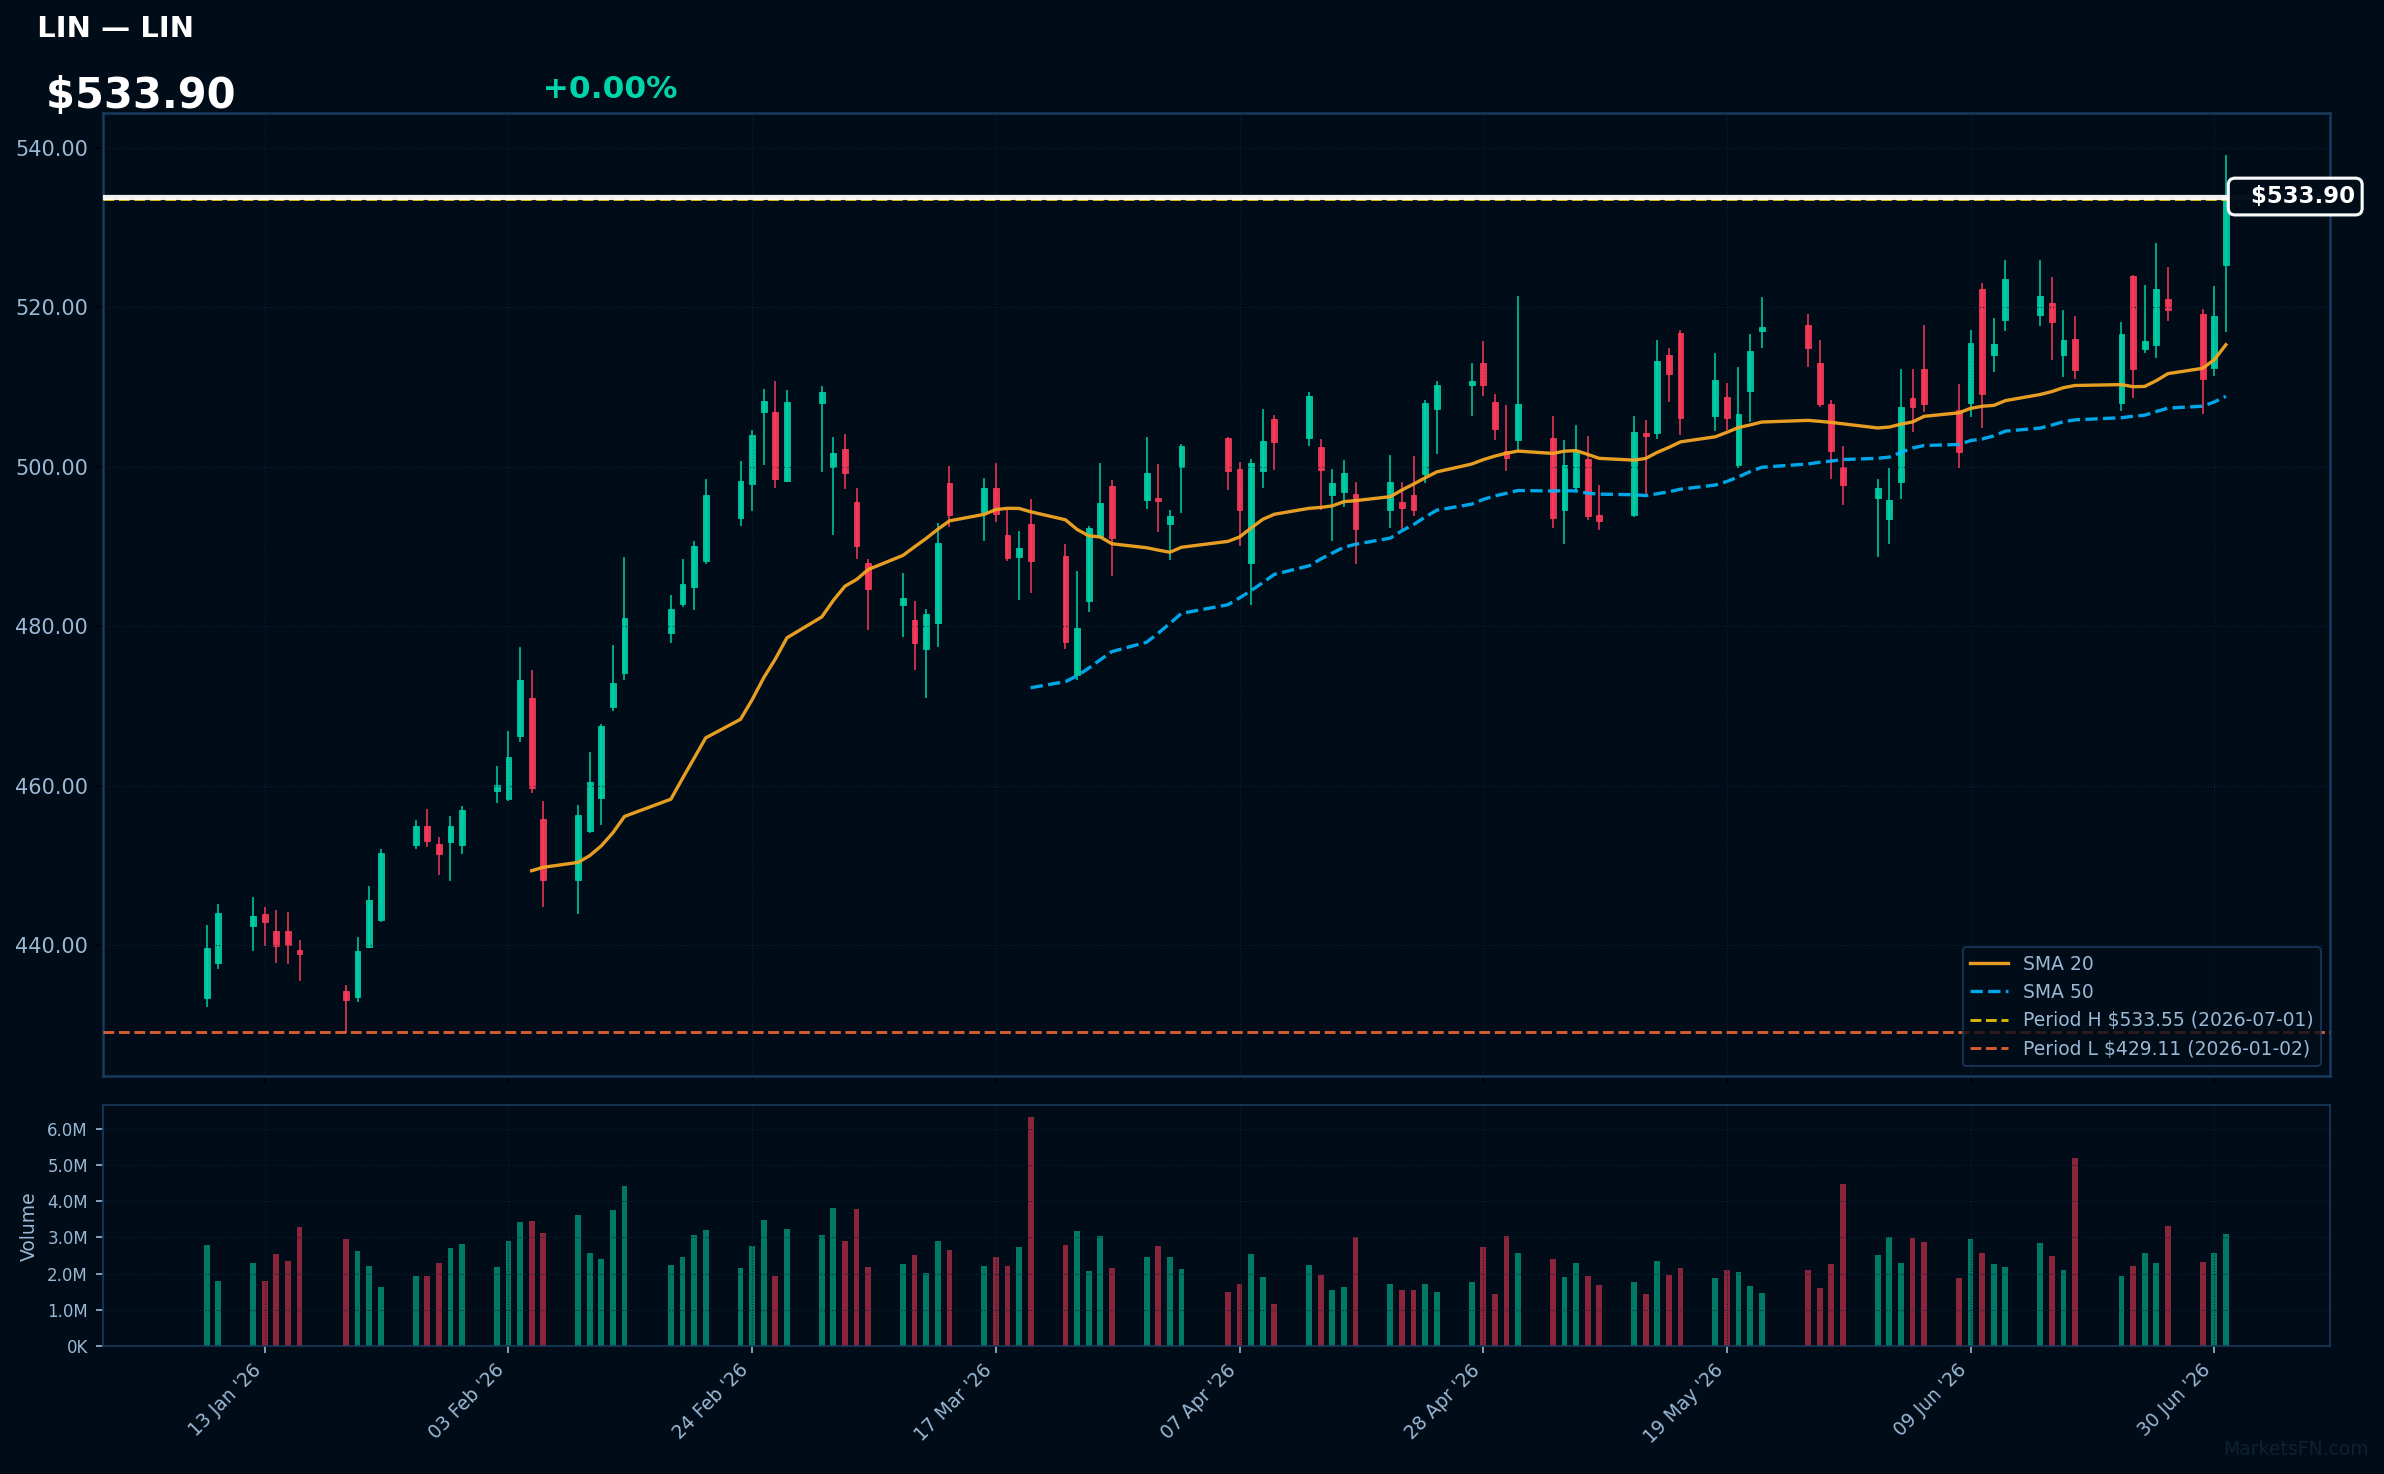
LIN | Linde Plc | Basic Materials | Price Last: $533.55 | % Realized: +24.34% | RSI: 63.1 | % above MA200: +13.6% | Trend: Above MA20, MA50, MA200
Linde Plc (LIN) is a leading global industrial gas company, providing essential gases and services for various industries, including healthcare, manufacturing, and energy. Investors should care due to its critical role in supporting sustainable practices and innovation in these sectors.
The current technical situation shows bullish momentum with an RSI(14) of 63.1 and a strong MA alignment: price > MA20 > MA50 > MA200. The stock is 0.0% below its 2026 YTD high, indicating a potential breakout.
Related headlines
- Linde Announces Second Quarter 2026 Earnings and Conference Call Schedule
- Linde Publishes 2025 Sustainable Development Report
- Linde Earns Dow Jones Best-in-Class and S&P Global Recognition for Sustainability Leadership
- Linde PLC (LIN) Q1 2026 Earnings Call Highlights: Strong EPS Growth and Strategic Acquisitions ...
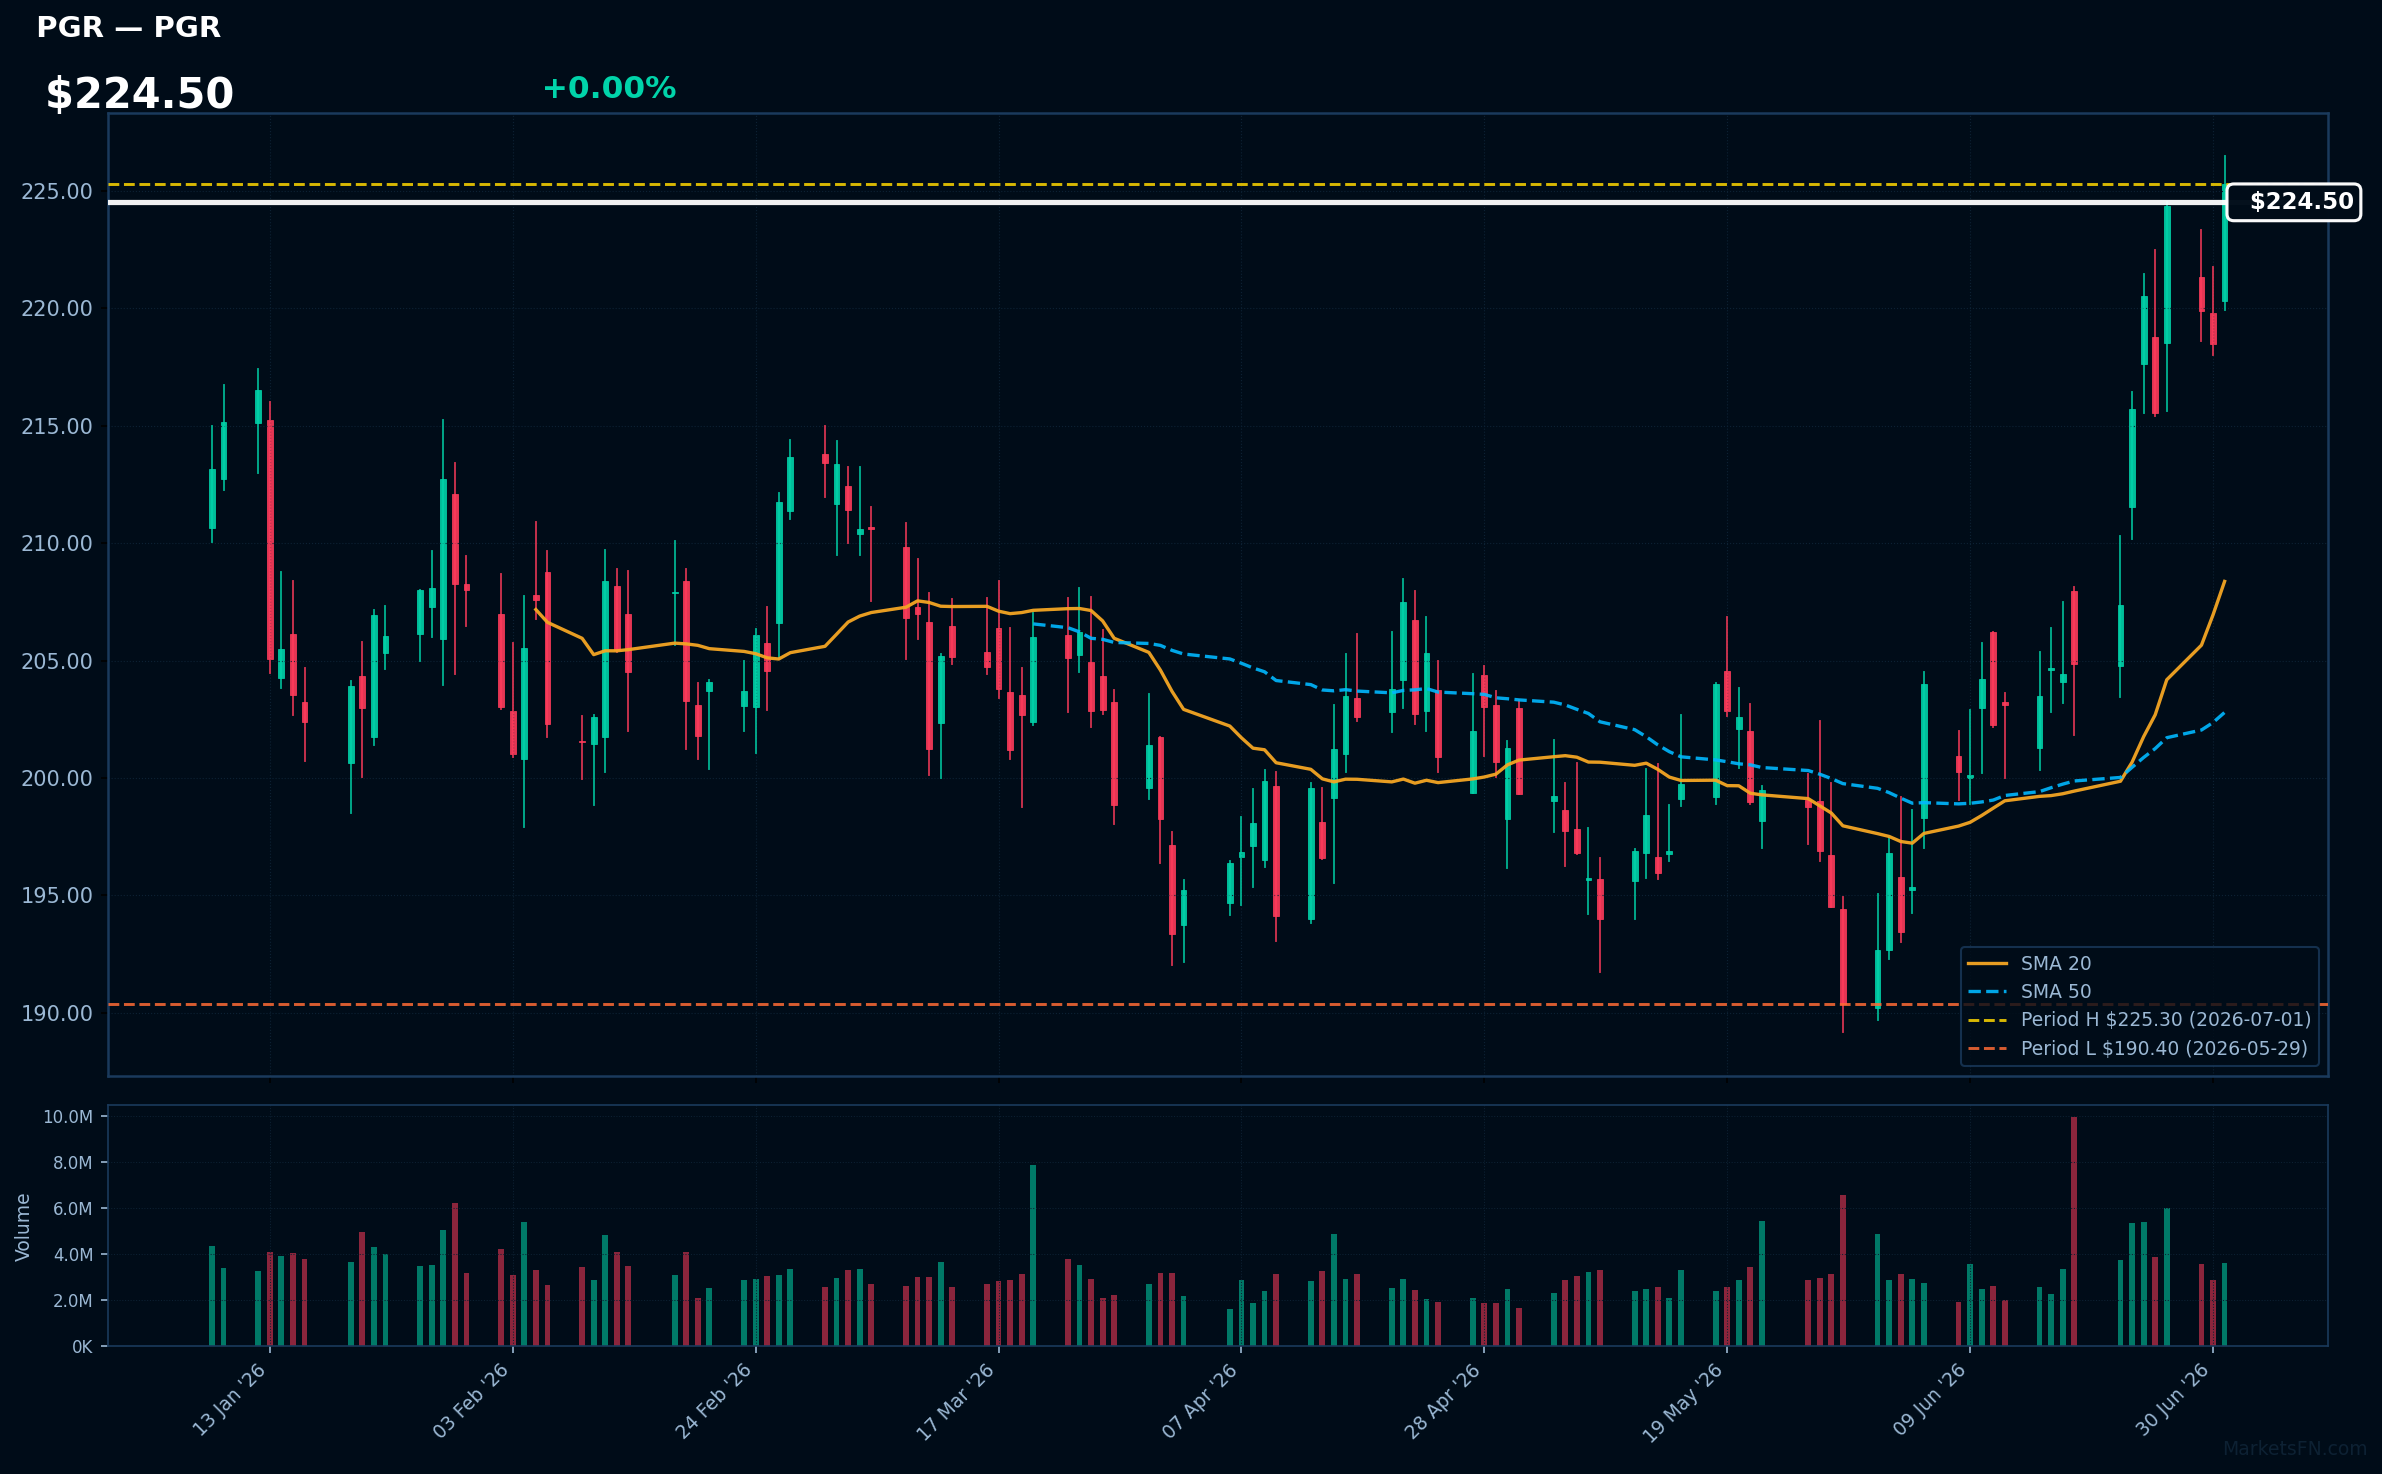
PGR | Progressive Corp | Financial | Price Last: $225.30 | % Realized: +6.21% | RSI: 67.0 | % above MA200: +5.6% | Trend: Above MA20, MA50, MA200
Progressive Corp (PGR) is a leading provider of insurance products, specializing in auto insurance. Investors should care due to its strong market position and consistent performance, which can drive growth and profitability in a competitive insurance landscape.
The current technical situation shows mixed signals with an RSI(14) of 67.0, indicating potential overbought conditions, while the price is above MA20/MA50/MA200. The stock is 0.0% below its 2026 YTD high, suggesting a near breakout.
Related headlines
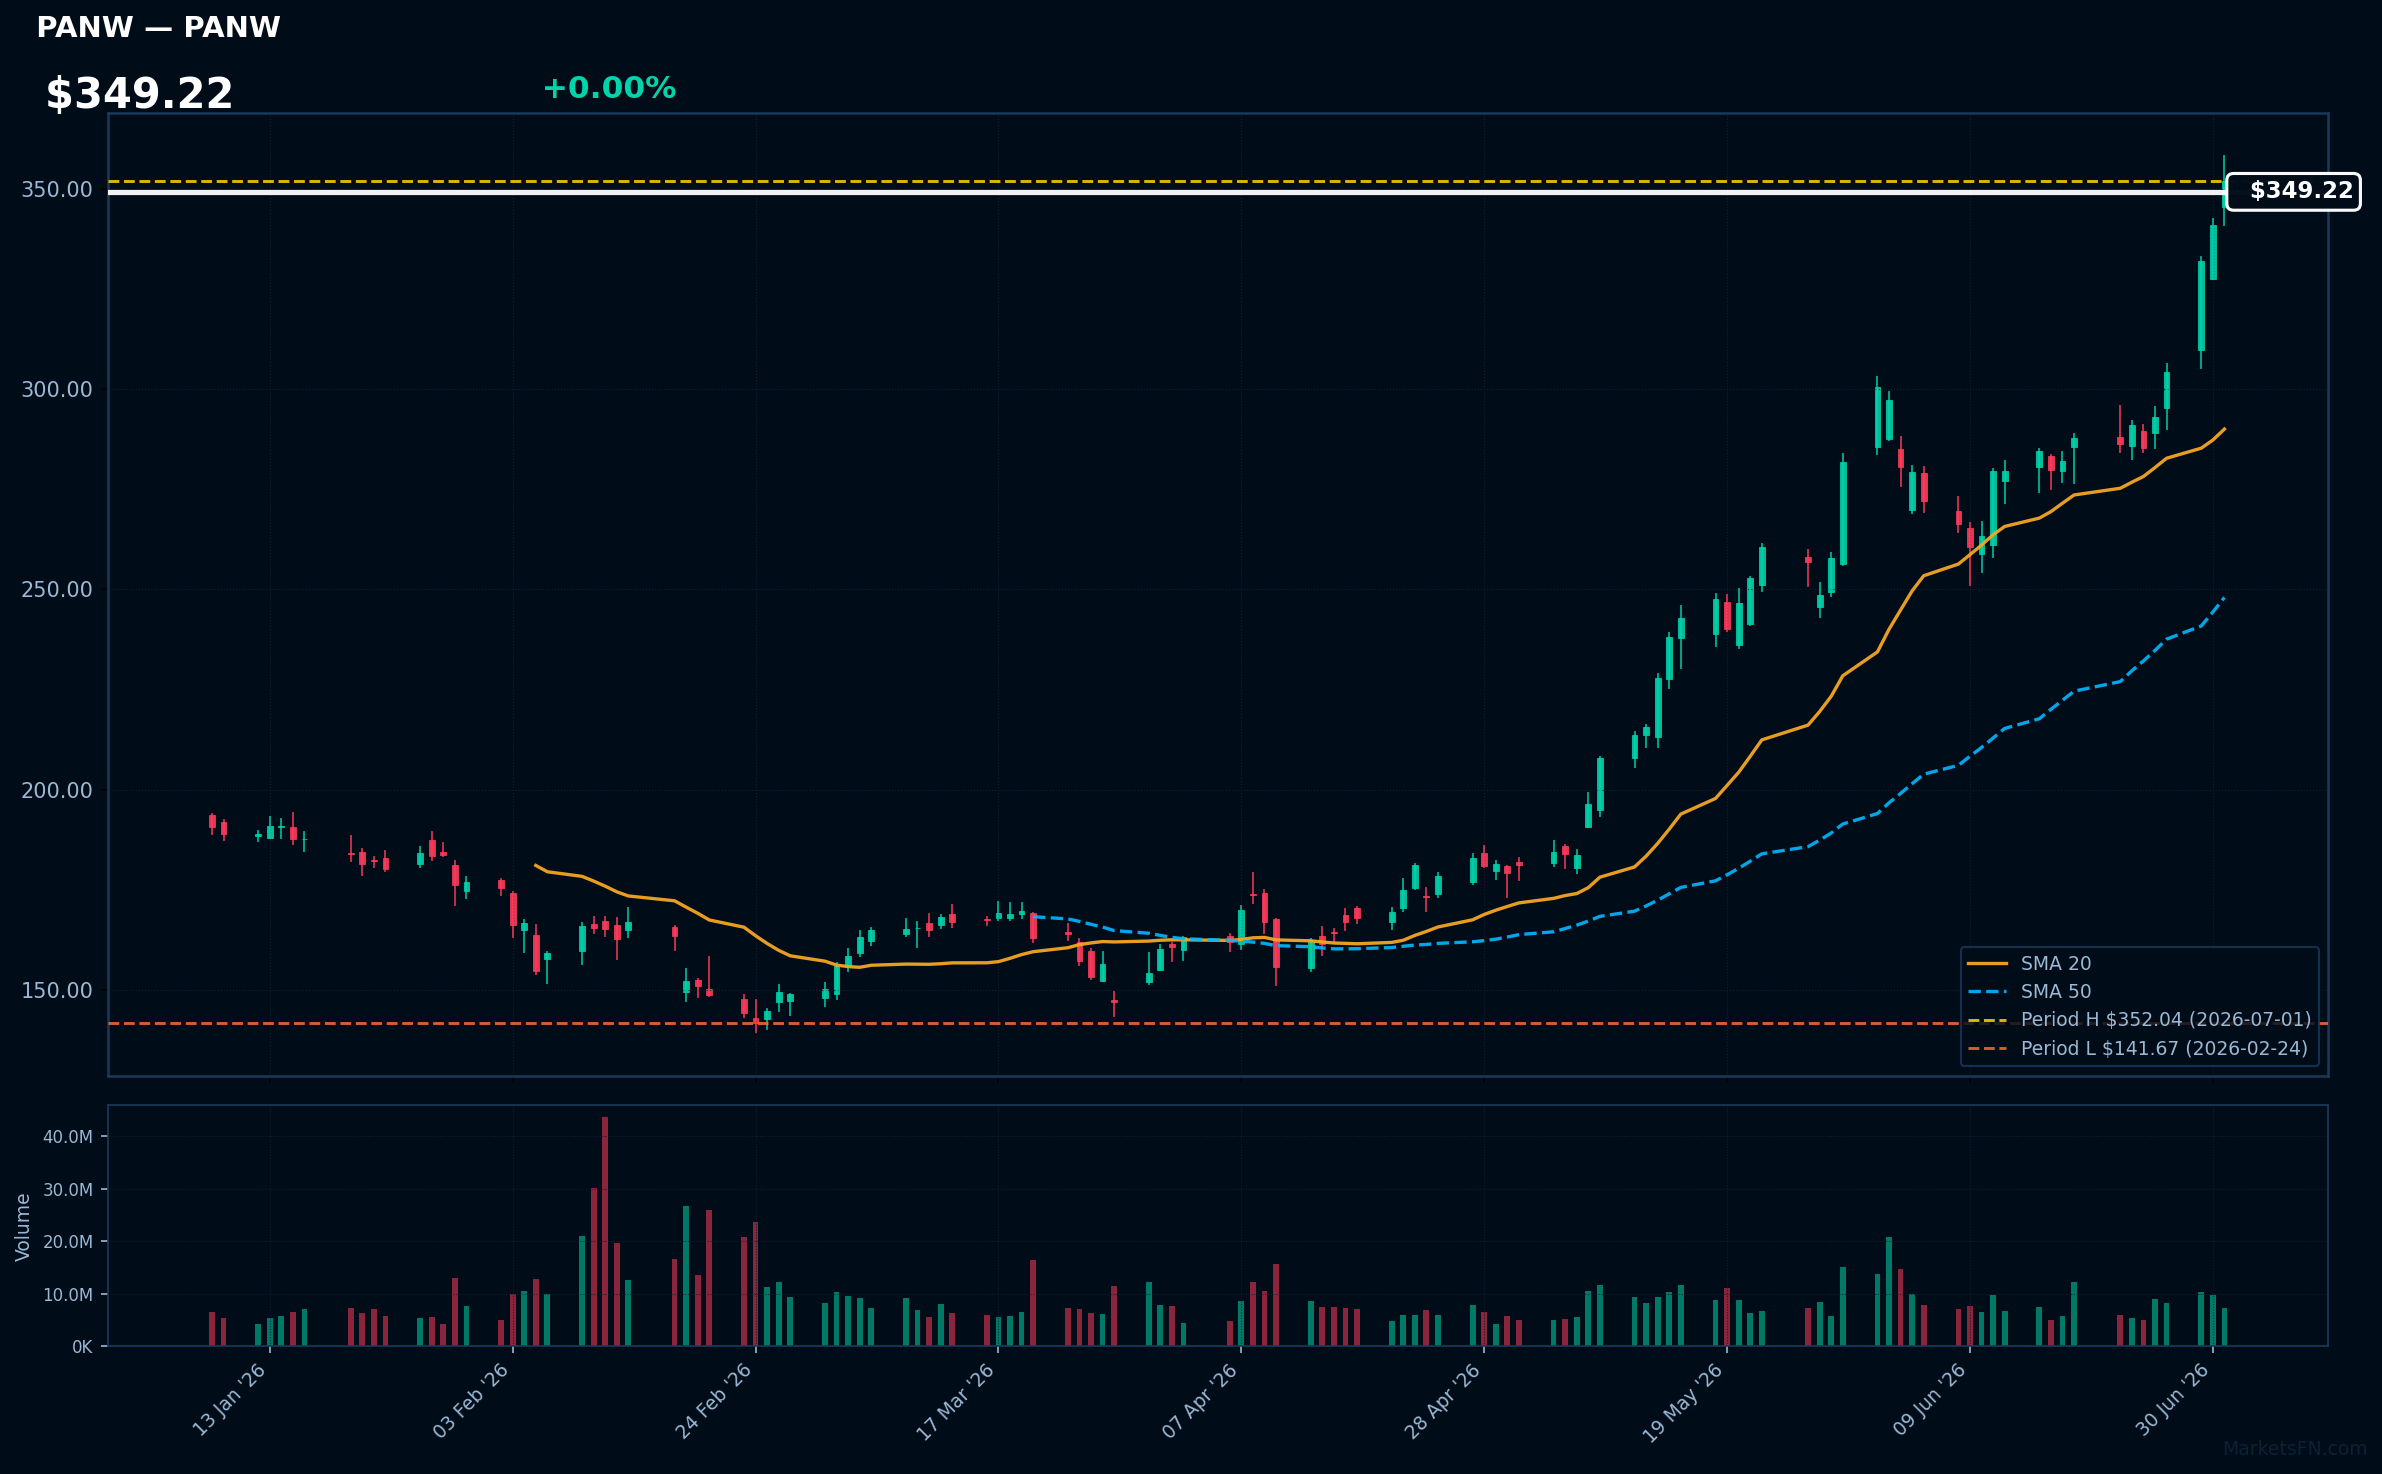
PANW | Palo Alto Networks Inc | Technology | Price Last: $352.04 | % Realized: +96.26% | RSI: 79.3 | % above MA200: +74.7% | Trend: Above MA20, MA50, MA200
Palo Alto Networks Inc specializes in cybersecurity solutions, providing advanced firewalls and cloud-based security services. Investors should care due to the increasing demand for cybersecurity amid rising digital threats, positioning the company for sustained growth and market relevance.
The current technical situation indicates strong momentum, with an RSI(14) of 79.3 and a bullish MA alignment: price > MA20 > MA50 > MA200. The stock is also 0.0% below its 2026 YTD high.
Related headlines
📉 Nearest to 2026 Low
Sectors represented: Consumer Cyclical (2), Consumer Defensive (1), Communication Services (1), Utilities (1)
| Ticker | Company | Sector | Price Last | % Realized | 2026 YTD Low Date | RSI | % above MA200 | Trend |
|---|---|---|---|---|---|---|---|---|
| WMT | Walmart Inc | Consumer Defensive | $108.82 | -3.49% | 2026-07-01 | 29.8 | -7.0% | Below MA20, MA50, MA200 |
| T | AT&T, Inc | Communication Services | $20.48 | -16.61% | 2026-07-01 | 31.4 | -20.4% | Below MA20, MA50, MA200 |
| CEG | Constellation Energy Corporation | Utilities | $236.50 | -35.43% | 2026-07-01 | 35.1 | -25.4% | Below MA20, MA50, MA200 |
| HAS | Hasbro, Inc | Consumer Cyclical | $81.46 | -1.82% | 2026-07-01 | 39.2 | -5.7% | Below MA20, MA50, MA200 |
| LVS | Las Vegas Sands Corp | Consumer Cyclical | $46.25 | -29.08% | 2026-06-30 | 36.3 | -18.1% | Below MA20, MA50, MA200 |
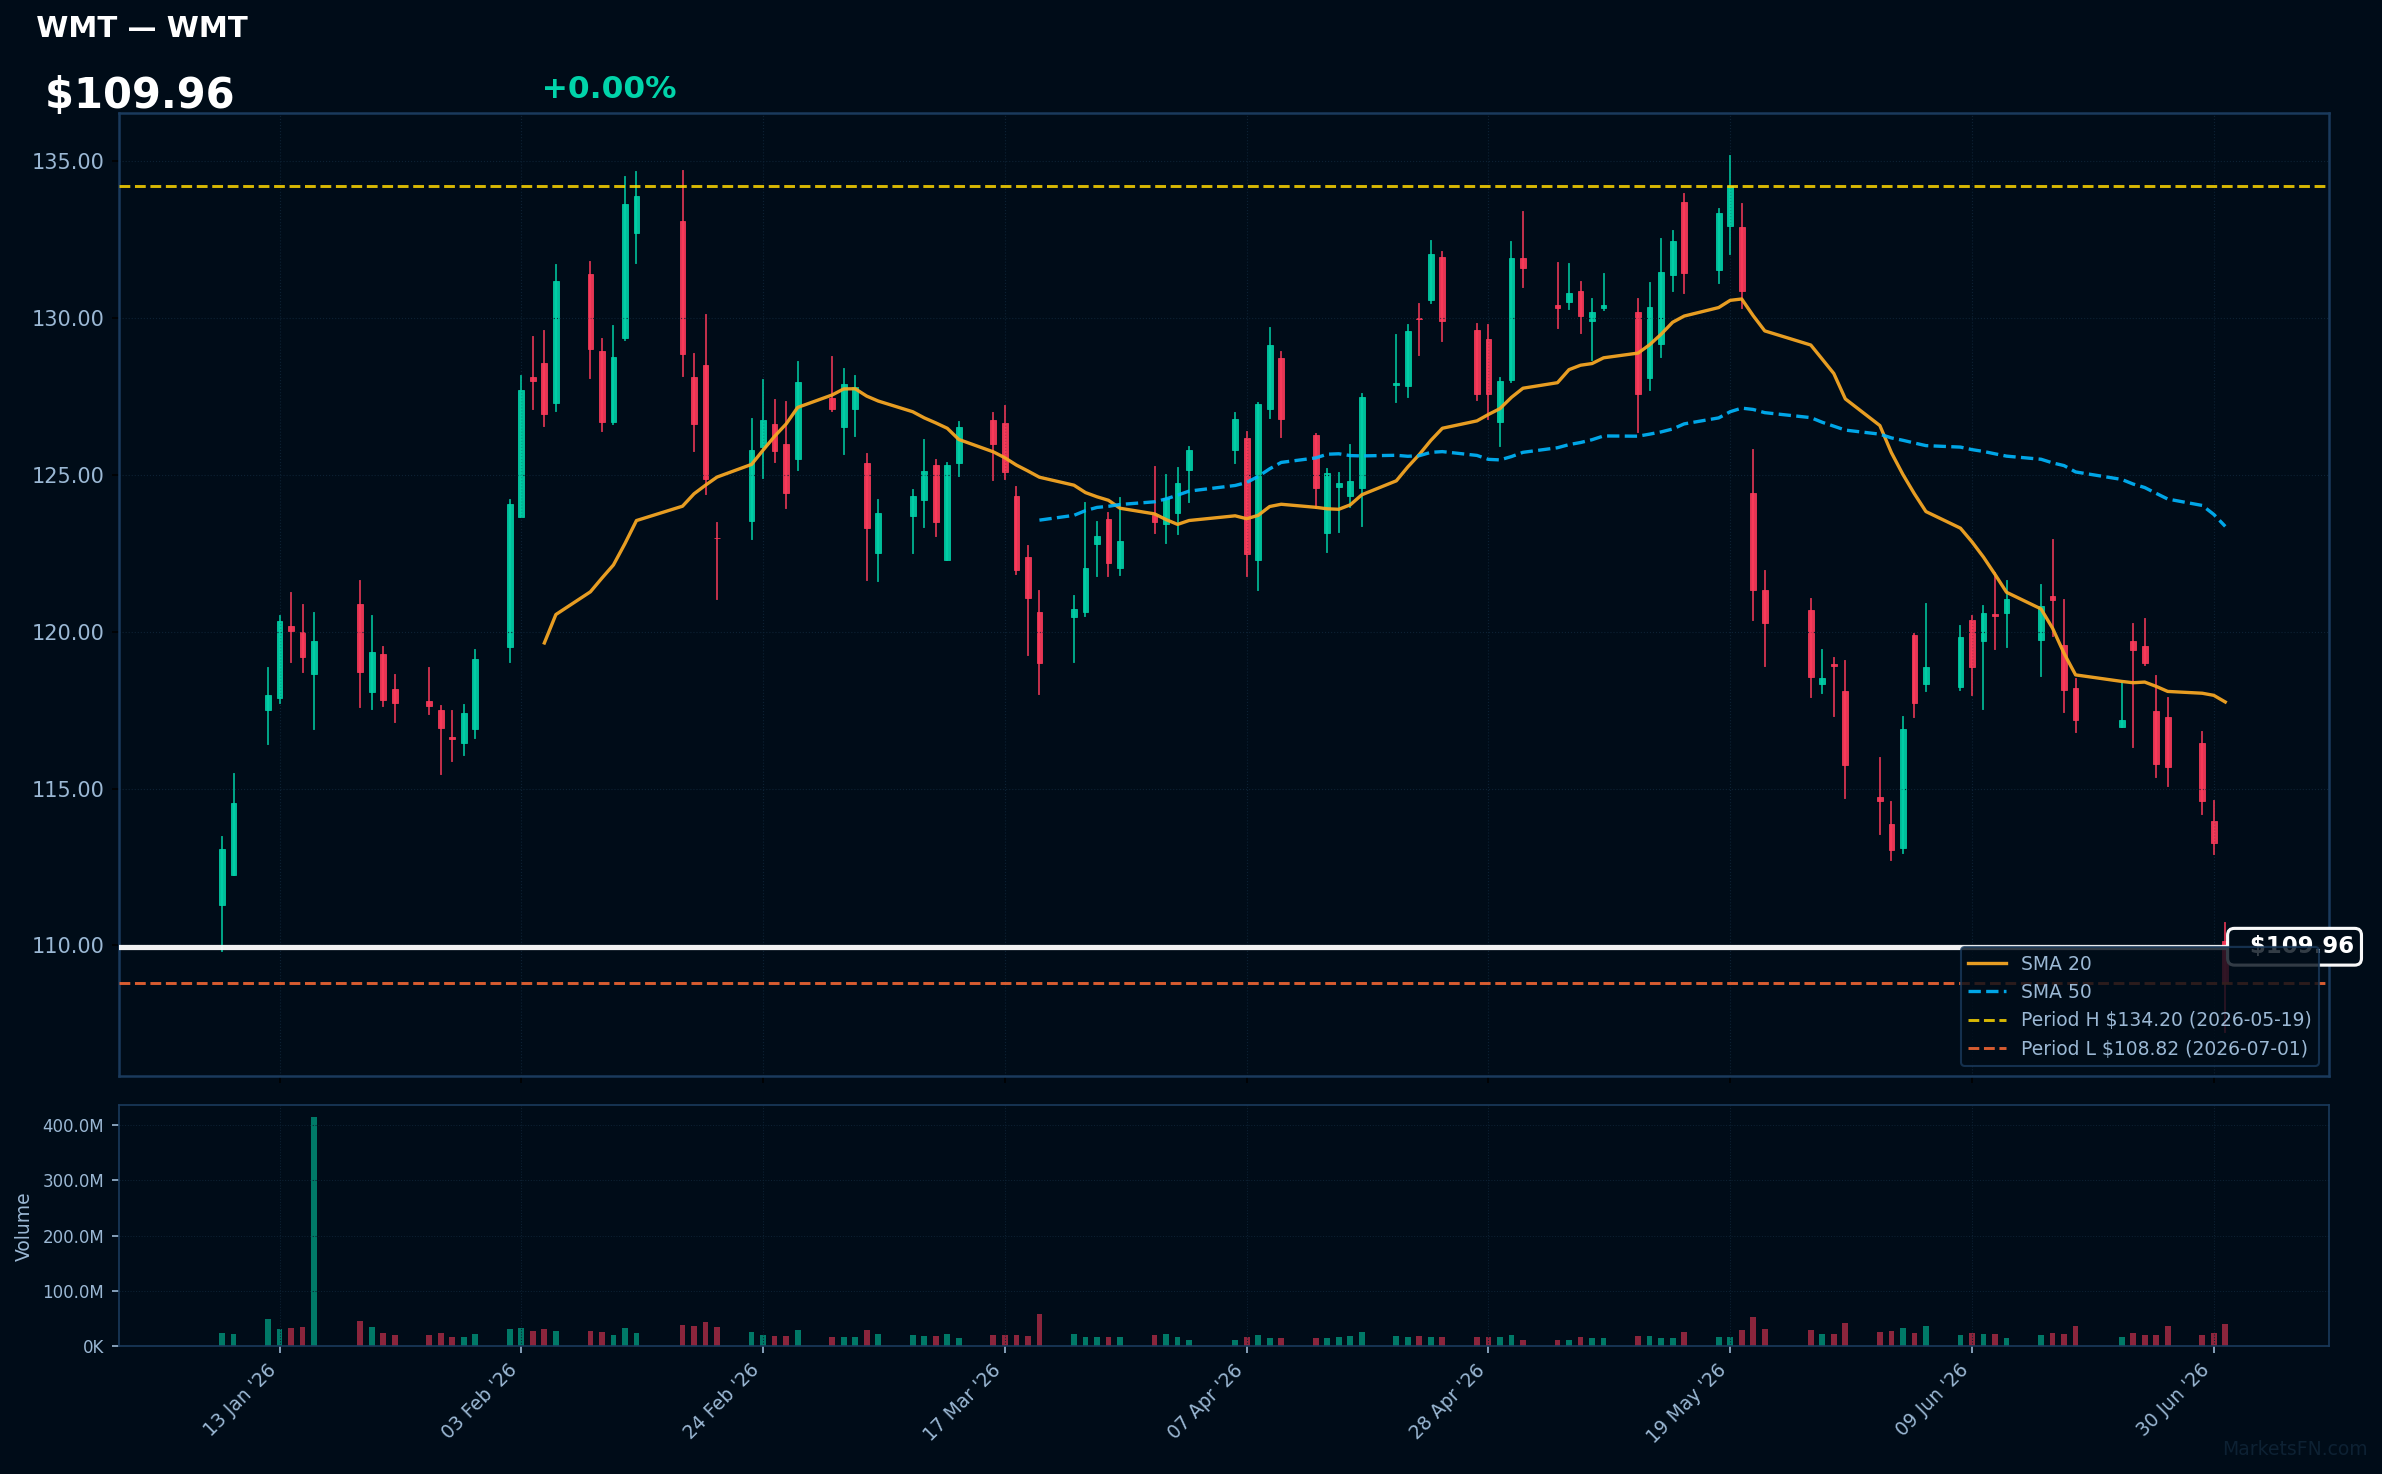
WMT | Walmart Inc | Consumer Defensive | Price Last: $108.82 | % Realized: -3.49% | RSI: 29.8 | % above MA200: -7.0% | Trend: Below MA20, MA50, MA200
Walmart Inc operates as a multinational retail corporation, offering a wide range of products including groceries, electronics, and clothing. Investors should care due to its significant market presence and ability to adapt to consumer trends, impacting revenue stability and growth potential.
The current technical situation shows a bearish trend with an RSI(14) of 29.8, indicating oversold conditions. Additionally, the stock is below MA20, MA50, and MA200, signaling mixed signals and potential warning signs for investors.
Related headlines
- S&P 500, Nasdaq End Lower As Investors Continue Rotation Out Of Tech And Chipmakers WMT, META, GM, KR, QCOM In Focus
- How Walmart, Amazon, and Other Retailers Get Traction at the Head of the Delivery Race
- WMT Stock Sinks To Near Eight-Month Low Cleveland Research Flags Slowing Sales
- Dow's 184-point fall led by losses in Walmart, Caterpillar shares
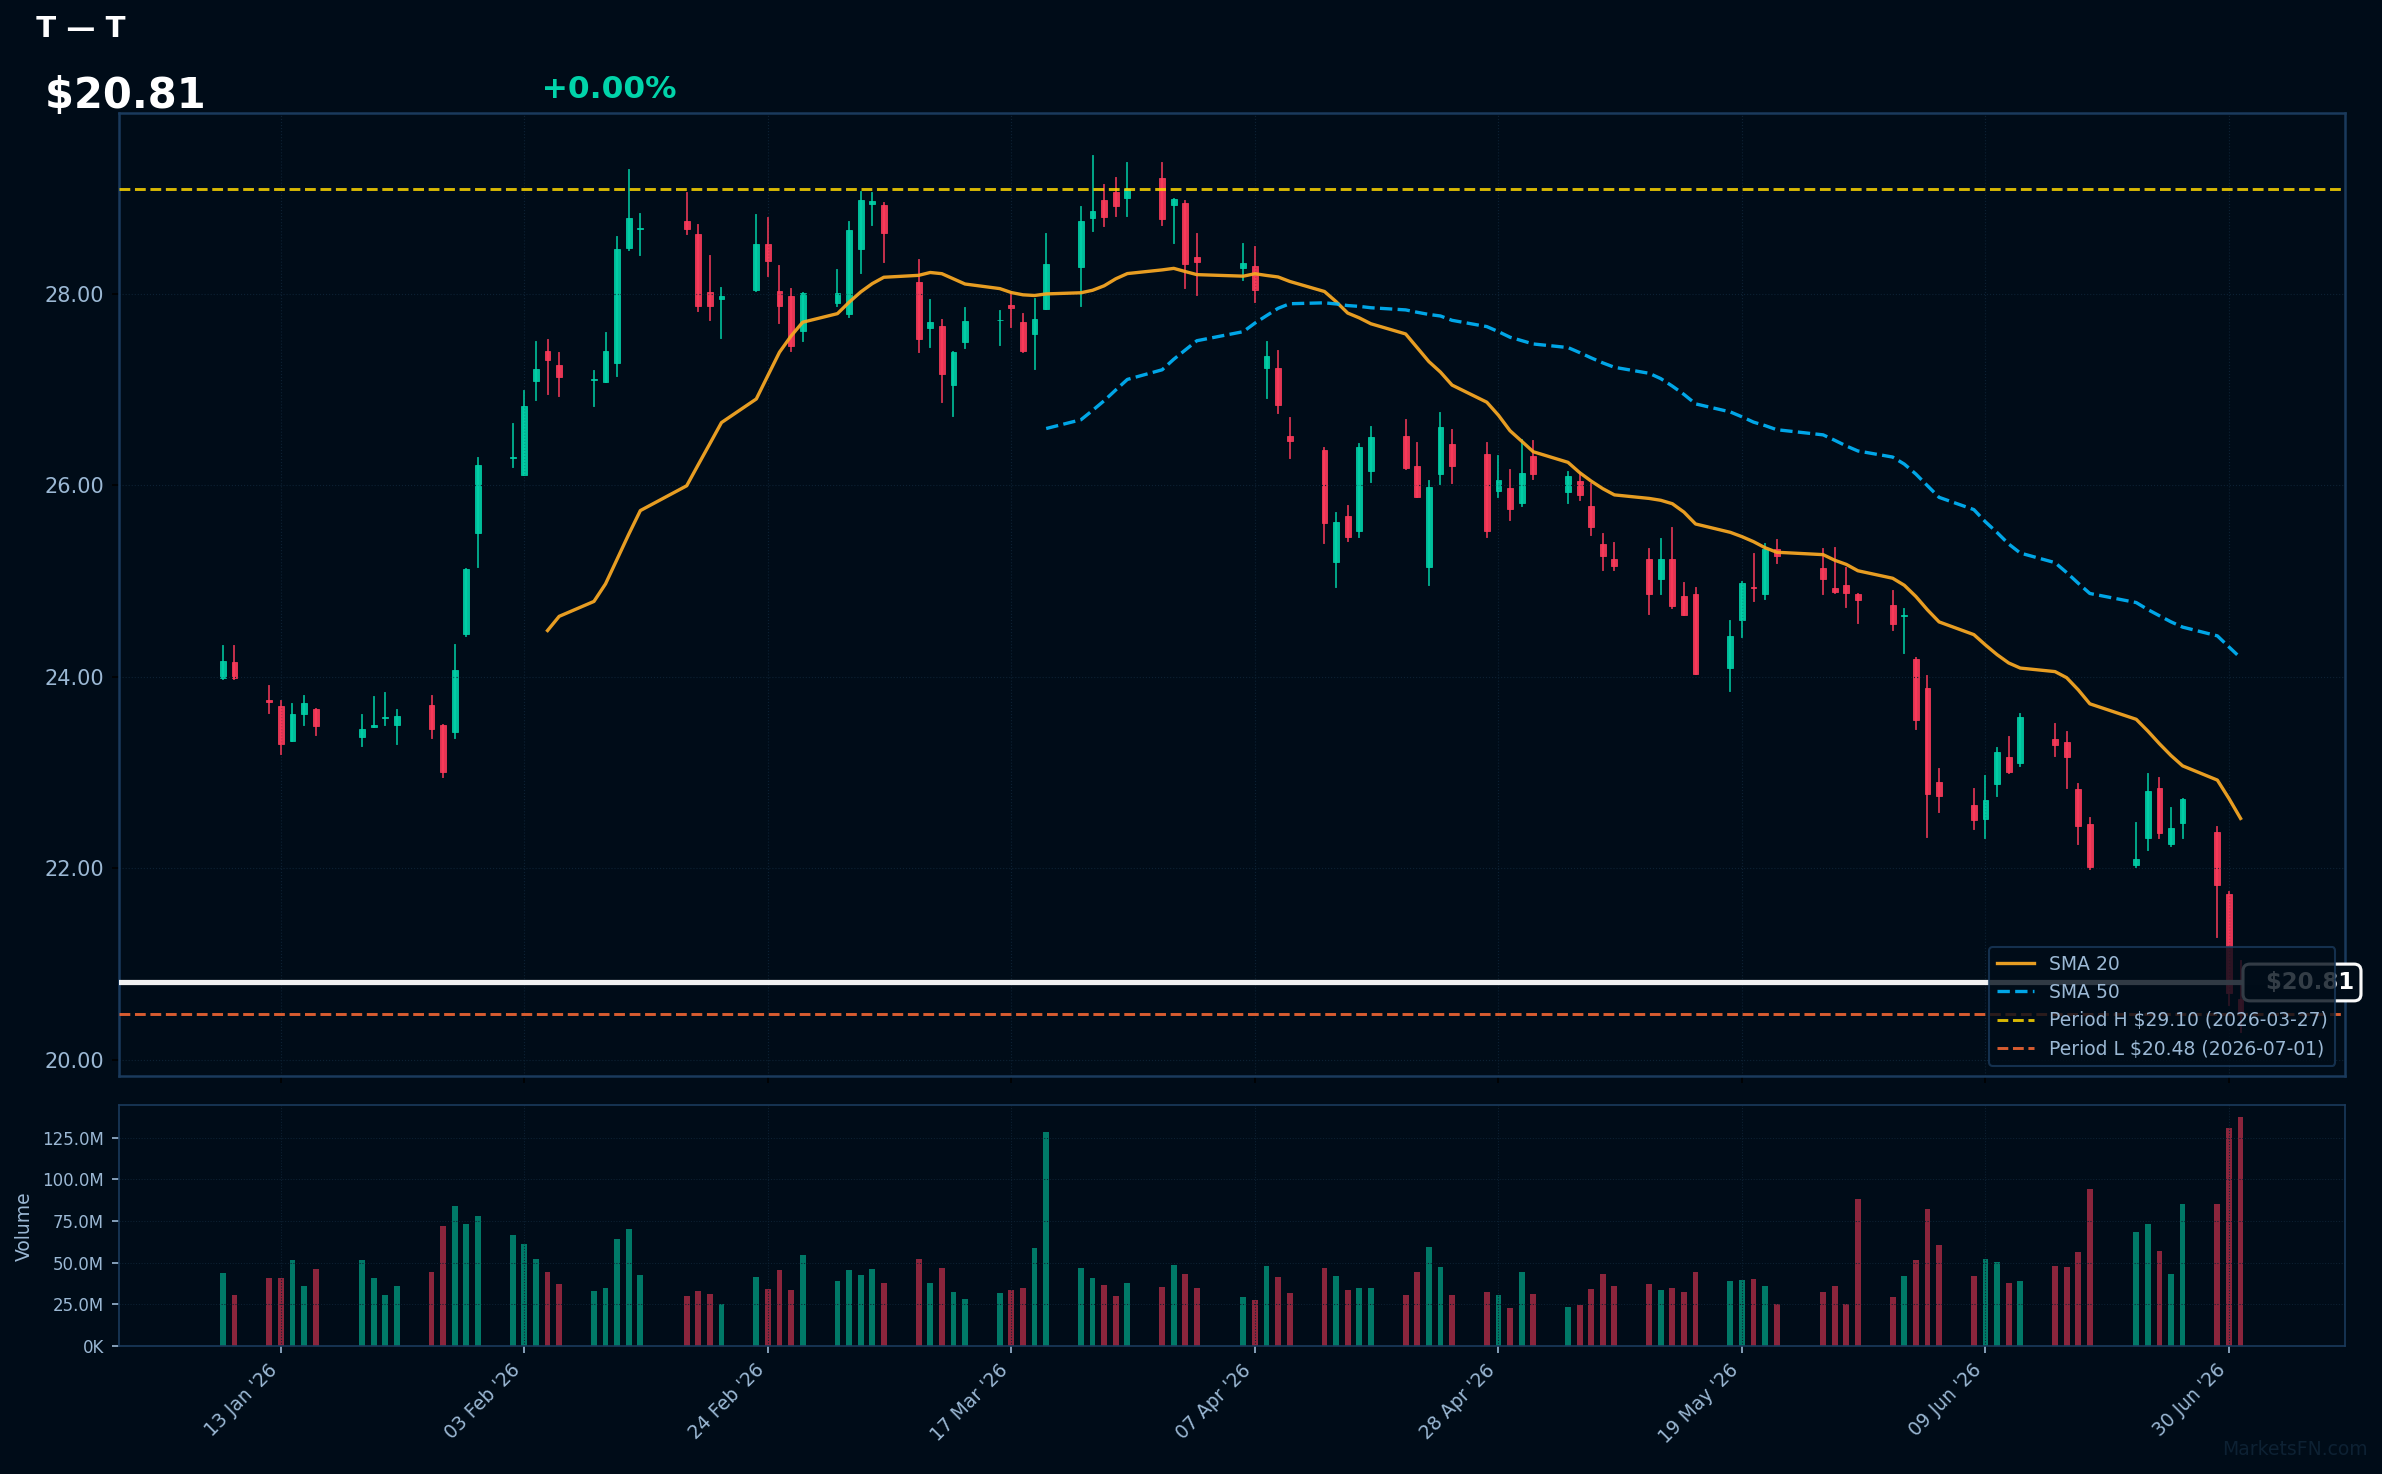
T | AT&T, Inc | Communication Services | Price Last: $20.48 | % Realized: -16.61% | RSI: 31.4 | % above MA200: -20.4% | Trend: Below MA20, MA50, MA200
AT&T, Inc. provides telecommunications, media, and technology services, including wireless communications, broadband, and digital entertainment. Investors should care due to its significant market presence and potential for dividends, despite recent performance challenges.
The current technical situation signals a warning sign, with an RSI of 31.4 indicating oversold conditions and a bearish MA alignment: price < MA20 < MA50 < MA200.
Related headlines
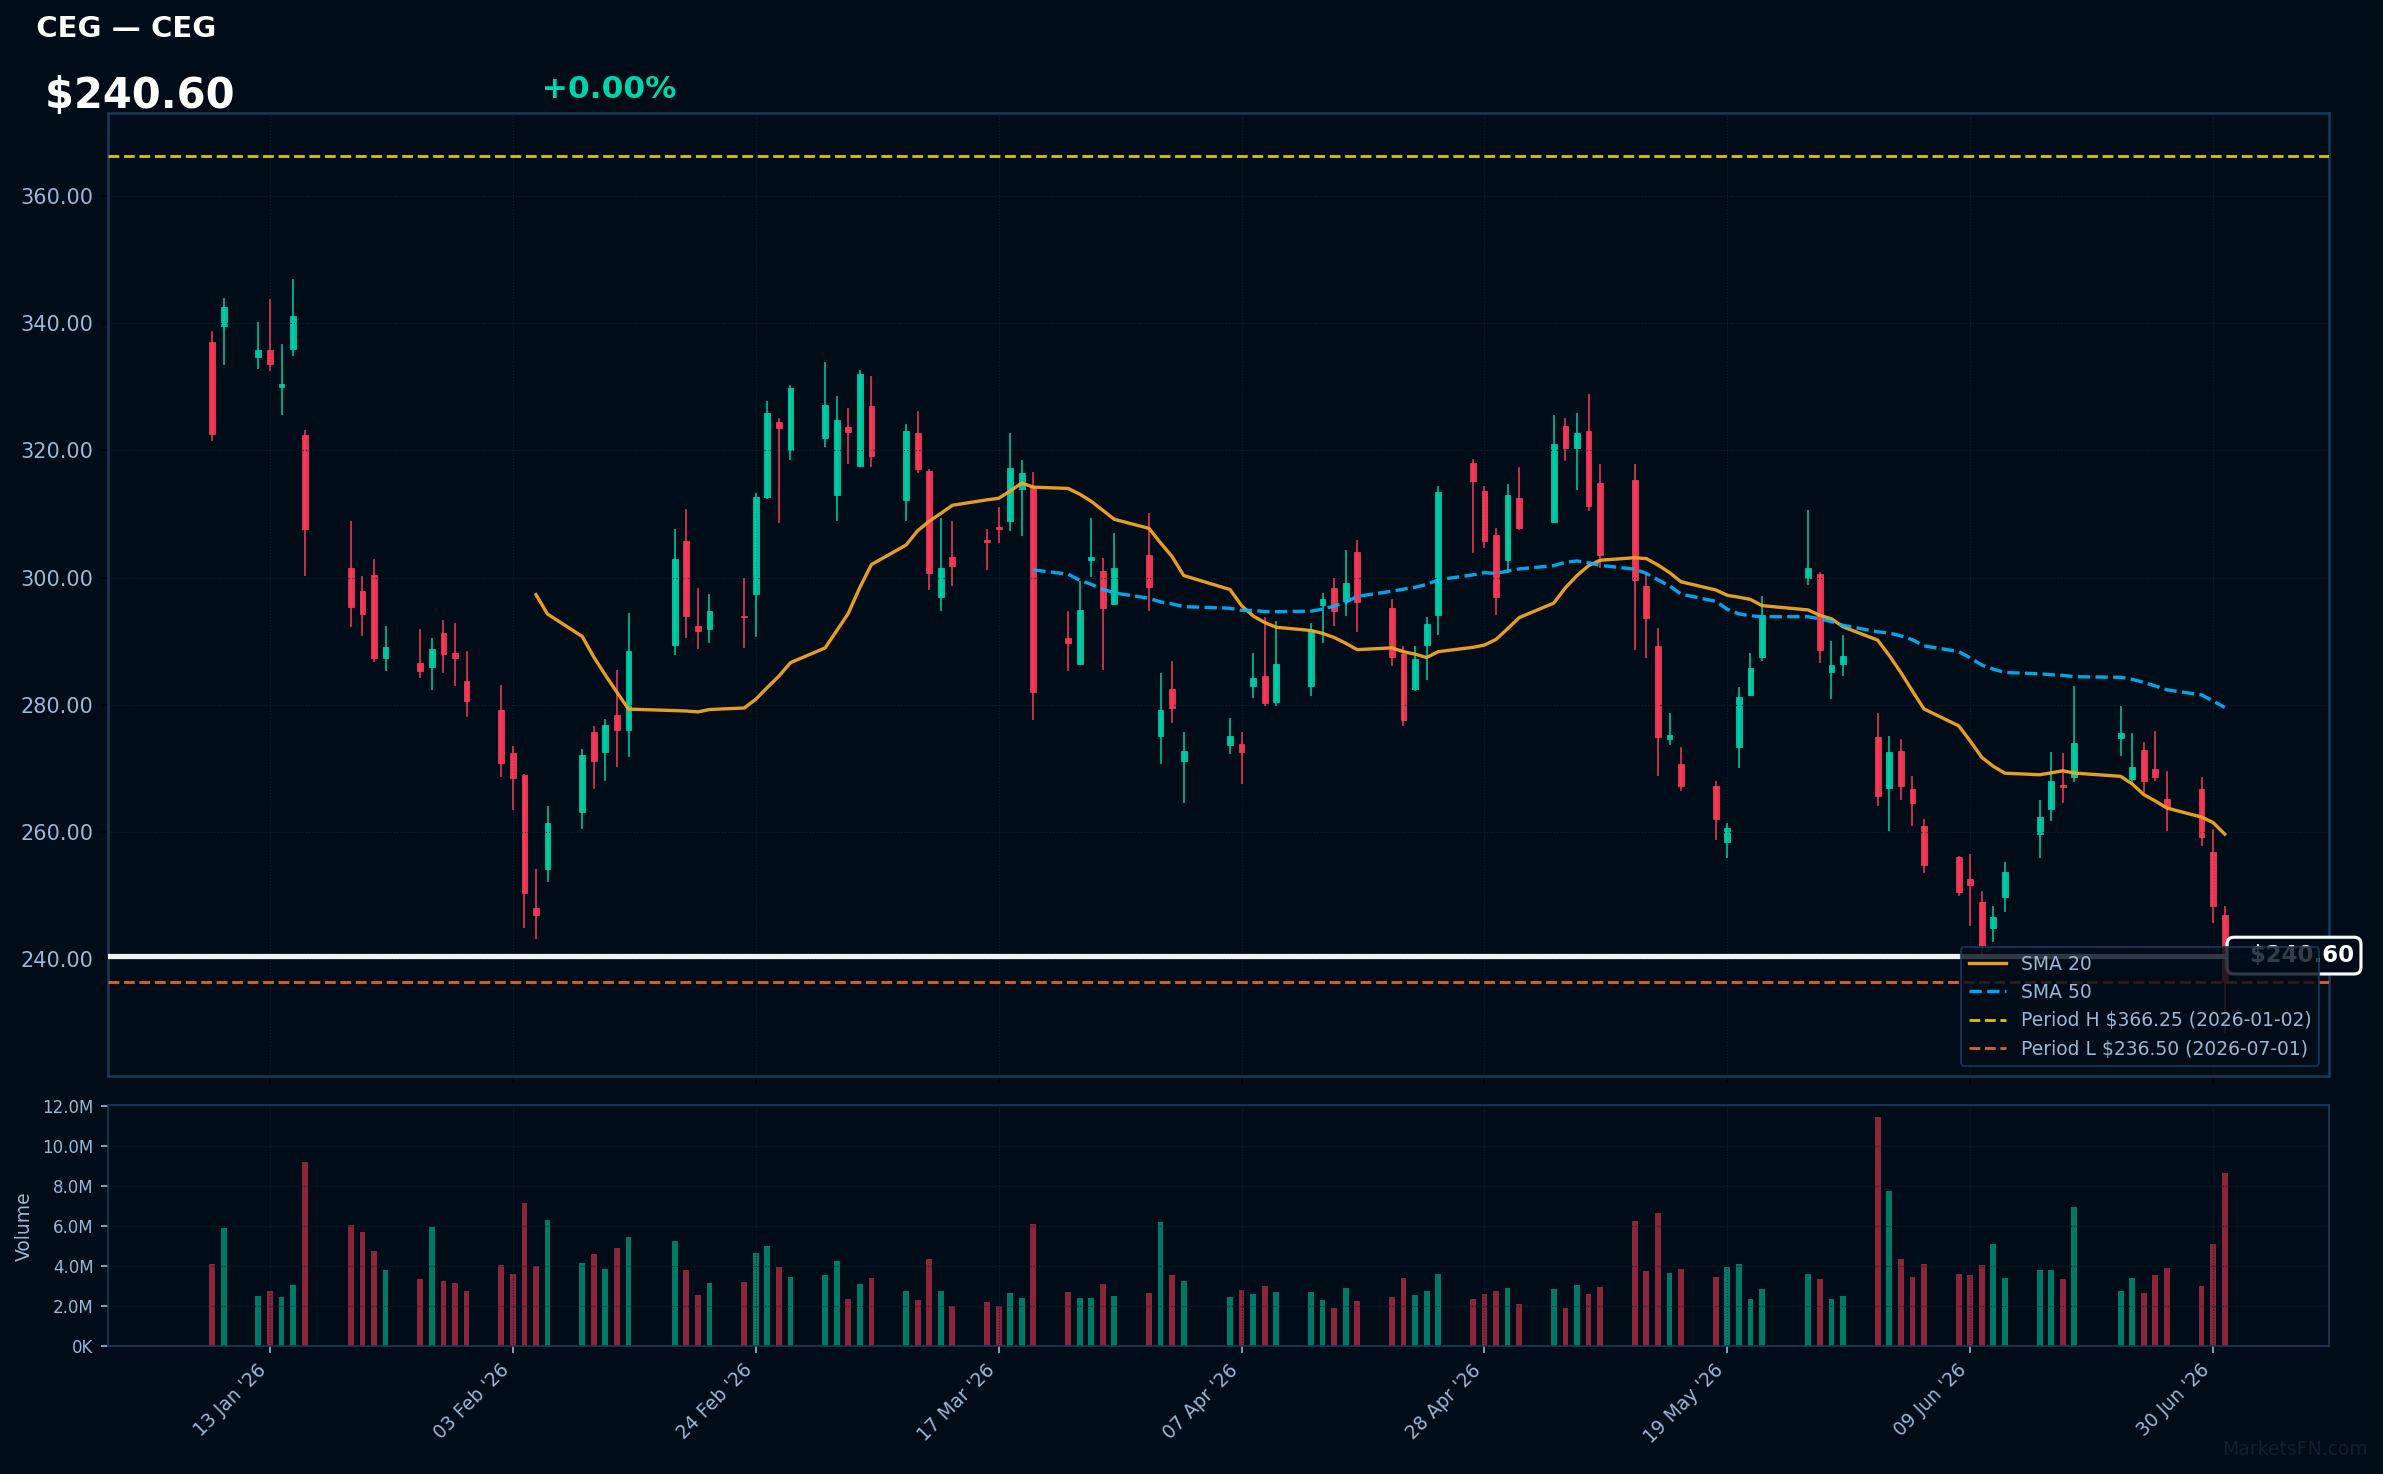
CEG | Constellation Energy Corporation | Utilities | Price Last: $236.50 | % Realized: -35.43% | RSI: 35.1 | % above MA200: -25.4% | Trend: Below MA20, MA50, MA200
Constellation Energy Corporation (CEG) is a leading clean energy provider, focusing on nuclear, solar, and hydroelectric power generation. Investors should care due to its pivotal role in the transition to renewable energy, which is increasingly prioritized by governments and consumers alike.
The current technical situation indicates a bearish trend, with an RSI(14) of 35.1 and a MA alignment of price < MA20 < MA50 < MA200, suggesting sustained downward momentum and testing major support just 0.0% above its 2026 YTD low.
Related headlines
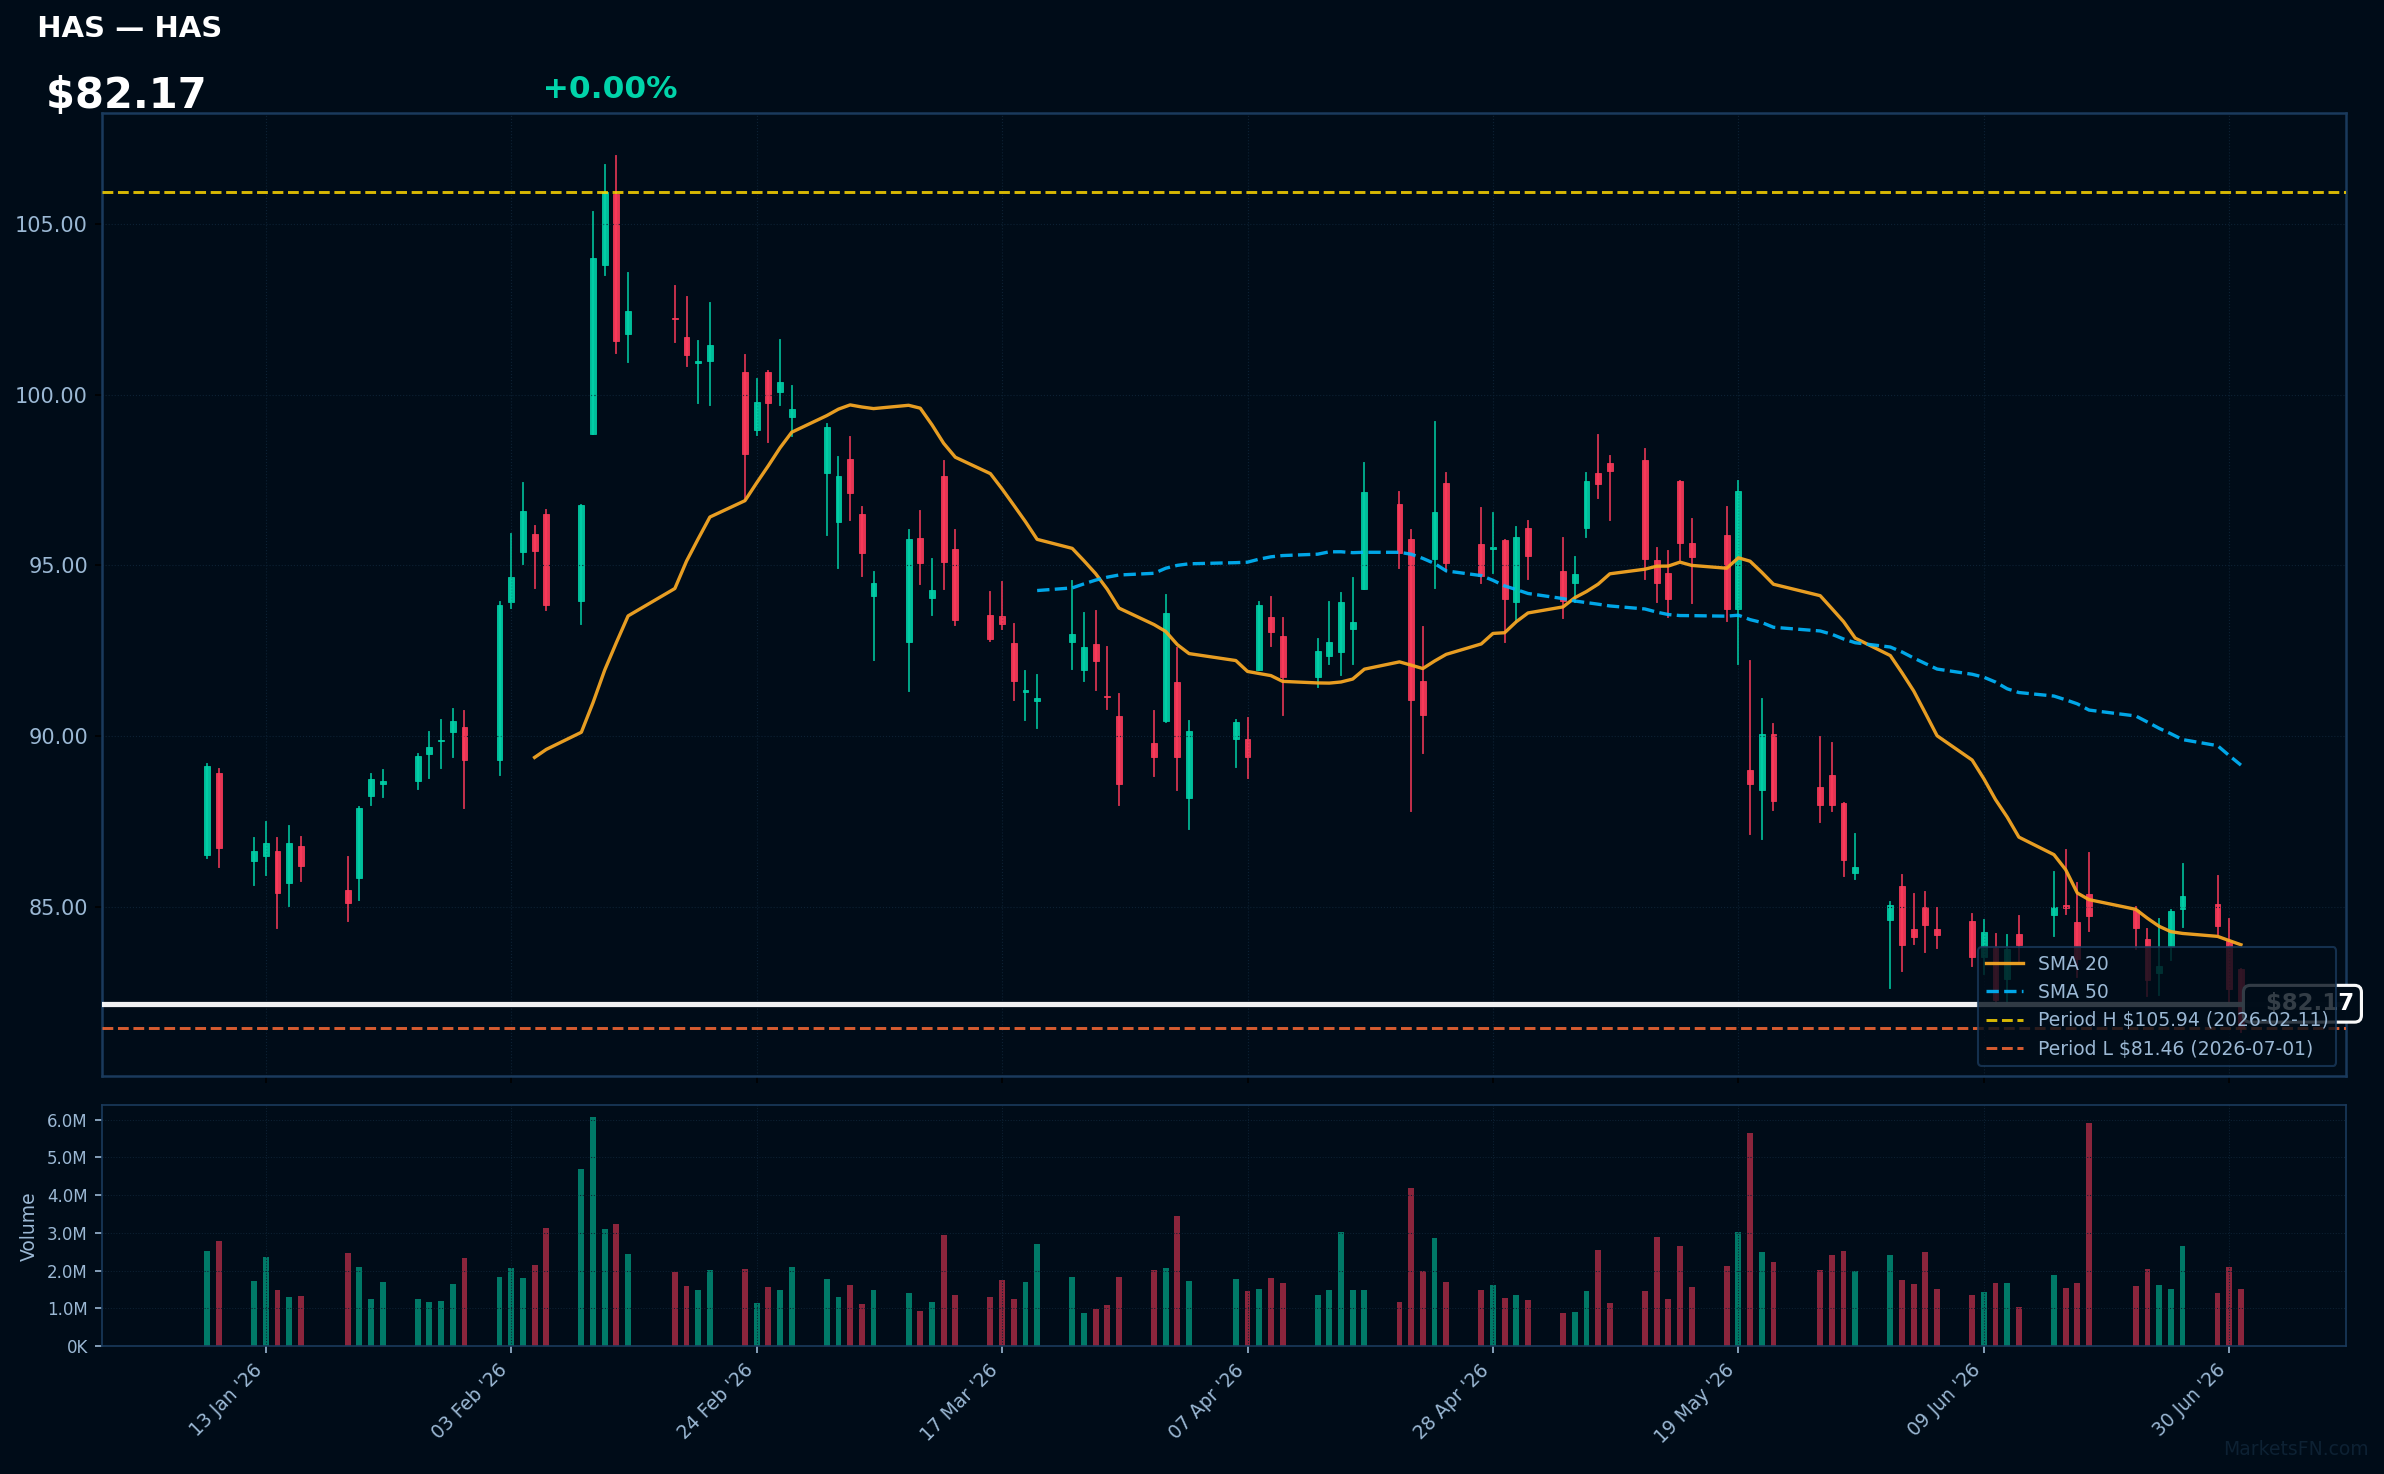
HAS | Hasbro, Inc | Consumer Cyclical | Price Last: $81.46 | % Realized: -1.82% | RSI: 39.2 | % above MA200: -5.7% | Trend: Below MA20, MA50, MA200
Hasbro, Inc. designs and manufactures toys, games, and entertainment products, including popular franchises like Transformers and Monopoly. Investors should care due to its strong brand portfolio and potential for growth in the evolving entertainment landscape.
The current technical situation shows mixed signals with an RSI(14) of 39.2 and the stock below MA20/MA50/MA200, indicating potential warning signs as it tests major support, being only 0.0% above its 2026 YTD low.
Related headlines
- Hasbro to Announce Second Quarter 2026 Earnings on July 21, 2026
- Hasbro Named to The Civic 50 for 14th Consecutive Year, Extending Unmatched Record of Corporate Citizenship Leadership
- Why Hasbros Gina Goetter sees finance and operations as one role
- Optimus Prime will take your call: Hasbro leans into AI-driven licensing
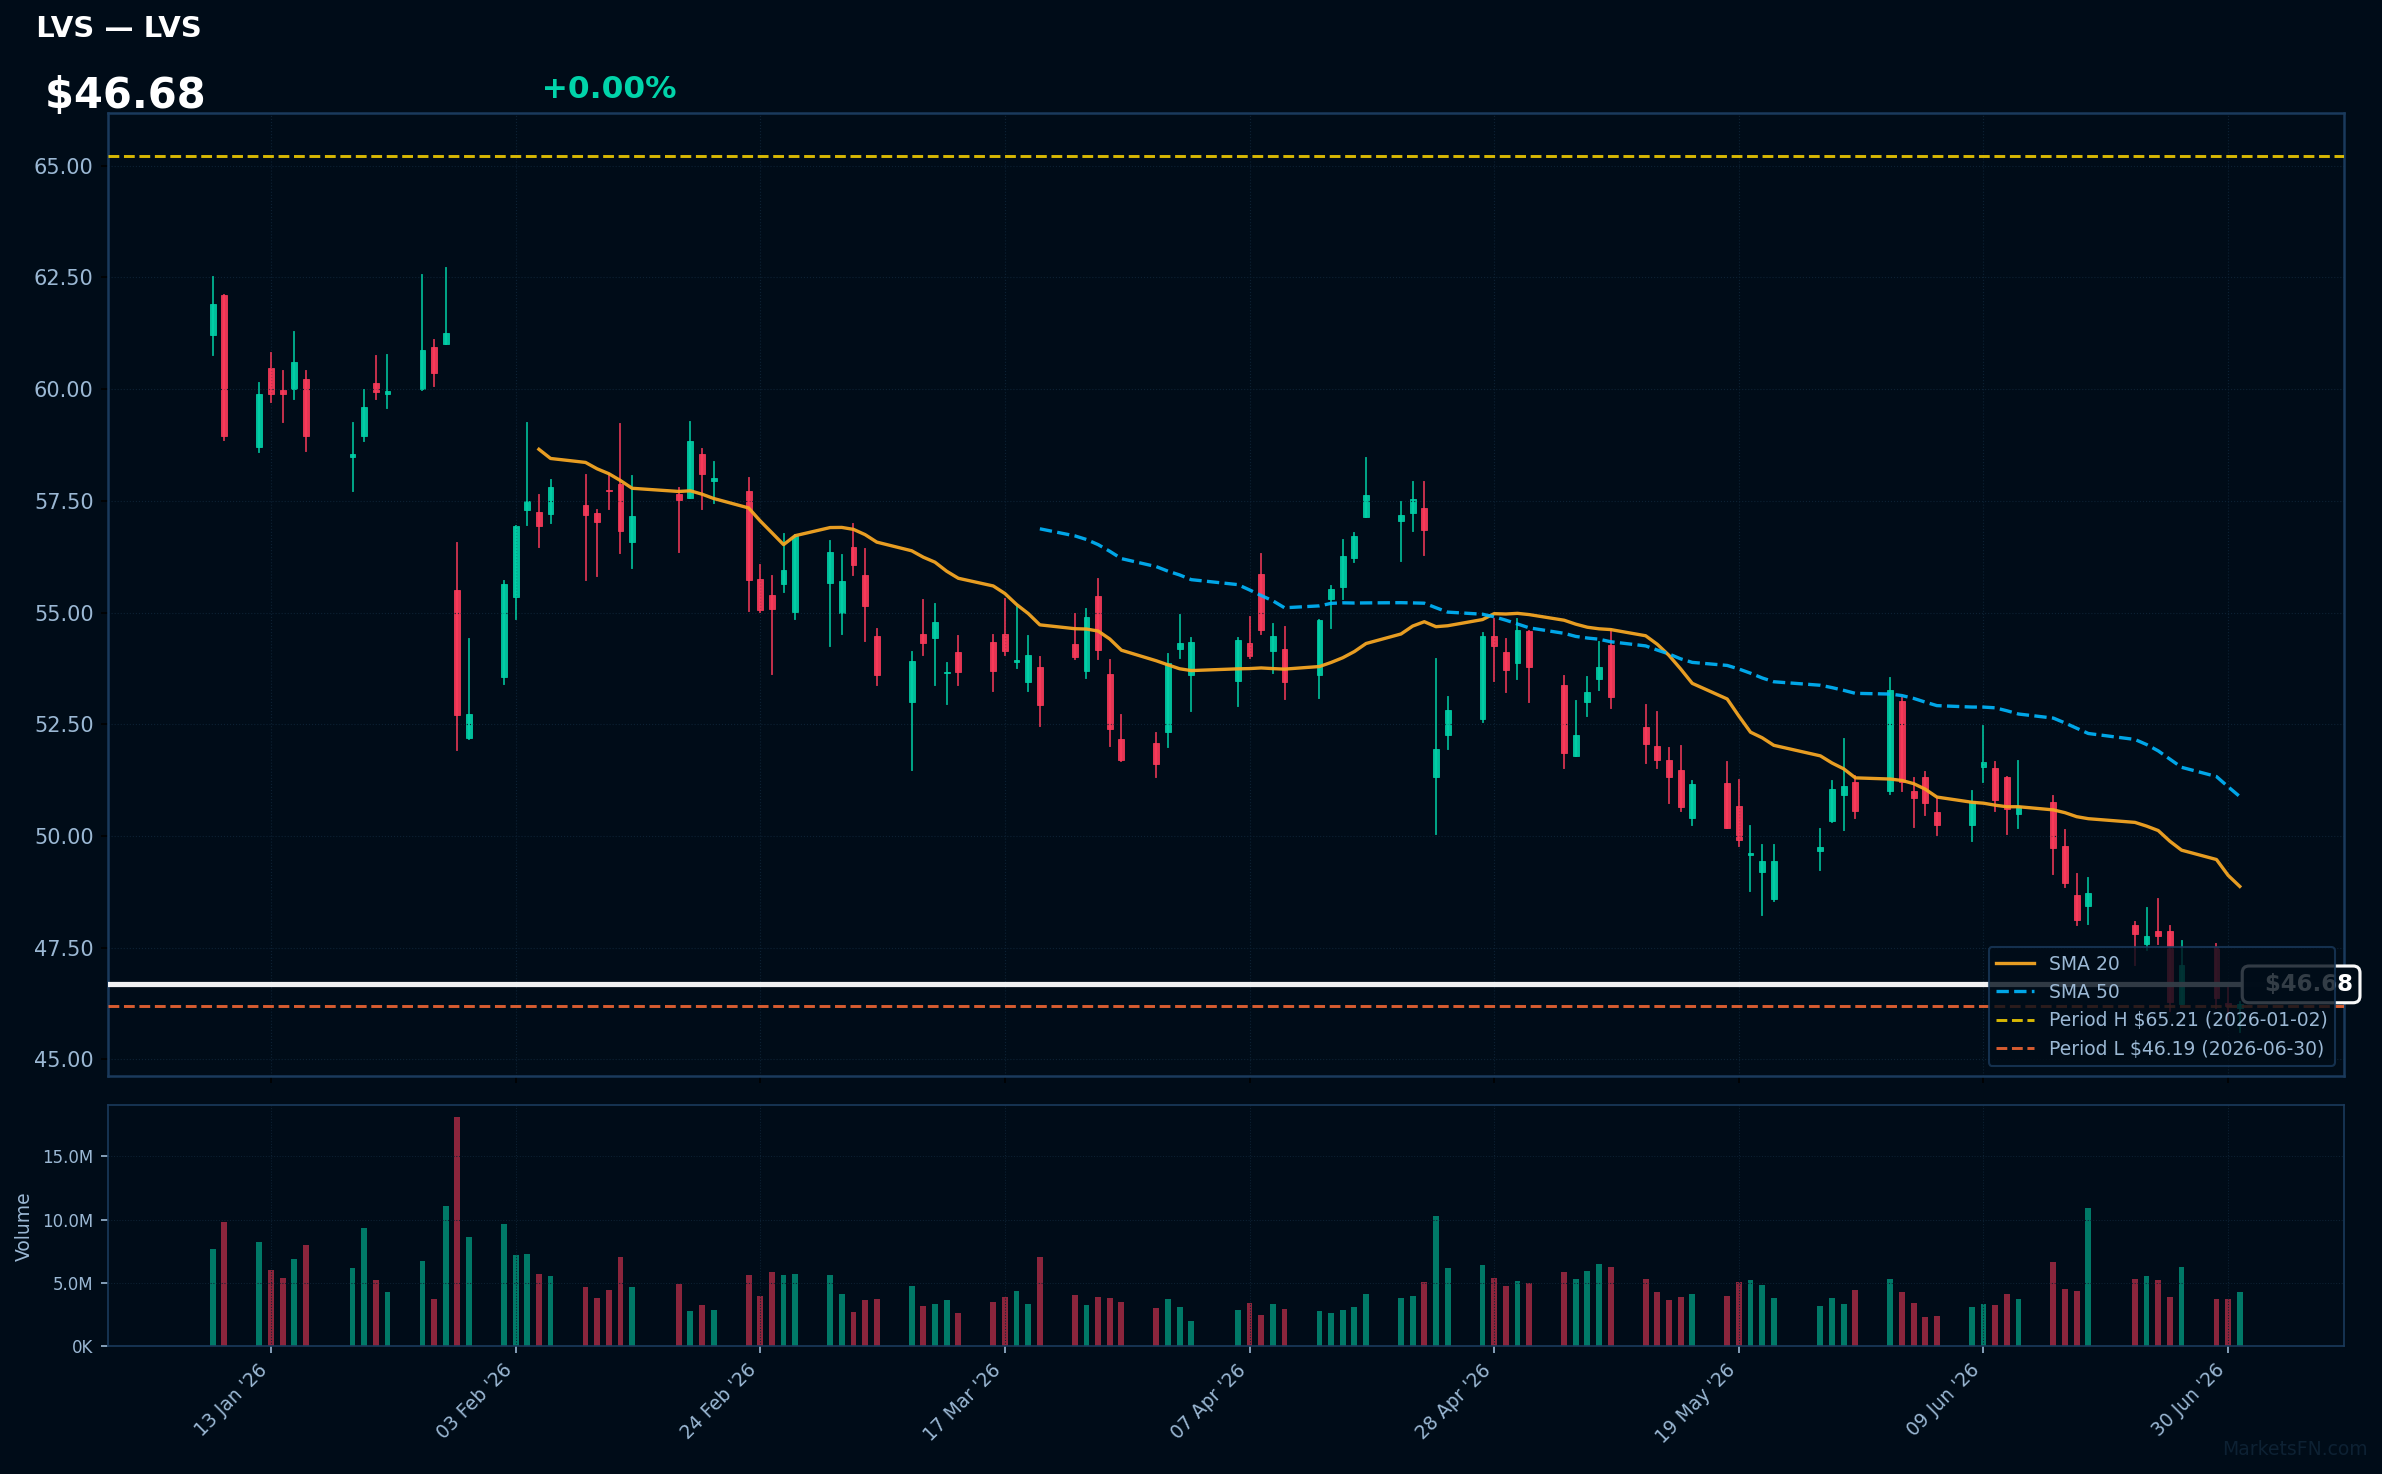
LVS | Las Vegas Sands Corp | Consumer Cyclical | Price Last: $46.25 | % Realized: -29.08% | RSI: 36.3 | % above MA200: -18.1% | Trend: Below MA20, MA50, MA200
Las Vegas Sands Corp operates integrated resorts, primarily in Asia and the U.S., focusing on gaming, hospitality, and entertainment. Investors should care due to its significant market presence and potential recovery in tourism, especially post-pandemic.
The current technical situation indicates a bearish trend, with an RSI(14) of 36.3 and a MA alignment of price < MA20 < MA50 < MA200, suggesting sustained downtrend and testing major support.
Related headlines
- Las Vegas Sands Continues its Commitment to Ending Youth Homelessness in Nevada with a $300,000 Donation to Nevada Partnership for Homeless Youth
- Las Vegas Sands Donates $150,000 to The LGBTQ+ Center of Las Vegas for a Workforce Development Program Supporting Housing-Insecure Youth
- MGMs $18B Bid Proves Las Vegas Sands Is Undervalued
- Las Vegas Sands Continues on the Dow Jones Best-in-Class Indices for World and North America
Market Commentary
The proximity of certain S&P 500 stocks to their 2026 year-to-date extremes indicates significant market momentum and investor sentiment. Stocks like Bank Of America Corp, GE Aerospace, Linde Plc, Progressive Corp, and Palo Alto Networks Inc are currently at 0.0% from their highs, suggesting strong performance and potential bullish trends. Conversely, Walmart Inc, AT&T, Constellation Energy Corporation, Hasbro, and Las Vegas Sands Corp are hovering just above their lows, indicating a lack of upward momentum and potential bearish sentiment in these sectors.
The stocks near their highs are primarily from sectors such as technology and financial services, which have shown resilience amid fluctuating market conditions. The strong performance of these companies may be attributed to robust earnings reports, favorable economic indicators, and increased consumer spending. In contrast, the stocks near their lows may be facing challenges such as supply chain issues, regulatory pressures, or shifts in consumer preferences, impacting their overall performance.
Investors should closely monitor upcoming earnings reports and economic data releases, as these will provide insights into the sustainability of the current trends. Additionally, any shifts in monetary policy or geopolitical developments could significantly impact market dynamics. Keeping an eye on sector rotation and investor sentiment will be crucial for making informed investment decisions in the near term.
Methodology: All 503 S&P 500 constituents screened. Close prices downloaded from 2026-01-01. Period high = highest close since Jan 1 2026; period low = lowest close since Jan 1 2026. Distance = (current price / period extreme − 1) × 100. Technical indicators computed on up to 1 year of daily OHLCV data.
Disclaimer: For informational purposes only. Not investment advice. Past performance is not indicative of future results.