S&P 500 2026 YTD Highs & Lows Radar: Microsoftoration (MSFT), Public Service Enterprise (PEG) and more
· Stocks · MarketsFN Team
S&P 500 2026 YTD Highs & Lows Radar: Microsoftoration (MSFT), Public Service Enterprise (PEG) and more
Screening all 503 S&P 500 constituents for stocks nearest to their 2026 year-to-date high and their 2026 YTD low. Data as of August 05, 2026. % Realized = total return since Jan 1 2026.
Legend: RSI > 70 = overbought · RSI < 30 = oversold · Green % Realized = positive YTD return · Red = negative.
📈 Nearest to 2026 High
Sectors represented: Financial (4), Technology (1)
| Ticker | Company | Sector | Price Last | % Realized | 2026 YTD High Date | RSI | % above MA200 | Trend |
|---|---|---|---|---|---|---|---|---|
| MSFT | Microsoft Corporation | Technology | $492.81 | +4.20% | 2026-08-04 | 78.6 | +13.7% | Above MA20, MA50, MA200 |
| BRK-B | Berkshire Hathaway Inc | Financial | $517.22 | +4.10% | 2026-08-04 | 69.0 | +5.4% | Above MA20, MA50, MA200 |
| JPM | JPMorgan Chase & Co | Financial | $357.52 | +9.84% | 2026-08-04 | 66.8 | +14.3% | Above MA20, MA50, MA200 |
| V | Visa Inc | Financial | $369.59 | +6.67% | 2026-08-04 | 66.9 | +11.8% | Above MA20, MA50, MA200 |
| BAC | Bank Of America Corp | Financial | $62.90 | +12.42% | 2026-08-04 | 67.2 | +17.0% | Above MA20, MA50, MA200 |
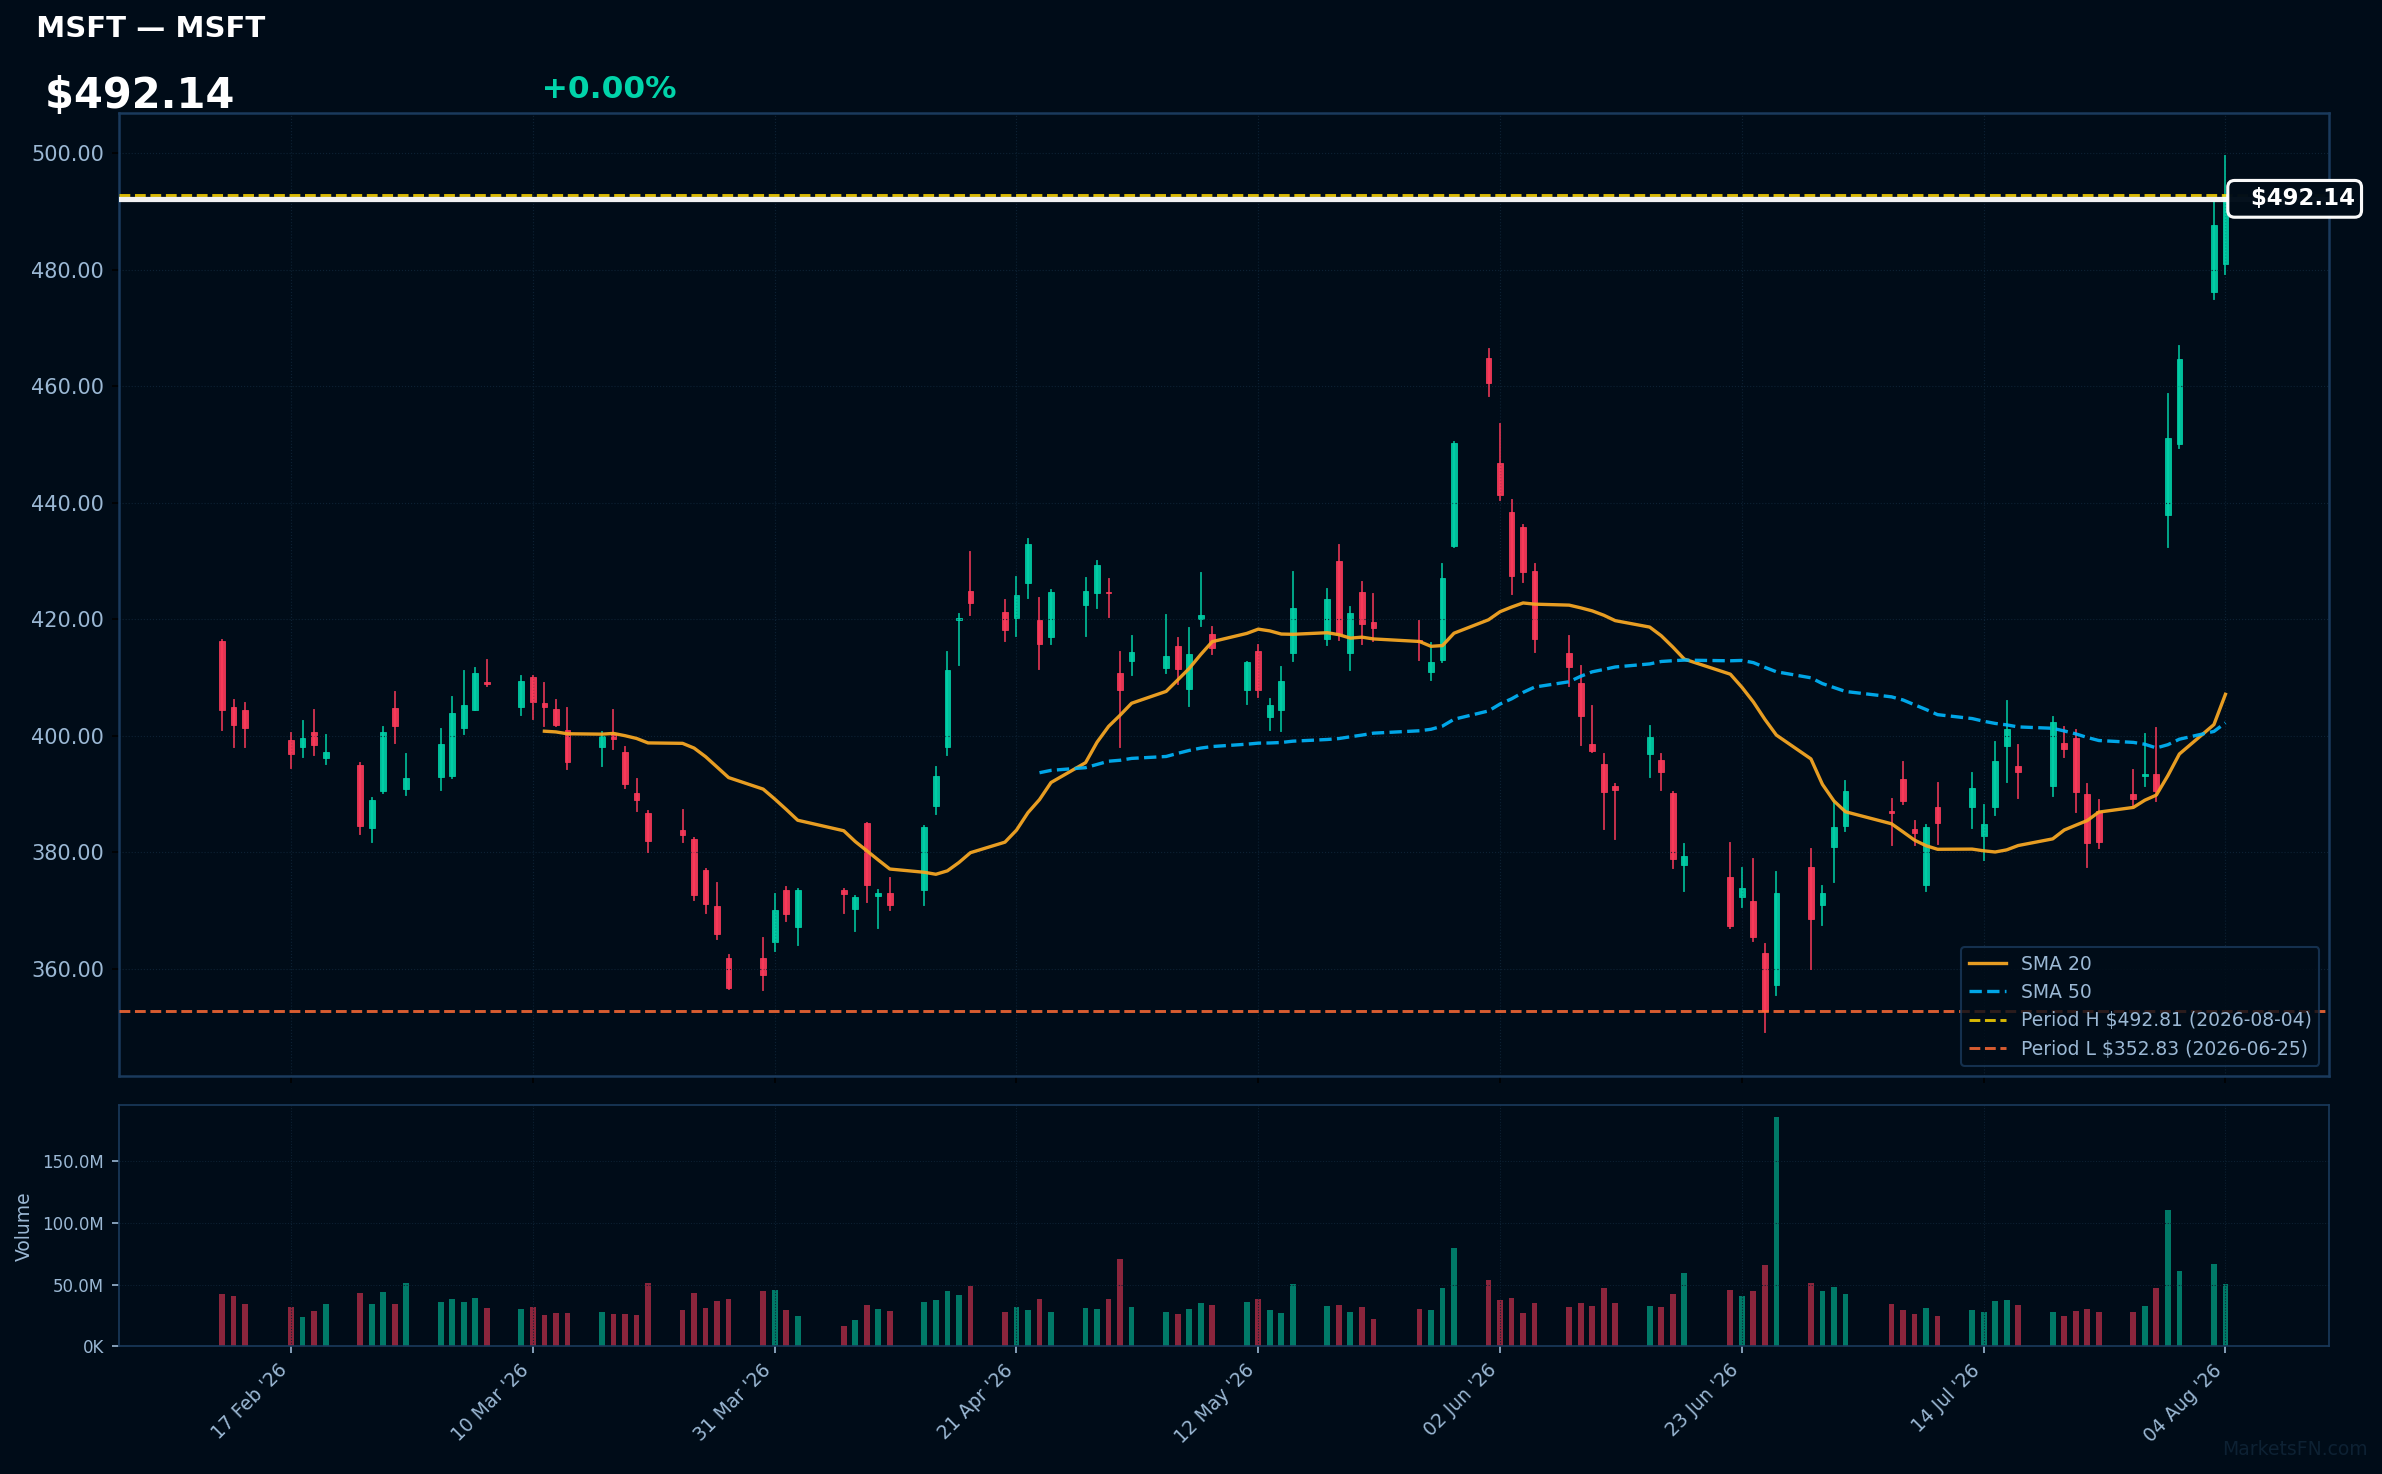
MSFT | Microsoft Corporation | Technology | Price Last: $492.81 | % Realized: +4.20% | RSI: 78.6 | % above MA200: +13.7% | Trend: Above MA20, MA50, MA200
Microsoft Corporation develops software, services, devices, and solutions, including its Azure cloud platform, Office productivity suite, and LinkedIn. Investors should care due to its strong market position and continuous innovation, driving growth in cloud computing and enterprise solutions.
Currently, MSFT shows mixed signals with an RSI(14) of 78.6, indicating overbought conditions, while the price is above MA20/MA50/MA200. It is 0.0% below its 2026 YTD high, suggesting a potential breakout.
Related headlines
- Michael Burry Exits MSFT, Closes ORCL Short Position Why He Changed His Tech Trades?
- Nasdaq, S&P 500 Futures Rise On Hormuz Deal Hopes, ADP Jobs Data Eyed: Why AMD, SPCX, ASTS, MSFT, PLTR, RKLB, SLV Are In Focus
- Dow Jones AI Giant Microsoft Breaks Out After Earnings-Fueled Surge
- Amazon And Microsoft Ace Wall Streets AI Test Analyst Warns Mag Seven Now Faces A Higher Burden Of Proof
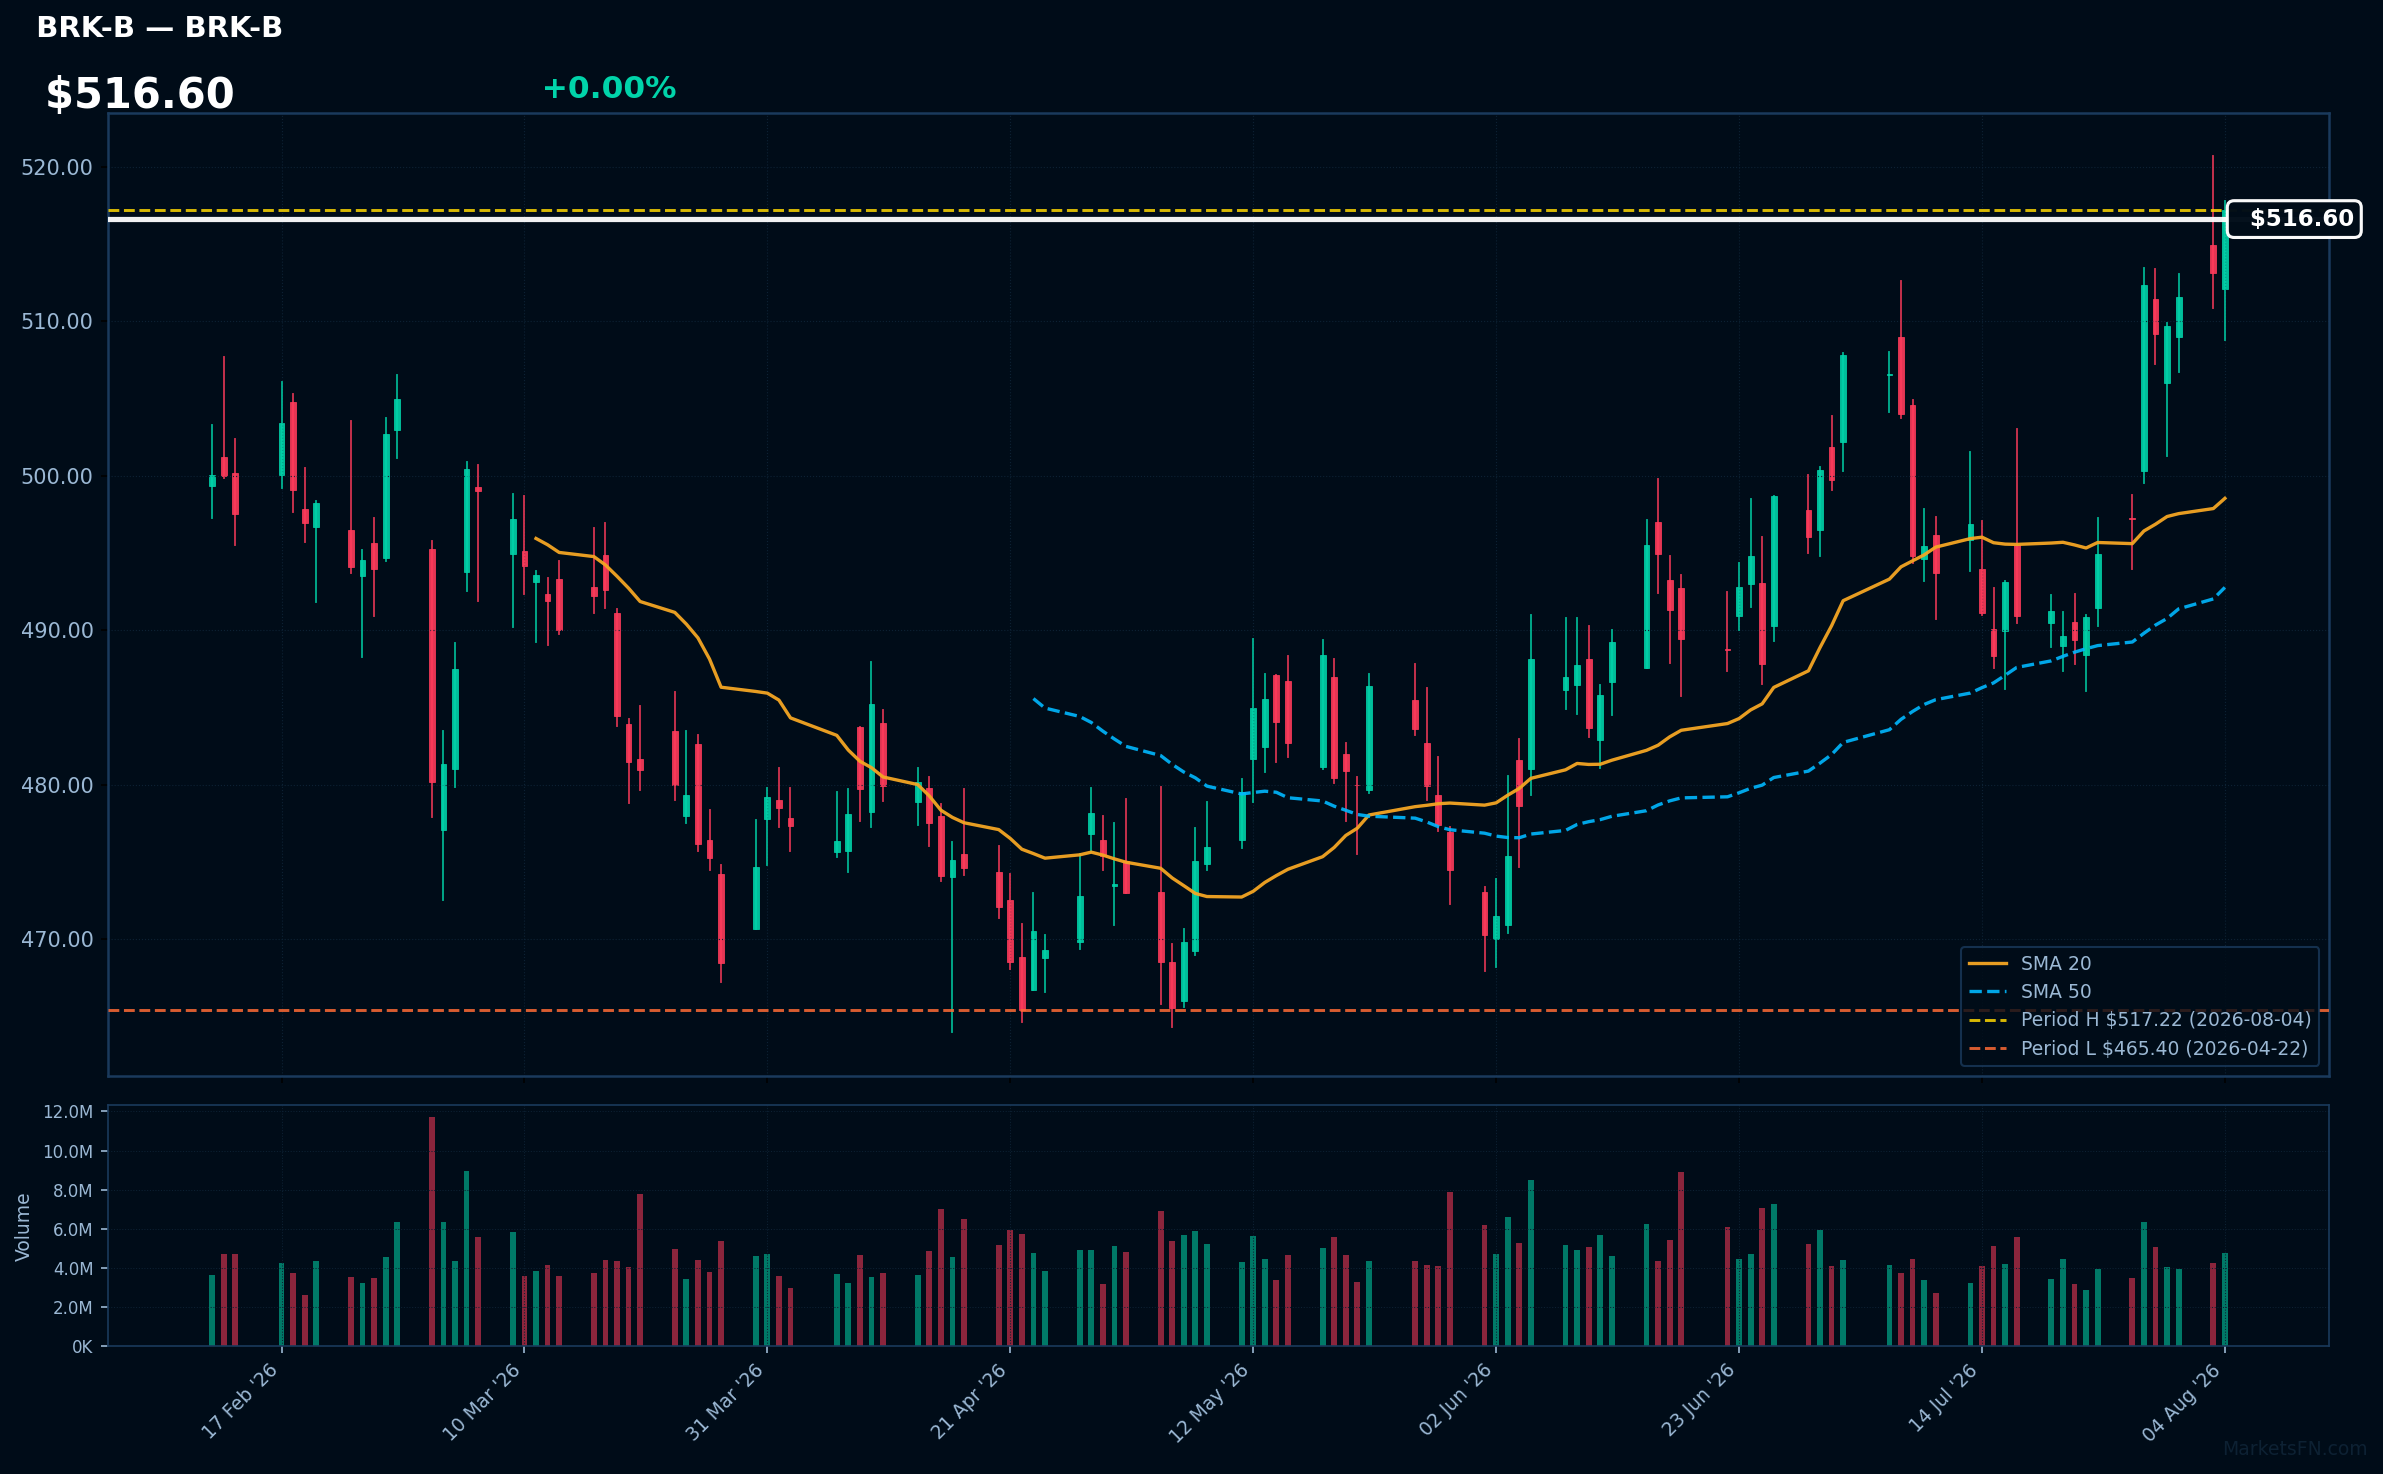
BRK-B | Berkshire Hathaway Inc | Financial | Price Last: $517.22 | % Realized: +4.10% | RSI: 69.0 | % above MA200: +5.4% | Trend: Above MA20, MA50, MA200
Berkshire Hathaway Inc. is a diversified holding company with significant investments in insurance, utilities, and consumer goods. Investors should care due to its strong management and ability to generate consistent returns across various sectors, making it a stable choice in volatile markets.
The current technical situation shows bullish momentum, with an RSI(14) of 69.0 and a bullish MA alignment: price > MA20 > MA50 > MA200. The stock is 0.0% below its 2026 YTD high, indicating a potential breakout level.
Related headlines
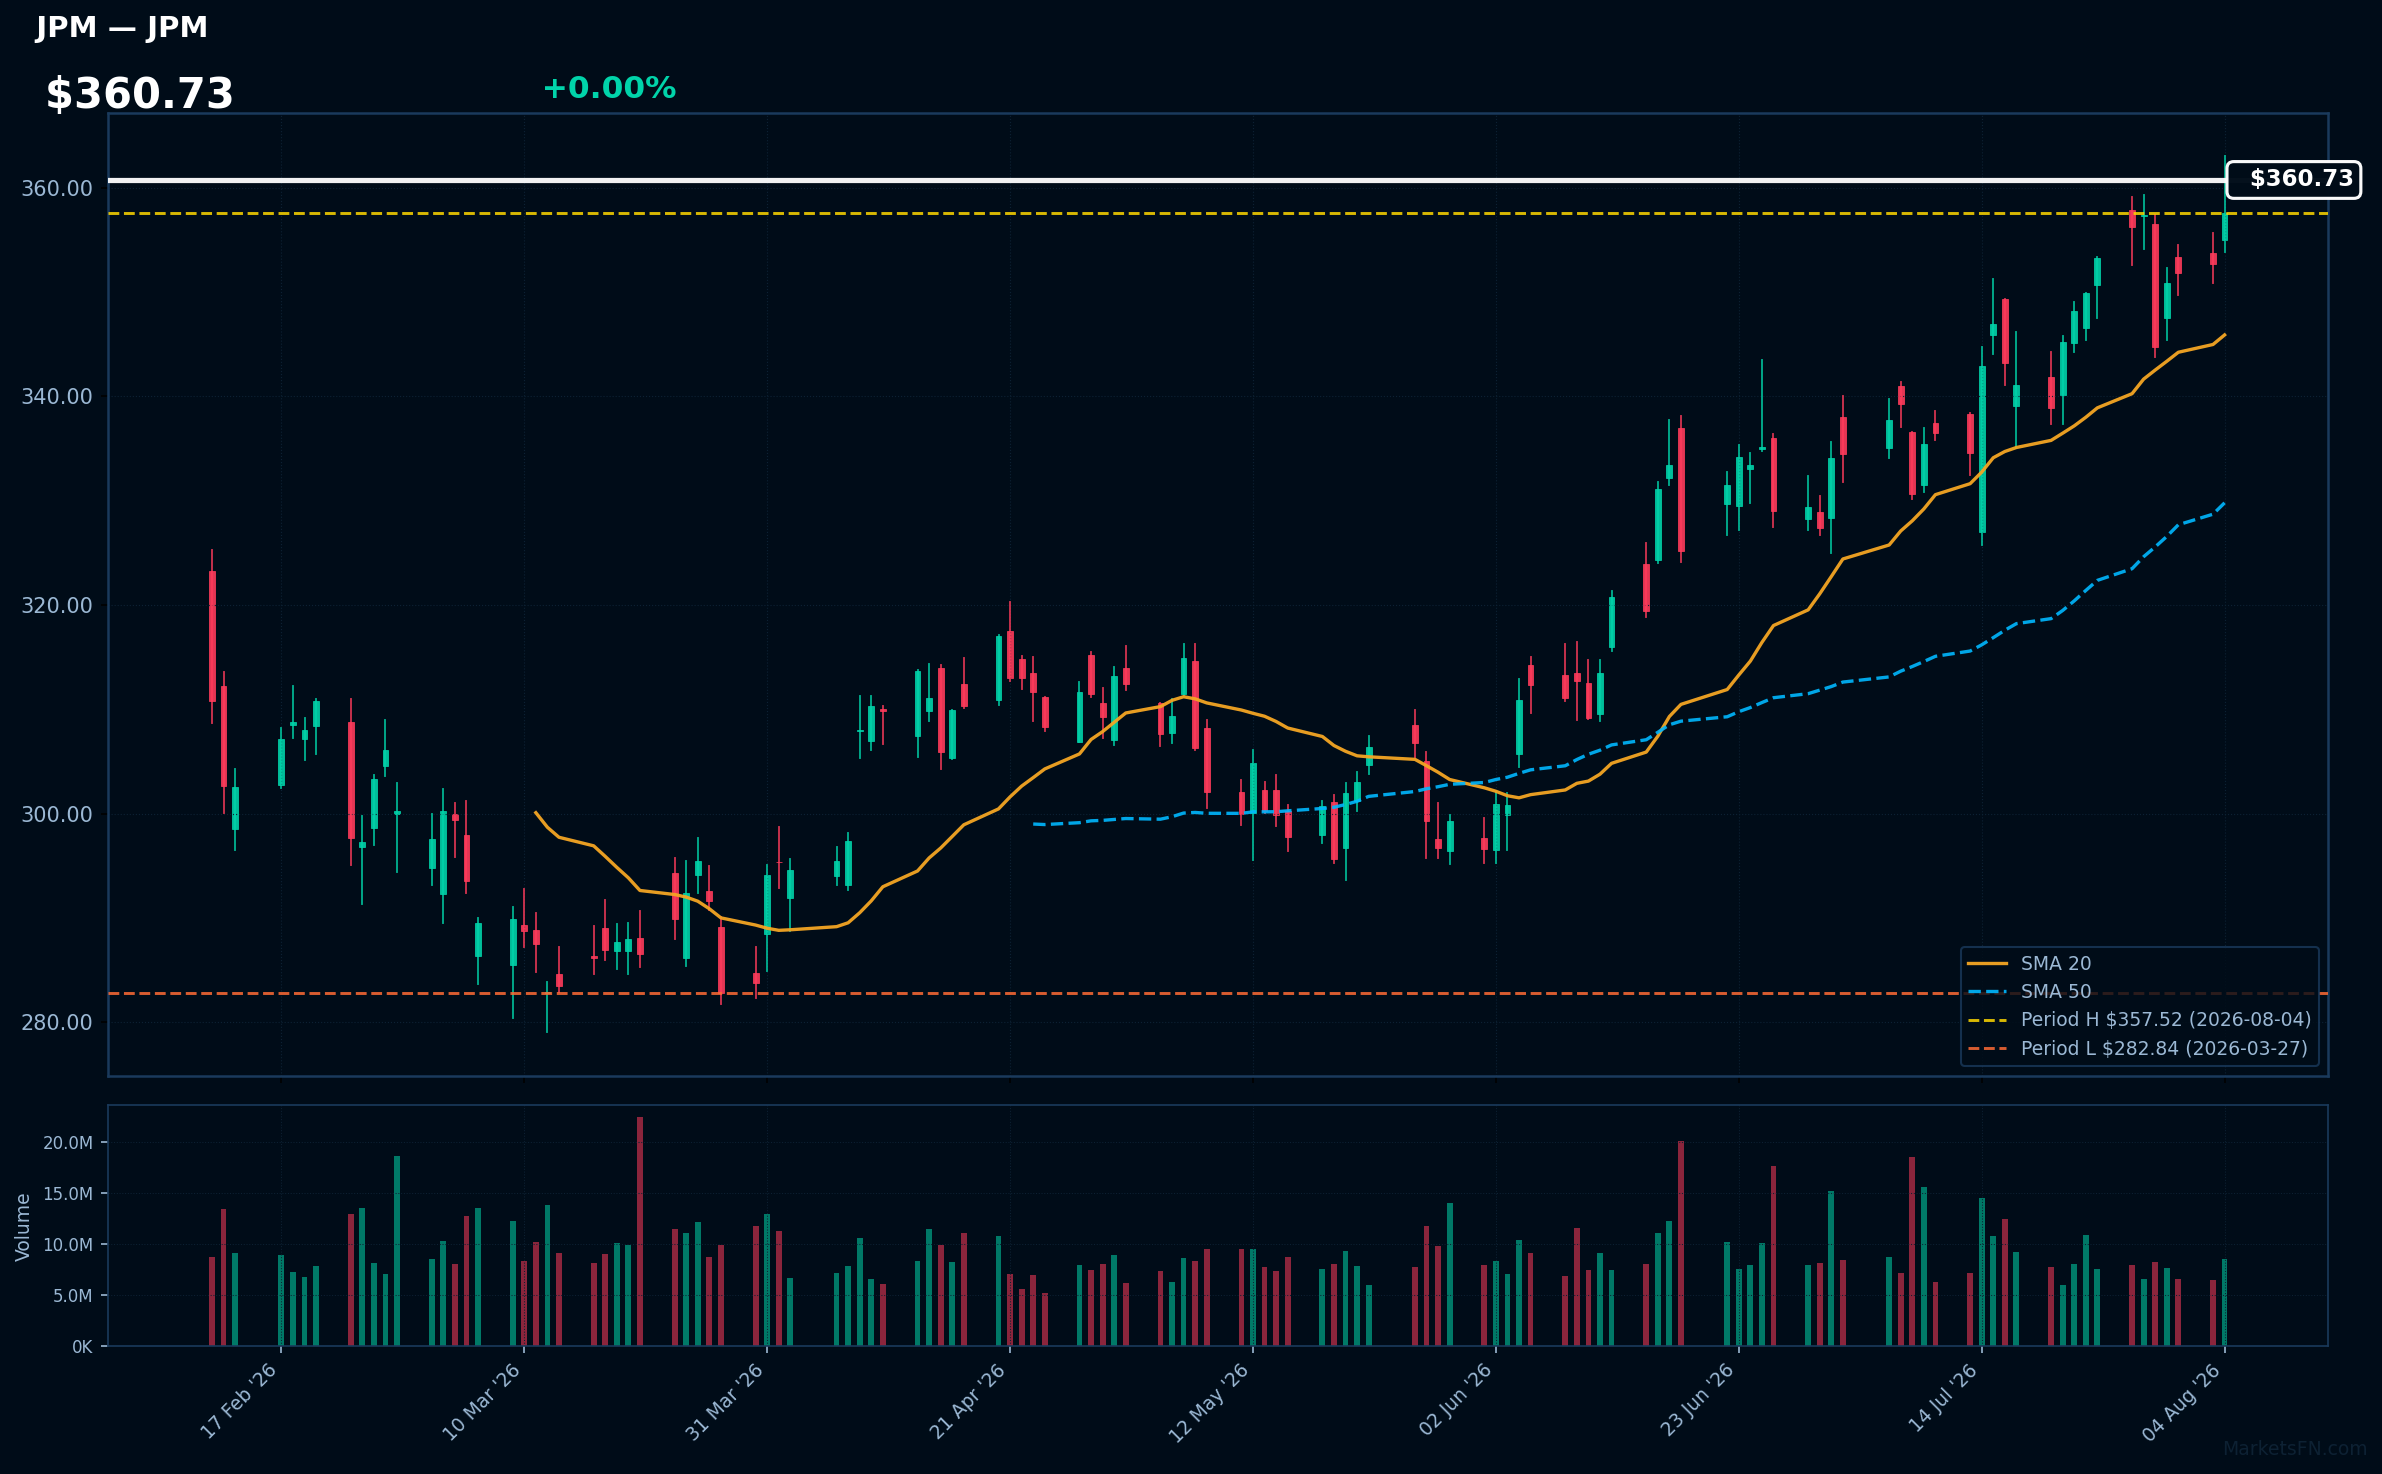
JPM | JPMorgan Chase & Co | Financial | Price Last: $357.52 | % Realized: +9.84% | RSI: 66.8 | % above MA200: +14.3% | Trend: Above MA20, MA50, MA200
JPMorgan Chase & Co is a leading global financial services firm, providing investment banking, financial services, and asset management. Investors should care due to its significant market presence and ability to navigate economic cycles, making it a key player in the financial sector.
The current technical situation indicates bullish momentum, with an RSI(14) of 66.8 and a strong MA alignment: price > MA20 > MA50 > MA200. The stock is also 0.0% below its 2026 YTD high, suggesting a potential breakout.
Related headlines
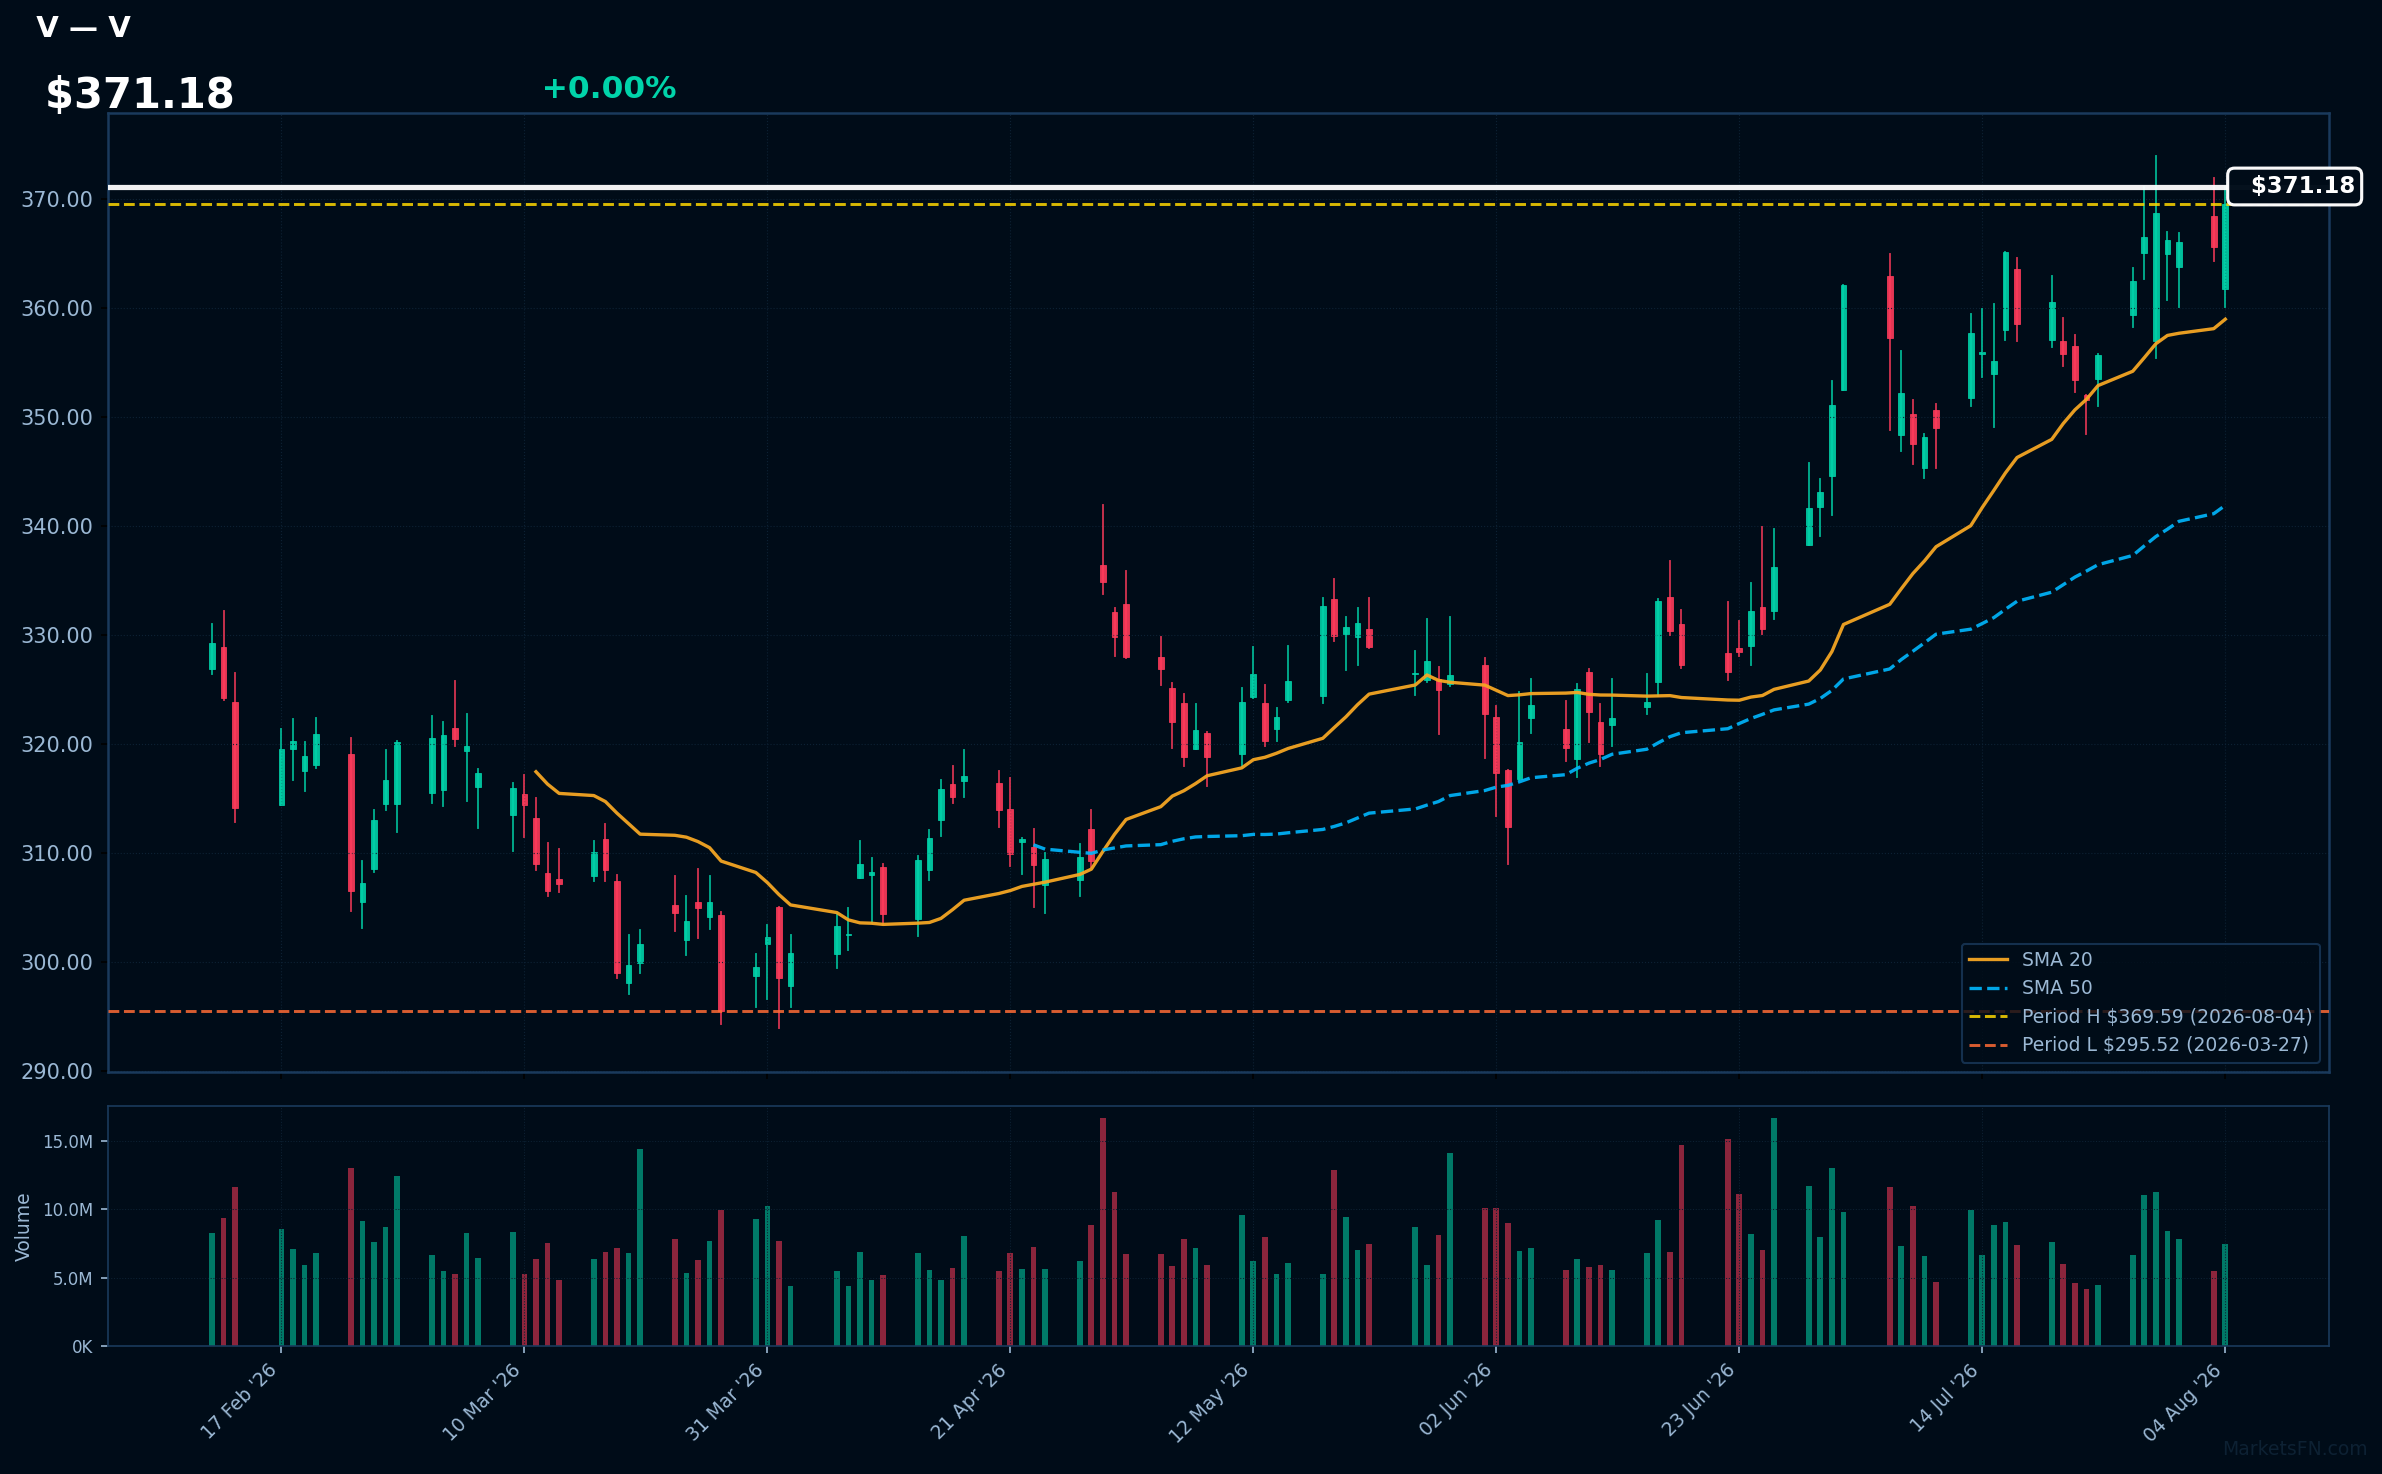
V | Visa Inc | Financial | Price Last: $369.59 | % Realized: +6.67% | RSI: 66.9 | % above MA200: +11.8% | Trend: Above MA20, MA50, MA200
Visa Inc operates a global payments technology network, facilitating electronic funds transfers and enabling secure transactions for consumers and businesses. Investors should care due to its critical role in the growing digital payment landscape, which is increasingly essential for global commerce.
The current technical situation shows bullish momentum, with an RSI(14) of 66.9 and a strong MA alignment: price > MA20 > MA50 > MA200, indicating a sustained uptrend. The stock is also 0.0% below its 2026 YTD high, near a potential breakout level.
Related headlines
- Circle shares climb after Q2 results, federal bank charter approval and higher guidance
- Every Bank Needs A Stablecoin Strategy: Sheffield
- New Visa Data Shows FIFA World Cup 2026 Drove Spending Surges of Up to 24.6% in Toronto and Vancouver
- Visa agrees to buy fraud intelligence provider BioCatch for $2.4bn
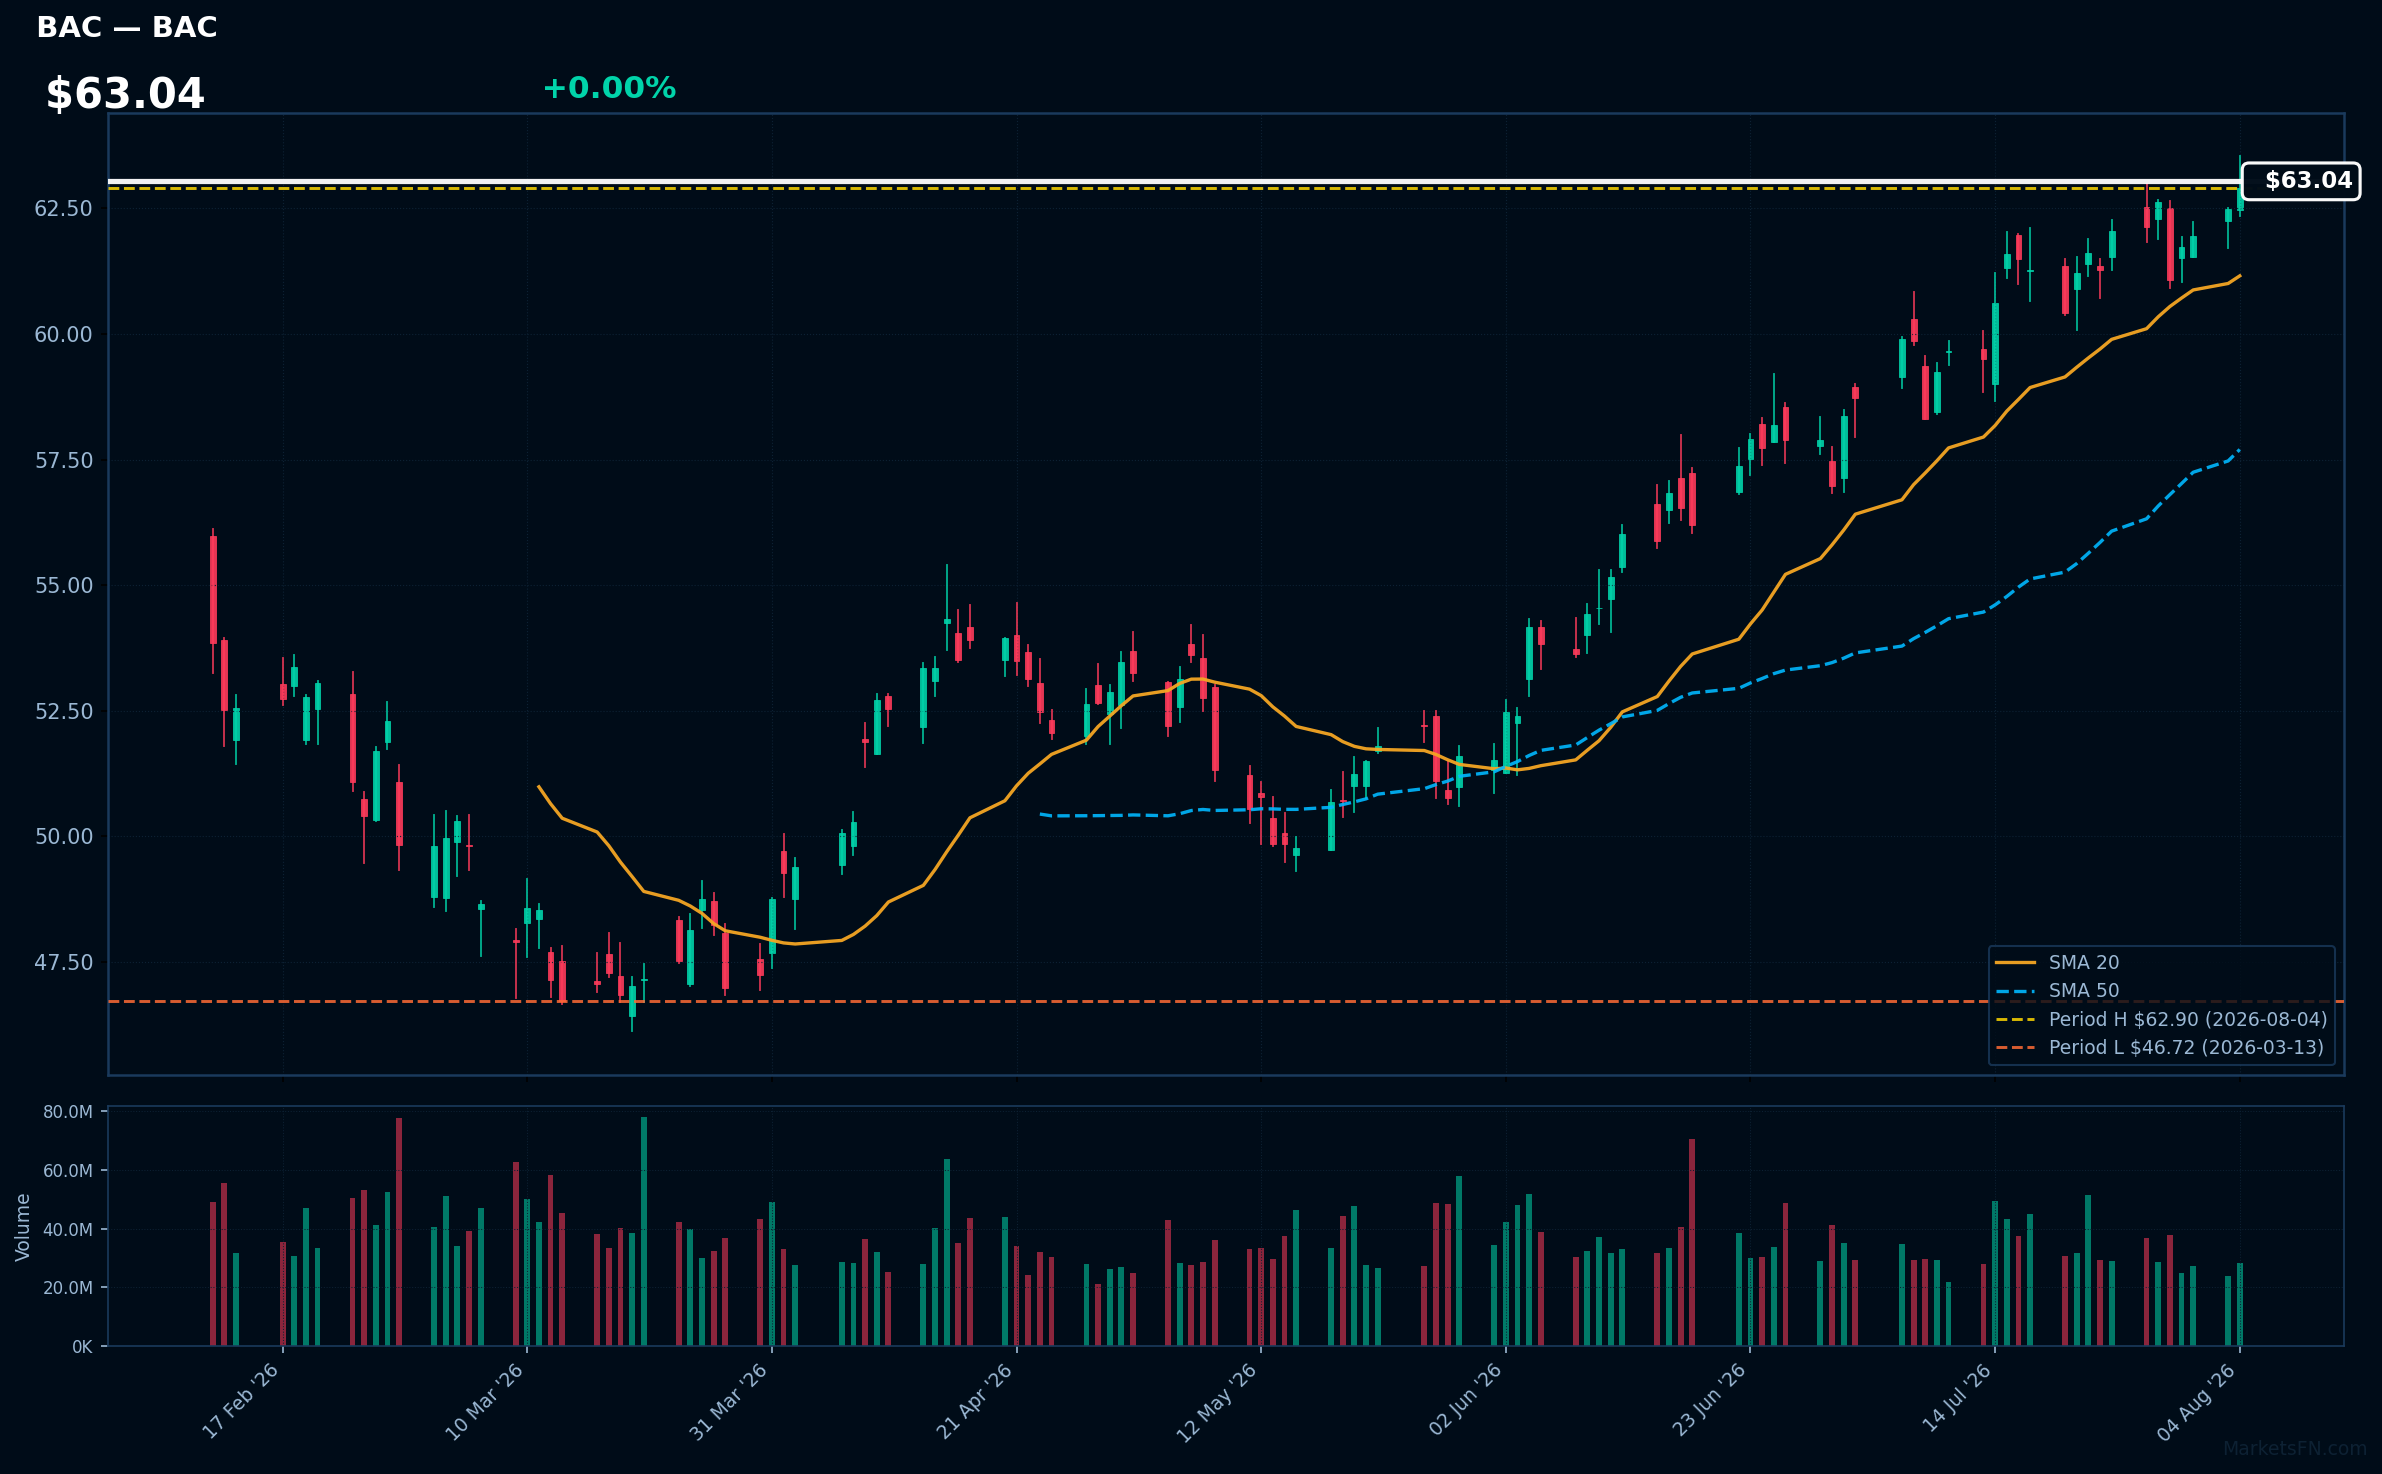
BAC | Bank Of America Corp | Financial | Price Last: $62.90 | % Realized: +12.42% | RSI: 67.2 | % above MA200: +17.0% | Trend: Above MA20, MA50, MA200
Bank of America Corp (BAC) is a leading financial institution providing banking, investment, and wealth management services. Investors should care due to its significant market presence and potential for growth, especially in a rising interest rate environment that can enhance profitability.
The current technical situation shows bullish momentum with an RSI(14) of 67.2 and a strong MA alignment: price > MA20 > MA50 > MA200. The stock is 0.0% below its 2026 YTD high, indicating a potential breakout.
Related headlines
📉 Nearest to 2026 Low
Sectors represented: Consumer Cyclical (3), Utilities (2)
| Ticker | Company | Sector | Price Last | % Realized | 2026 YTD Low Date | RSI | % above MA200 | Trend |
|---|---|---|---|---|---|---|---|---|
| PEG | Public Service Enterprise Group Inc | Utilities | $76.27 | -5.83% | 2026-08-04 | 32.2 | -5.7% | Below MA20, MA50, MA200 |
| NRG | NRG Energy Inc | Utilities | $117.04 | -29.56% | 2026-08-04 | 41.8 | -23.2% | Below MA20, MA50, MA200 |
| ROL | Rollins, Inc | Consumer Cyclical | $37.81 | -35.93% | 2026-08-04 | 26.6 | -30.7% | Below MA20, MA50, MA200 |
| APTV | Aptiv PLC | Consumer Cyclical | $47.72 | -39.16% | 2026-08-04 | 25.8 | -32.1% | Below MA20, MA50, MA200 |
| YUM | Yum Brands Inc | Consumer Cyclical | $147.68 | -1.87% | 2026-06-02 | 43.9 | -4.3% | Below MA20, MA50, MA200 |
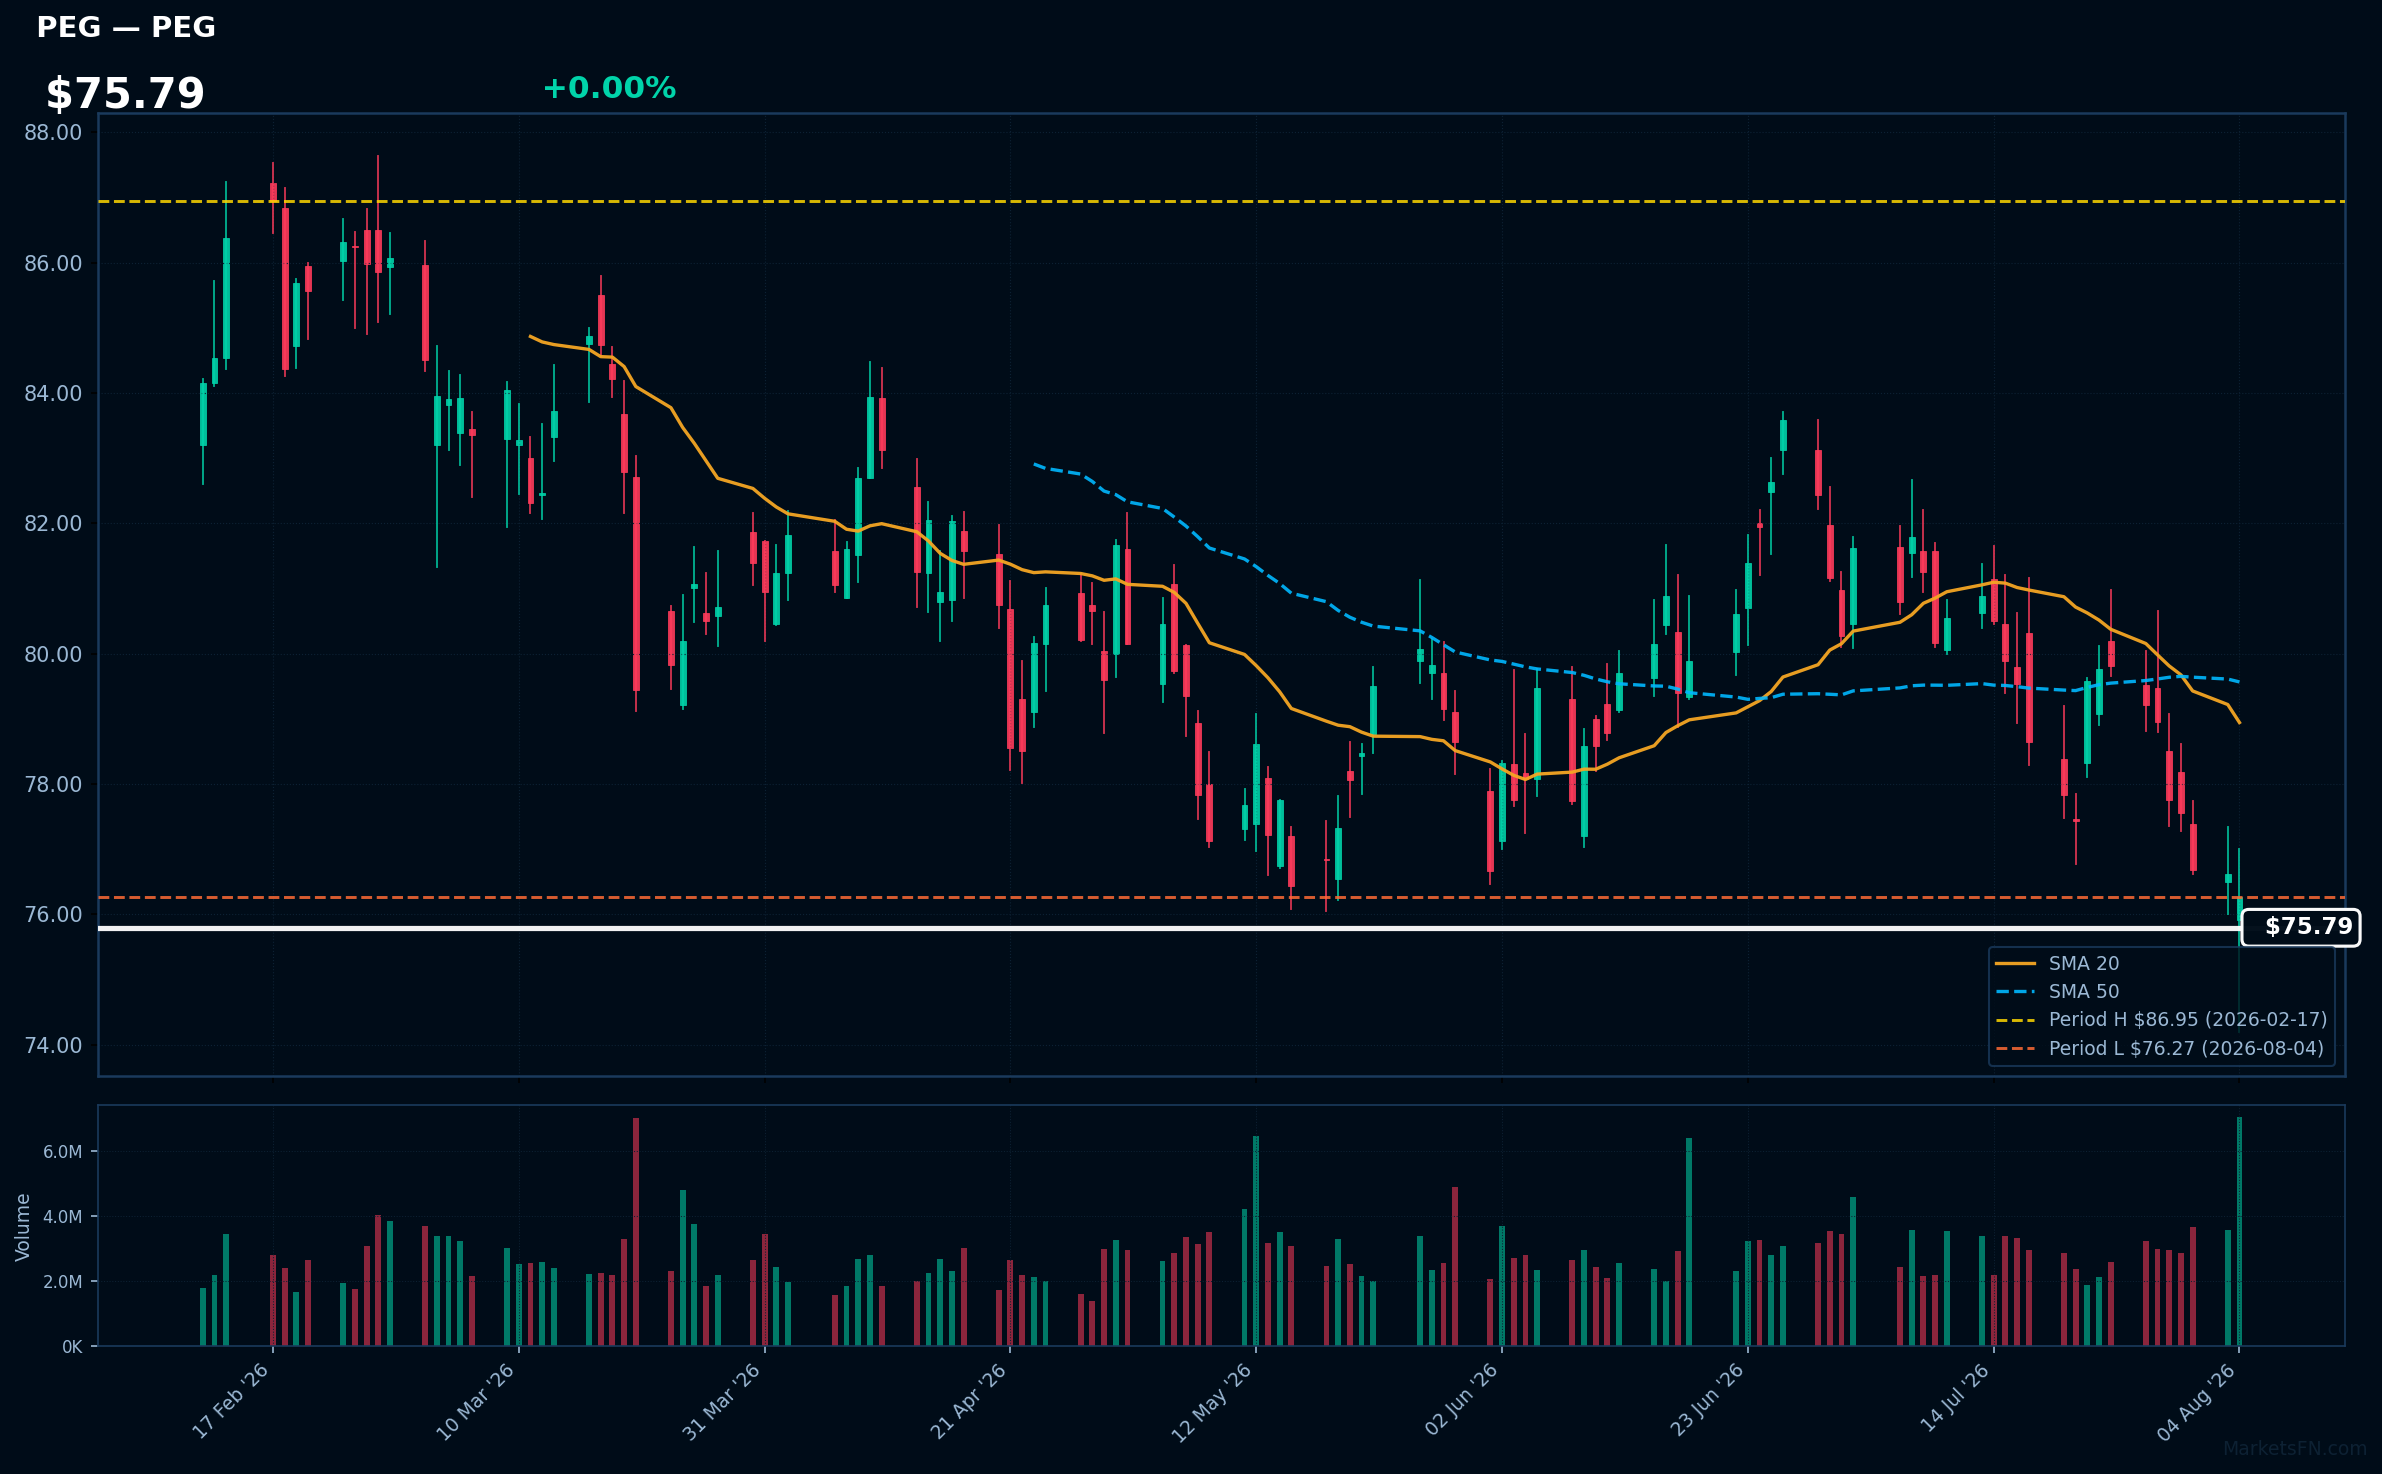
PEG | Public Service Enterprise Group Inc | Utilities | Price Last: $76.27 | % Realized: -5.83% | RSI: 32.2 | % above MA200: -5.7% | Trend: Below MA20, MA50, MA200
Public Service Enterprise Group Inc (PEG) is a utility holding company that provides electricity and natural gas services. Investors should care due to its critical role in energy infrastructure and potential impacts from regulatory changes and market dynamics affecting utility performance.
The current technical situation indicates a bearish trend, with an RSI(14) of 32.2 and a MA alignment of price < MA20 < MA50 < MA200, suggesting sustained downtrend and testing major support just 0.0% above its 2026 YTD low.
Related headlines
- Public Service Enterprise Group Inc (PEG) (Q2 2026) Earnings Call Highlights: Reaffirms ...
- Public Service Enterprise Group Incorporated Q2 2026 Earnings Call Summary
- Public Service Enterprise Group Incorporated Q1 2026 Earnings Call Summary
- Is Public Service Enterprise Stock Underperforming the Nasdaq?
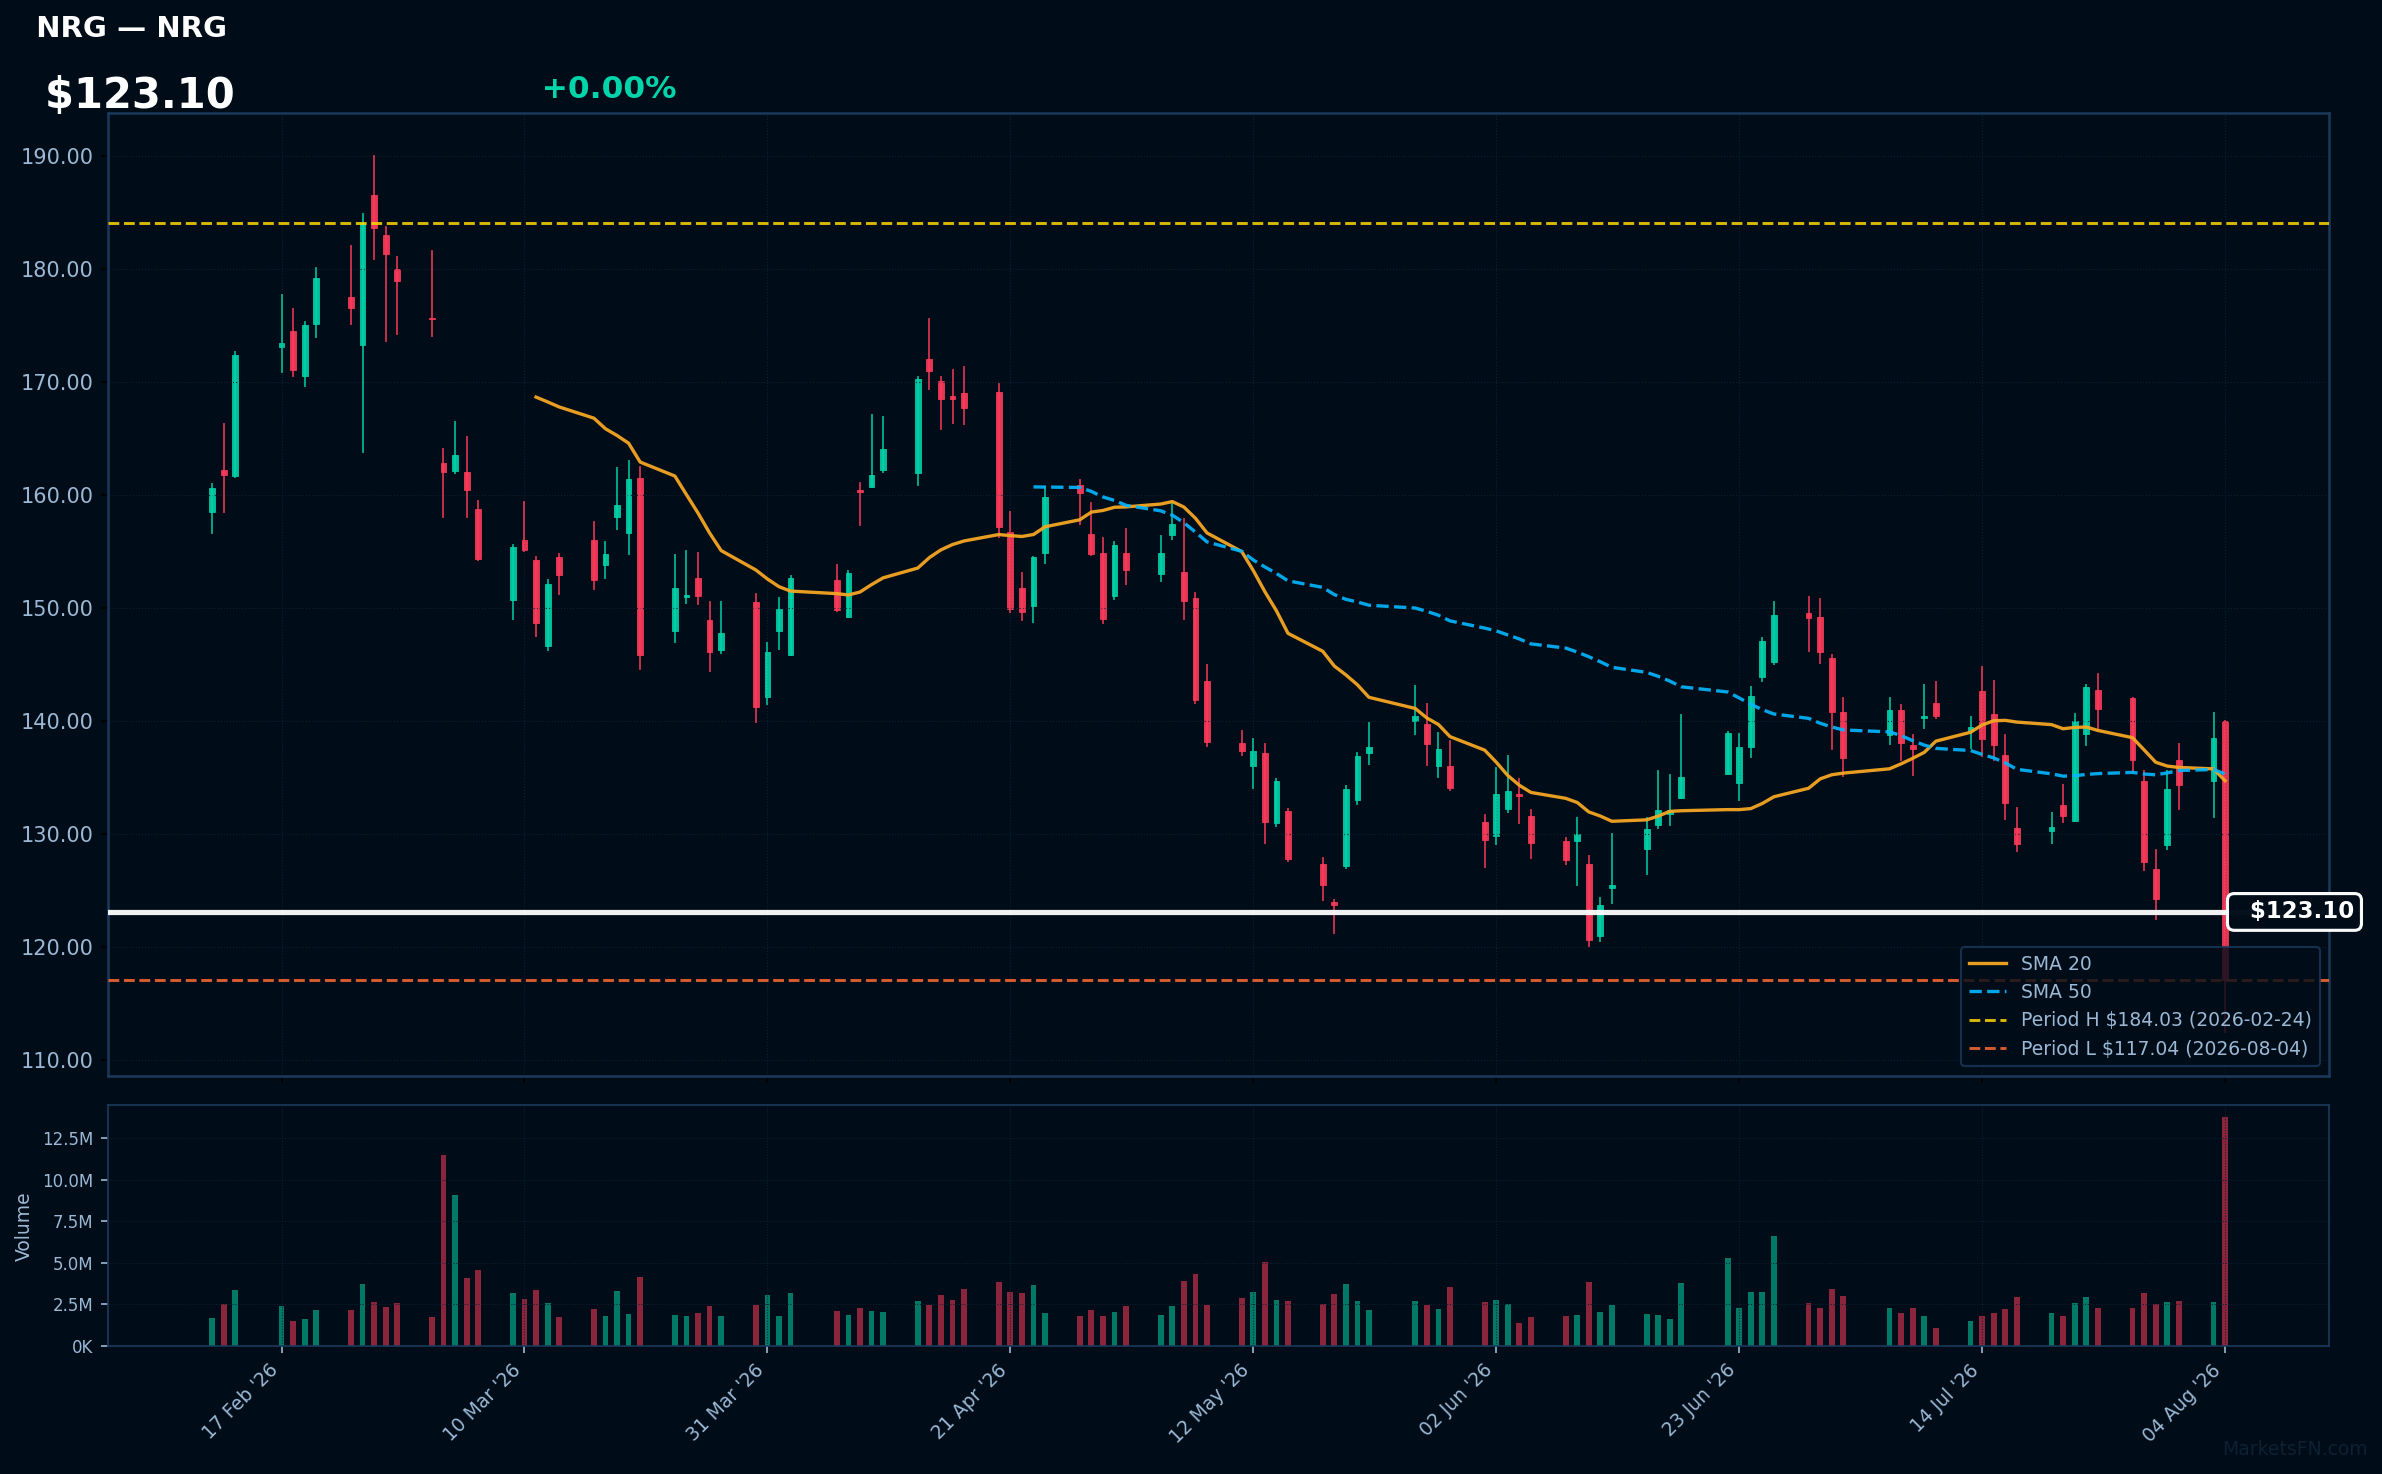
NRG | NRG Energy Inc | Utilities | Price Last: $117.04 | % Realized: -29.56% | RSI: 41.8 | % above MA200: -23.2% | Trend: Below MA20, MA50, MA200
NRG Energy Inc is a leading energy company that provides electricity and related services to residential, commercial, and industrial customers. Investors should care due to its significant role in the energy market and potential impacts from regulatory changes and energy demand fluctuations.
The current technical situation indicates a bearish trend with an RSI(14) of 41.8 and a MA alignment of price < MA20 < MA50 < MA200, suggesting sustained downtrend and testing major support, as the stock is only 0.0% above its 2026 YTD low.
Related headlines
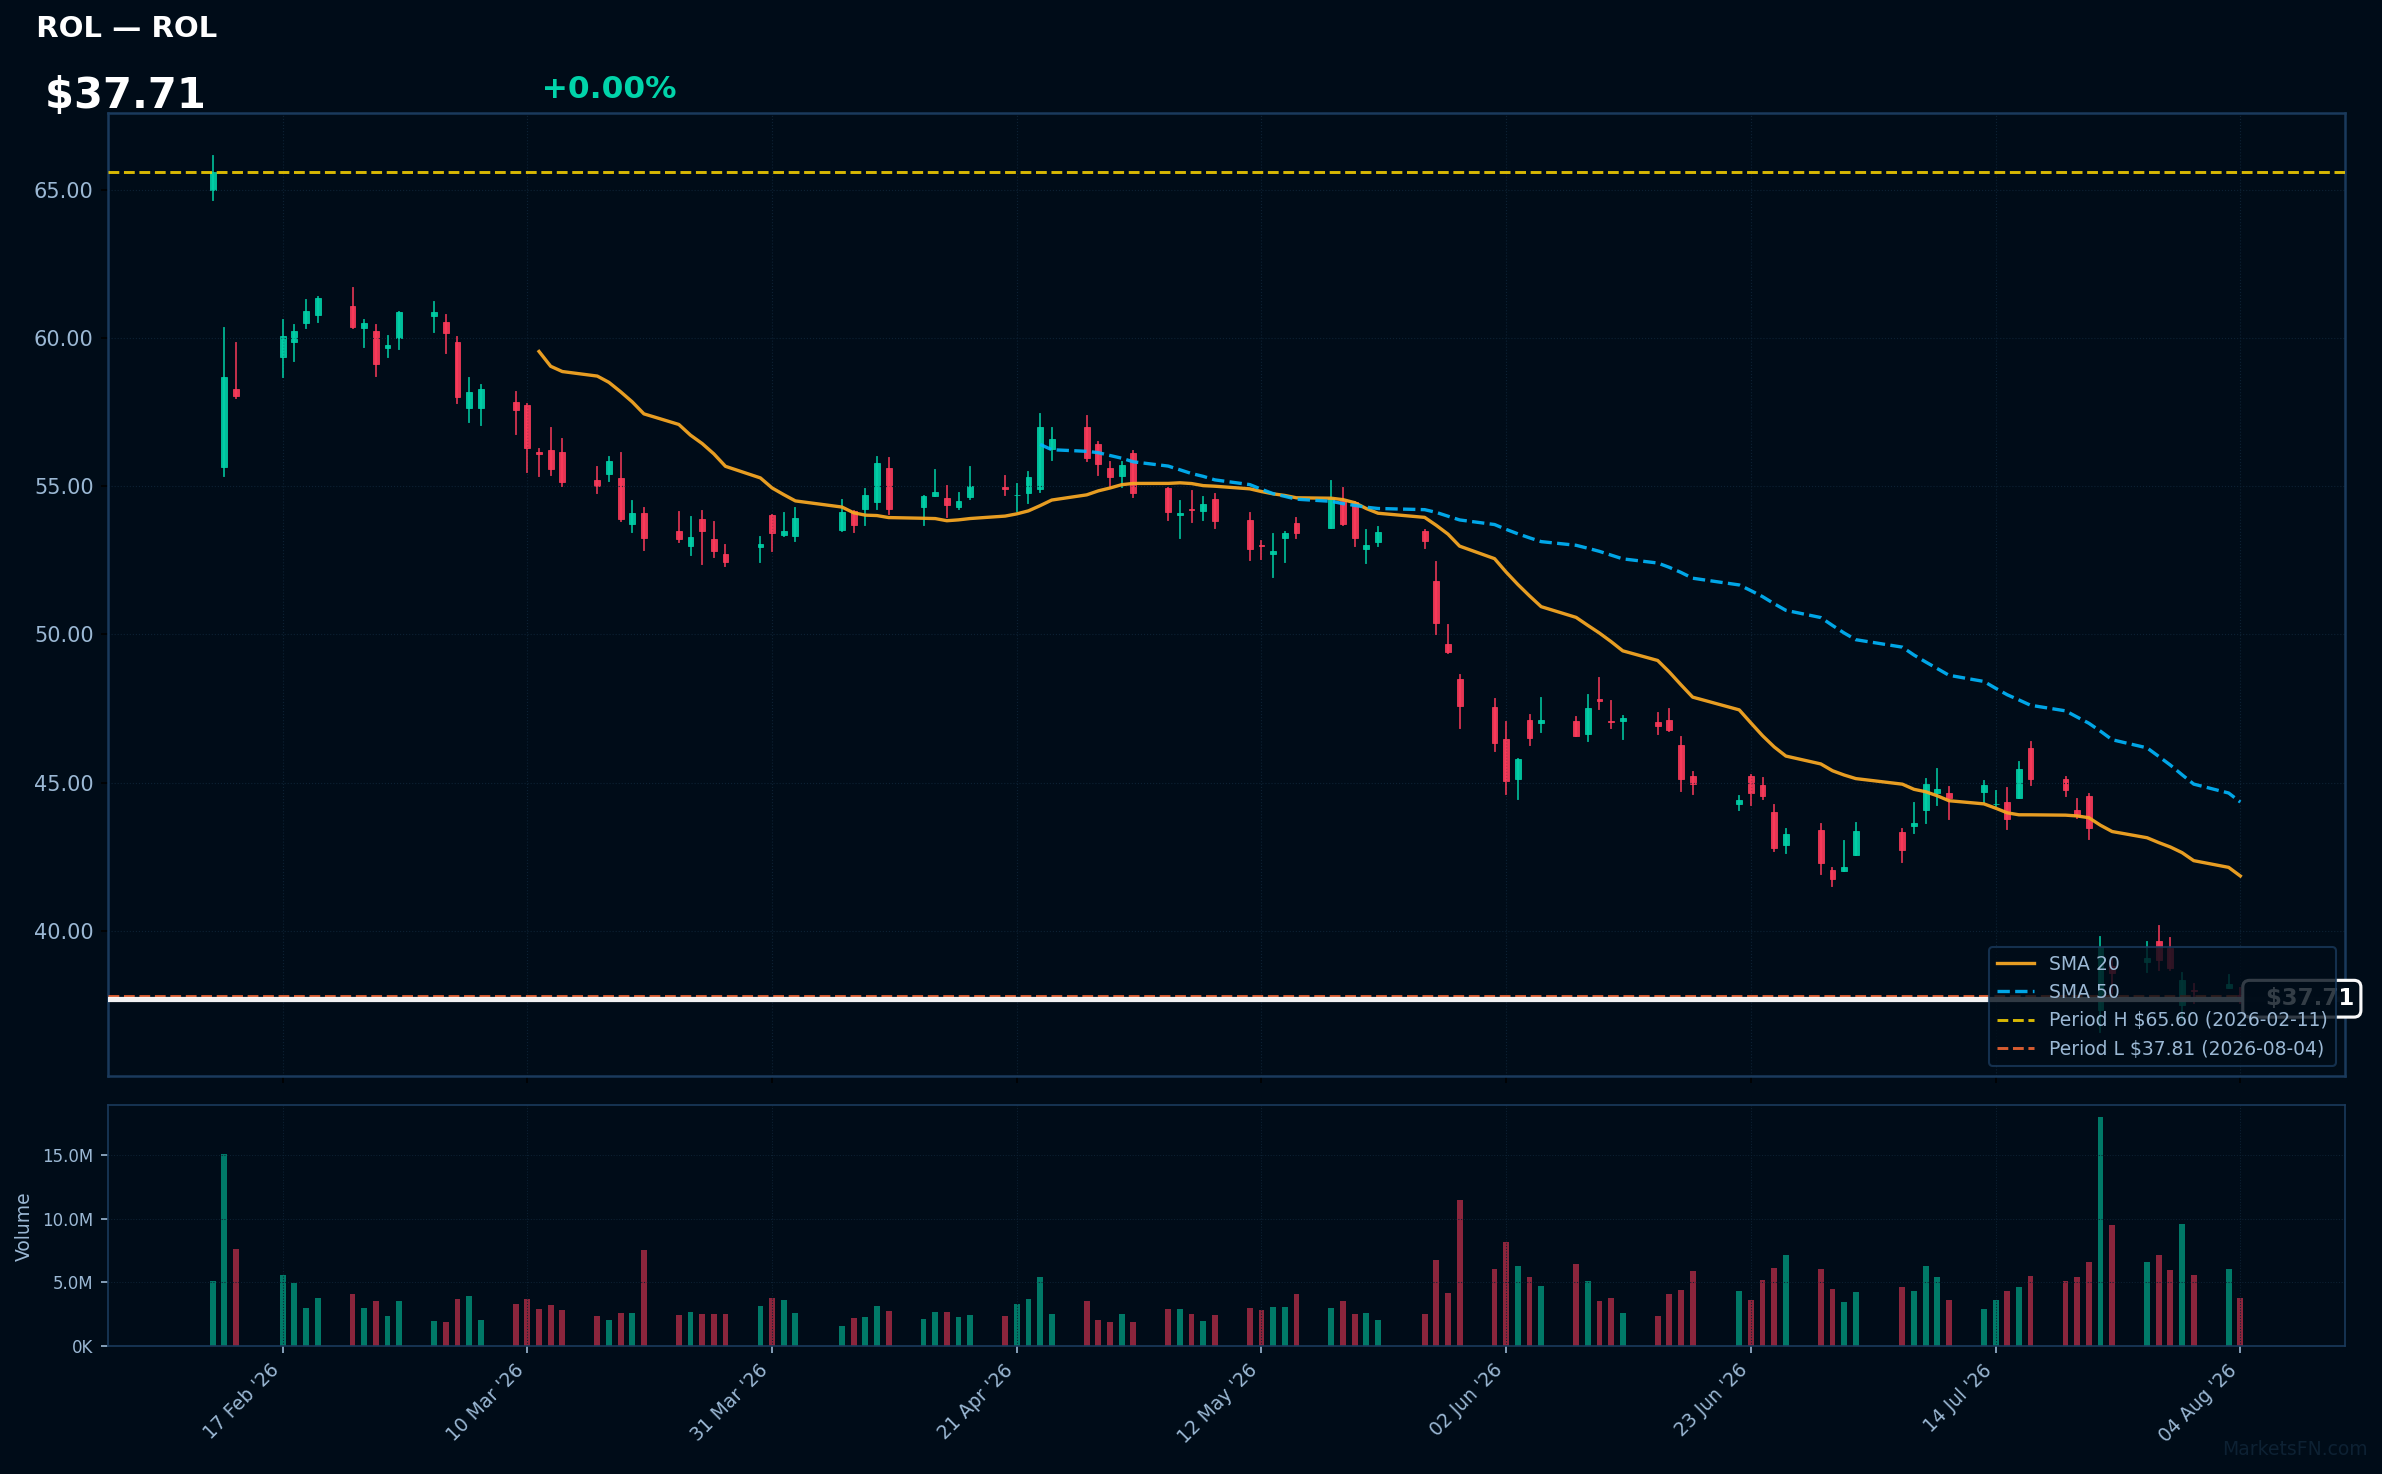
ROL | Rollins, Inc | Consumer Cyclical | Price Last: $37.81 | % Realized: -35.93% | RSI: 26.6 | % above MA200: -30.7% | Trend: Below MA20, MA50, MA200
Rollins, Inc. provides pest control services and products, operating through subsidiaries like Orkin. Investors should care due to its essential service nature, which can provide stability in economic downturns, and its potential for growth in a market increasingly focused on health and hygiene.
The current technical situation for Rollins, Inc. indicates a warning sign, with an RSI(14) of 26.6, suggesting oversold conditions. The bearish MA alignment shows price < MA20 < MA50 < MA200, indicating a sustained downtrend and testing major support just 0.0% above its 2026 YTD low.
Related headlines
- JPMorgan cuts Rollins to Neutral on demand uncertainty, slashes price target
- Rollins Inc (ROL) Q2 2026 Earnings Call Highlights: Strong Growth in Termite and Ancillary ...
- Rollins Inc. stock underperforms Thursday when compared to competitors
- Rollins shares plunge premarket after Q2 miss triggers downgrades
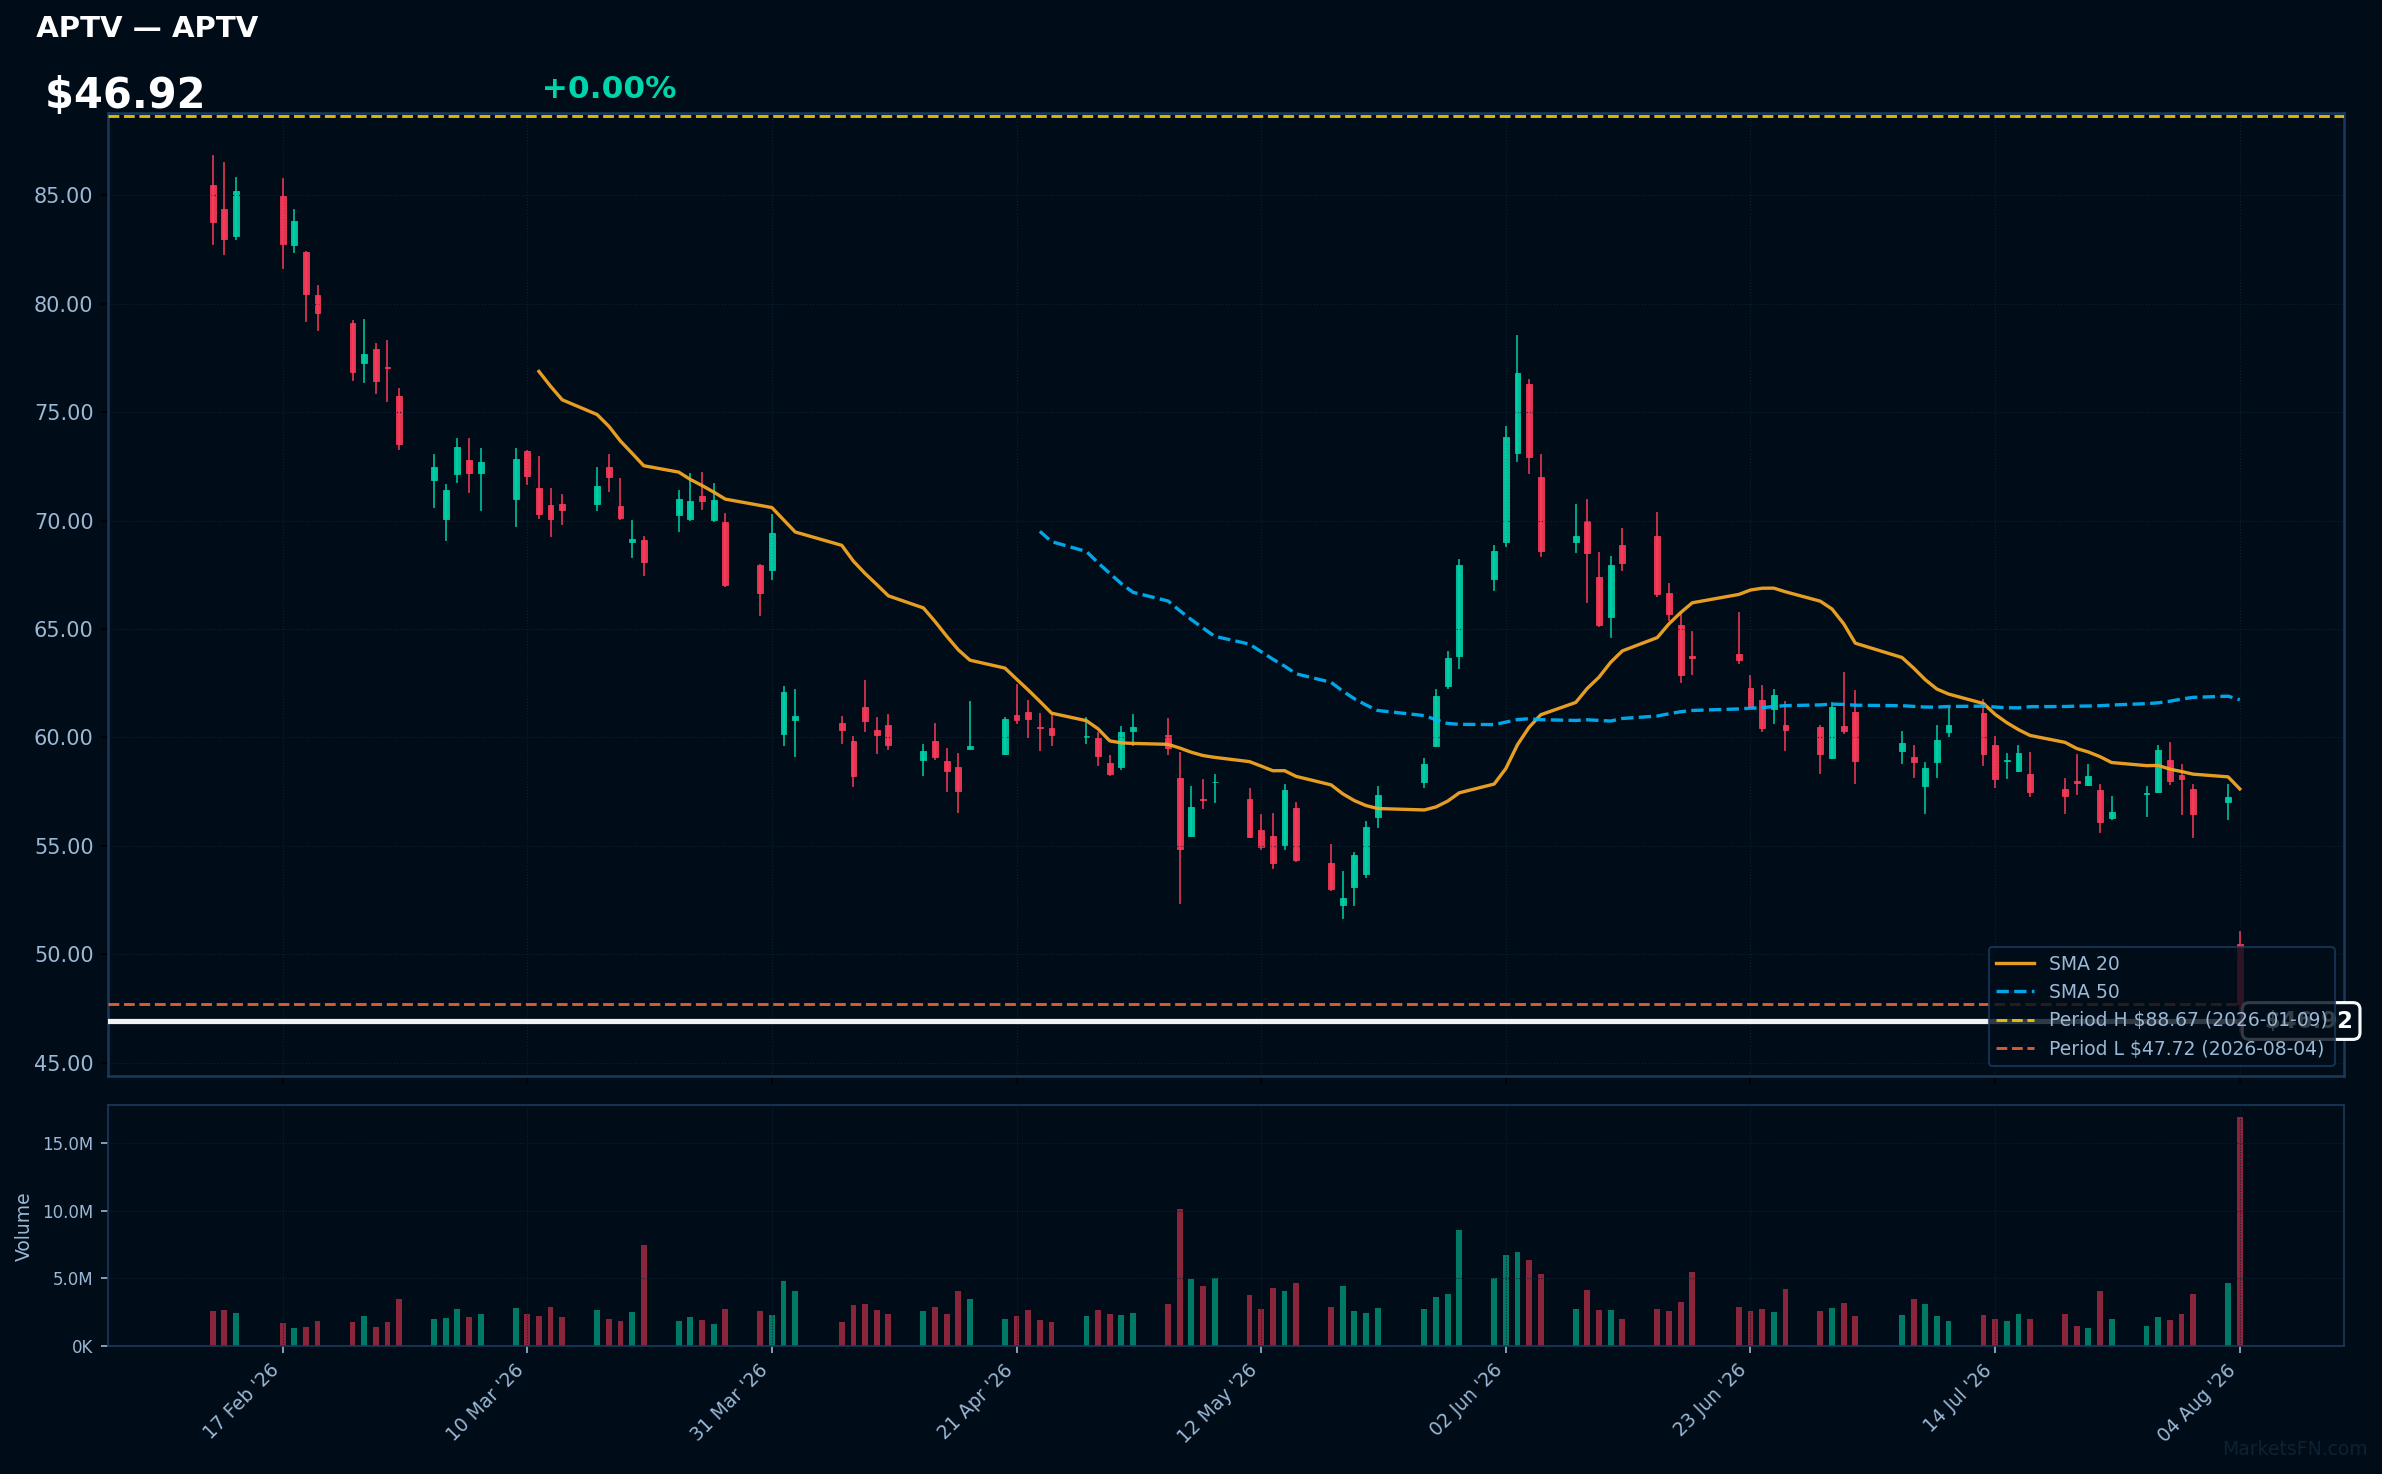
APTV | Aptiv PLC | Consumer Cyclical | Price Last: $47.72 | % Realized: -39.16% | RSI: 25.8 | % above MA200: -32.1% | Trend: Below MA20, MA50, MA200
Aptiv PLC specializes in advanced automotive technology, focusing on connectivity and automated driving solutions. Investors should care due to its pivotal role in the evolving automotive industry, particularly as electric and autonomous vehicles gain traction, impacting future growth potential.
The current technical situation indicates a bearish trend, with an RSI of 25.8 and a MA alignment of price < MA20 < MA50 < MA200, suggesting sustained downward momentum and testing major support levels.
Related headlines
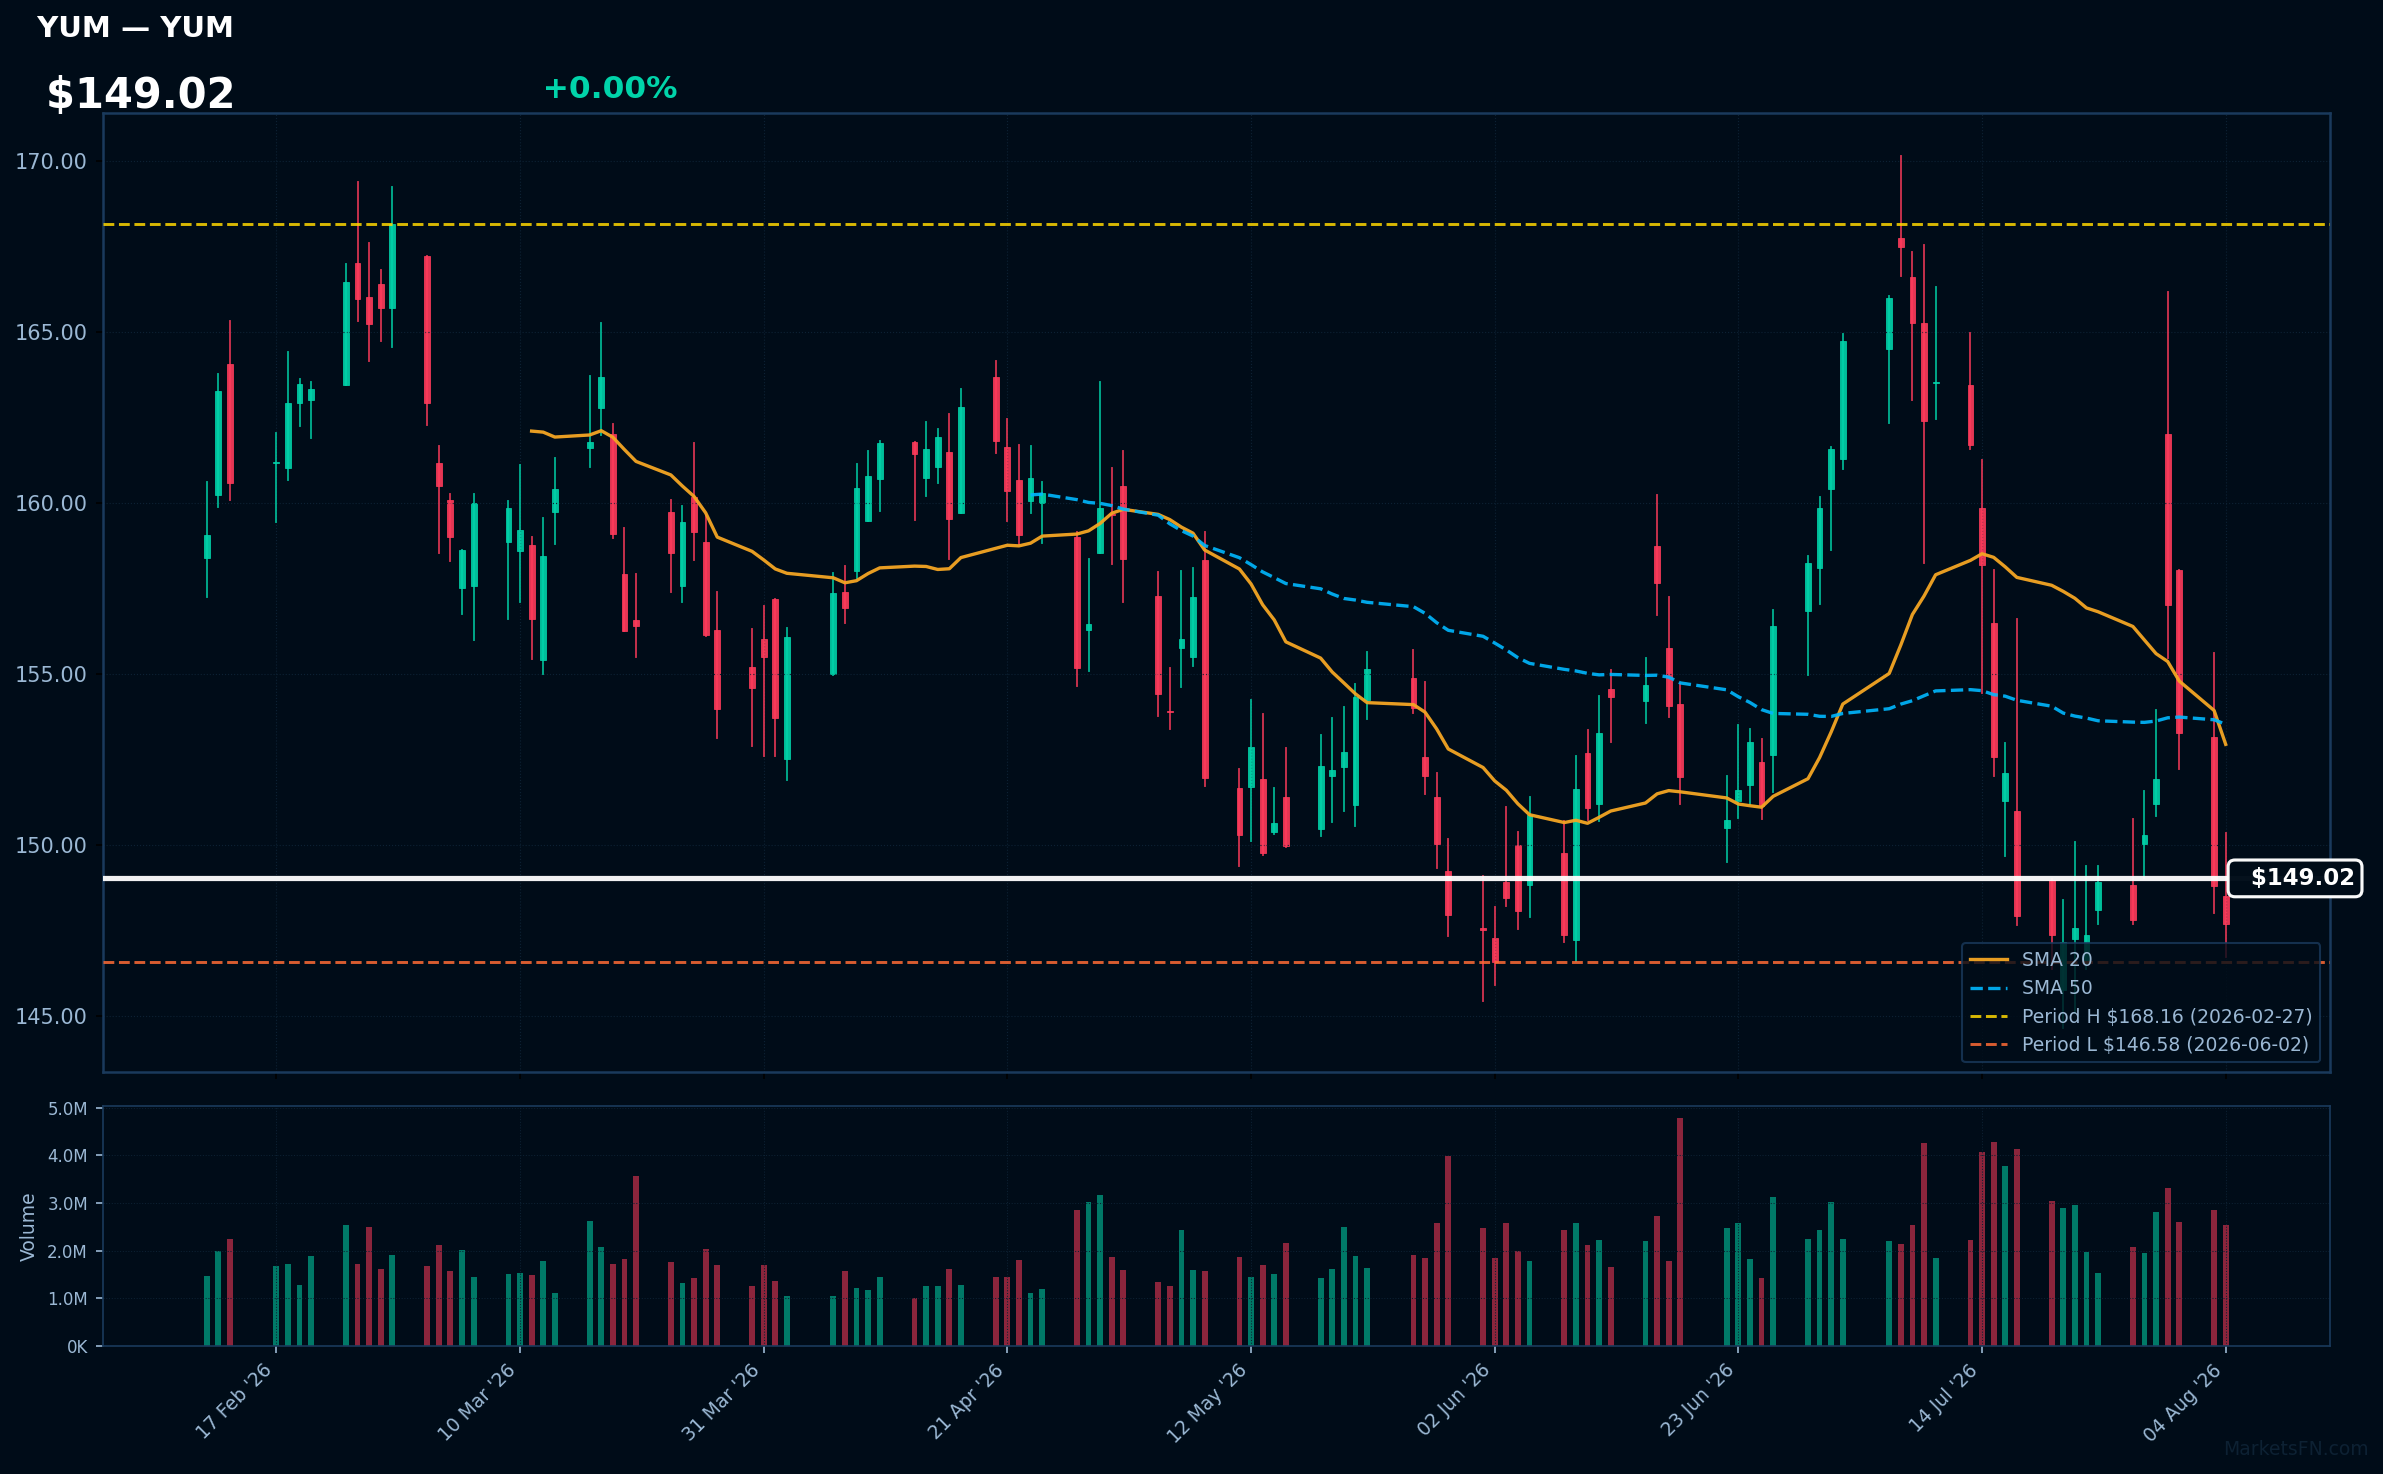
YUM | Yum Brands Inc | Consumer Cyclical | Price Last: $147.68 | % Realized: -1.87% | RSI: 43.9 | % above MA200: -4.3% | Trend: Below MA20, MA50, MA200
Yum Brands Inc operates globally in the fast-food sector, owning popular chains like Taco Bell, KFC, and Pizza Hut. Investors should care due to its significant market presence and potential for growth in emerging markets, alongside its ability to adapt to changing consumer preferences.
The current technical situation indicates a bearish trend, with an RSI(14) of 43.9 and a MA alignment of price < MA20 < MA50 < MA200, suggesting sustained downtrend and testing major support just 0.8% above its 2026 YTD low.
Related headlines
- CMG, YUM, SG, CALM, KR Stocks In Focus: How Recalls, Outbreaks And Supply Chain Chaos Rattled Consumer Stocks In 2026
- YUM Stock Slides Michigan Warned Taco Bell Weeks Before Public Cyclospora Alert, Report Says
- Sweetgreen drops 7%, Yum falls 2% as Michigan cyclospora deaths rise to 2
- Yum bids Pizza Hut farewell, overhauls KFC
Market Commentary
The S&P 500 stocks nearing their 2026 year-to-date extremes indicate significant price stability and investor confidence in these companies. With Microsoft Corporation, Berkshire Hathaway Inc, JPMorgan Chase & Co, Visa Inc, and Bank Of America Corp all at 0.0% from their highs, it suggests these stocks are performing robustly, reflecting strong fundamentals and market sentiment. Conversely, stocks like Public Service Enterprise Group Inc, NRG Energy Inc, Rollins, Inc, Aptiv PLC, and Yum Brands Inc are hovering close to their lows, with Yum Brands Inc only +0.8% above its low, indicating potential struggles or sector-specific challenges.
The current market conditions reveal a dichotomy between sectors. The companies near their highs are primarily in technology and financial services, sectors that have benefitted from favorable economic conditions and strong consumer demand. In contrast, those near their lows may be facing headwinds from regulatory pressures, changing consumer preferences, or economic uncertainties that impact their operational performance.
Investors should closely monitor upcoming earnings reports and economic indicators that could influence these stocks' trajectories. Additionally, shifts in interest rates and inflation data will be critical in determining the sustainability of the current market trends. Keeping an eye on sector rotations and potential recovery signals in the lagging stocks will also be essential for informed investment decisions.
Methodology: All 503 S&P 500 constituents screened. Close prices downloaded from 2026-01-01. Period high = highest close since Jan 1 2026; period low = lowest close since Jan 1 2026. Distance = (current price / period extreme − 1) × 100. Technical indicators computed on up to 1 year of daily OHLCV data.
Disclaimer: For informational purposes only. Not investment advice. Past performance is not indicative of future results.