S&P 500 2026 YTD Highs & Lows Radar: Welltower (WELL), Oracle (ORCL) and more
· Stocks · MarketsFN Team
S&P 500 2026 YTD Highs & Lows Radar: Welltower (WELL), Oracle (ORCL) and more
Screening all 503 S&P 500 constituents for stocks nearest to their 2026 year-to-date high and their 2026 YTD low. Data as of July 21, 2026. % Realized = total return since Jan 1 2026.
Legend: RSI > 70 = overbought · RSI < 30 = oversold · Green % Realized = positive YTD return · Red = negative.
📈 Nearest to 2026 High
Sectors represented: Energy (2), Real Estate (1), Consumer Defensive (1), Healthcare (1)
| Ticker | Company | Sector | Price Last | % Realized | 2026 YTD High Date | RSI | % above MA200 | Trend |
|---|---|---|---|---|---|---|---|---|
| WELL | Welltower Inc | Real Estate | $244.84 | +30.97% | 2026-07-20 | 70.2 | +21.7% | Above MA20, MA50, MA200 |
| MO | Altria Group Inc | Consumer Defensive | $74.66 | +30.27% | 2026-07-20 | 57.5 | +14.3% | Above MA20, MA50, MA200 |
| CVS | CVS Health Corp | Healthcare | $107.61 | +34.29% | 2026-07-20 | 68.5 | +29.1% | Above MA20, MA50, MA200 |
| MPC | Marathon Petroleum Corp | Energy | $315.31 | +90.93% | 2026-07-20 | 79.8 | +45.4% | Above MA20, MA50, MA200 |
| PSX | Phillips 66 | Energy | $208.80 | +59.91% | 2026-07-20 | 75.5 | +33.0% | Above MA20, MA50, MA200 |
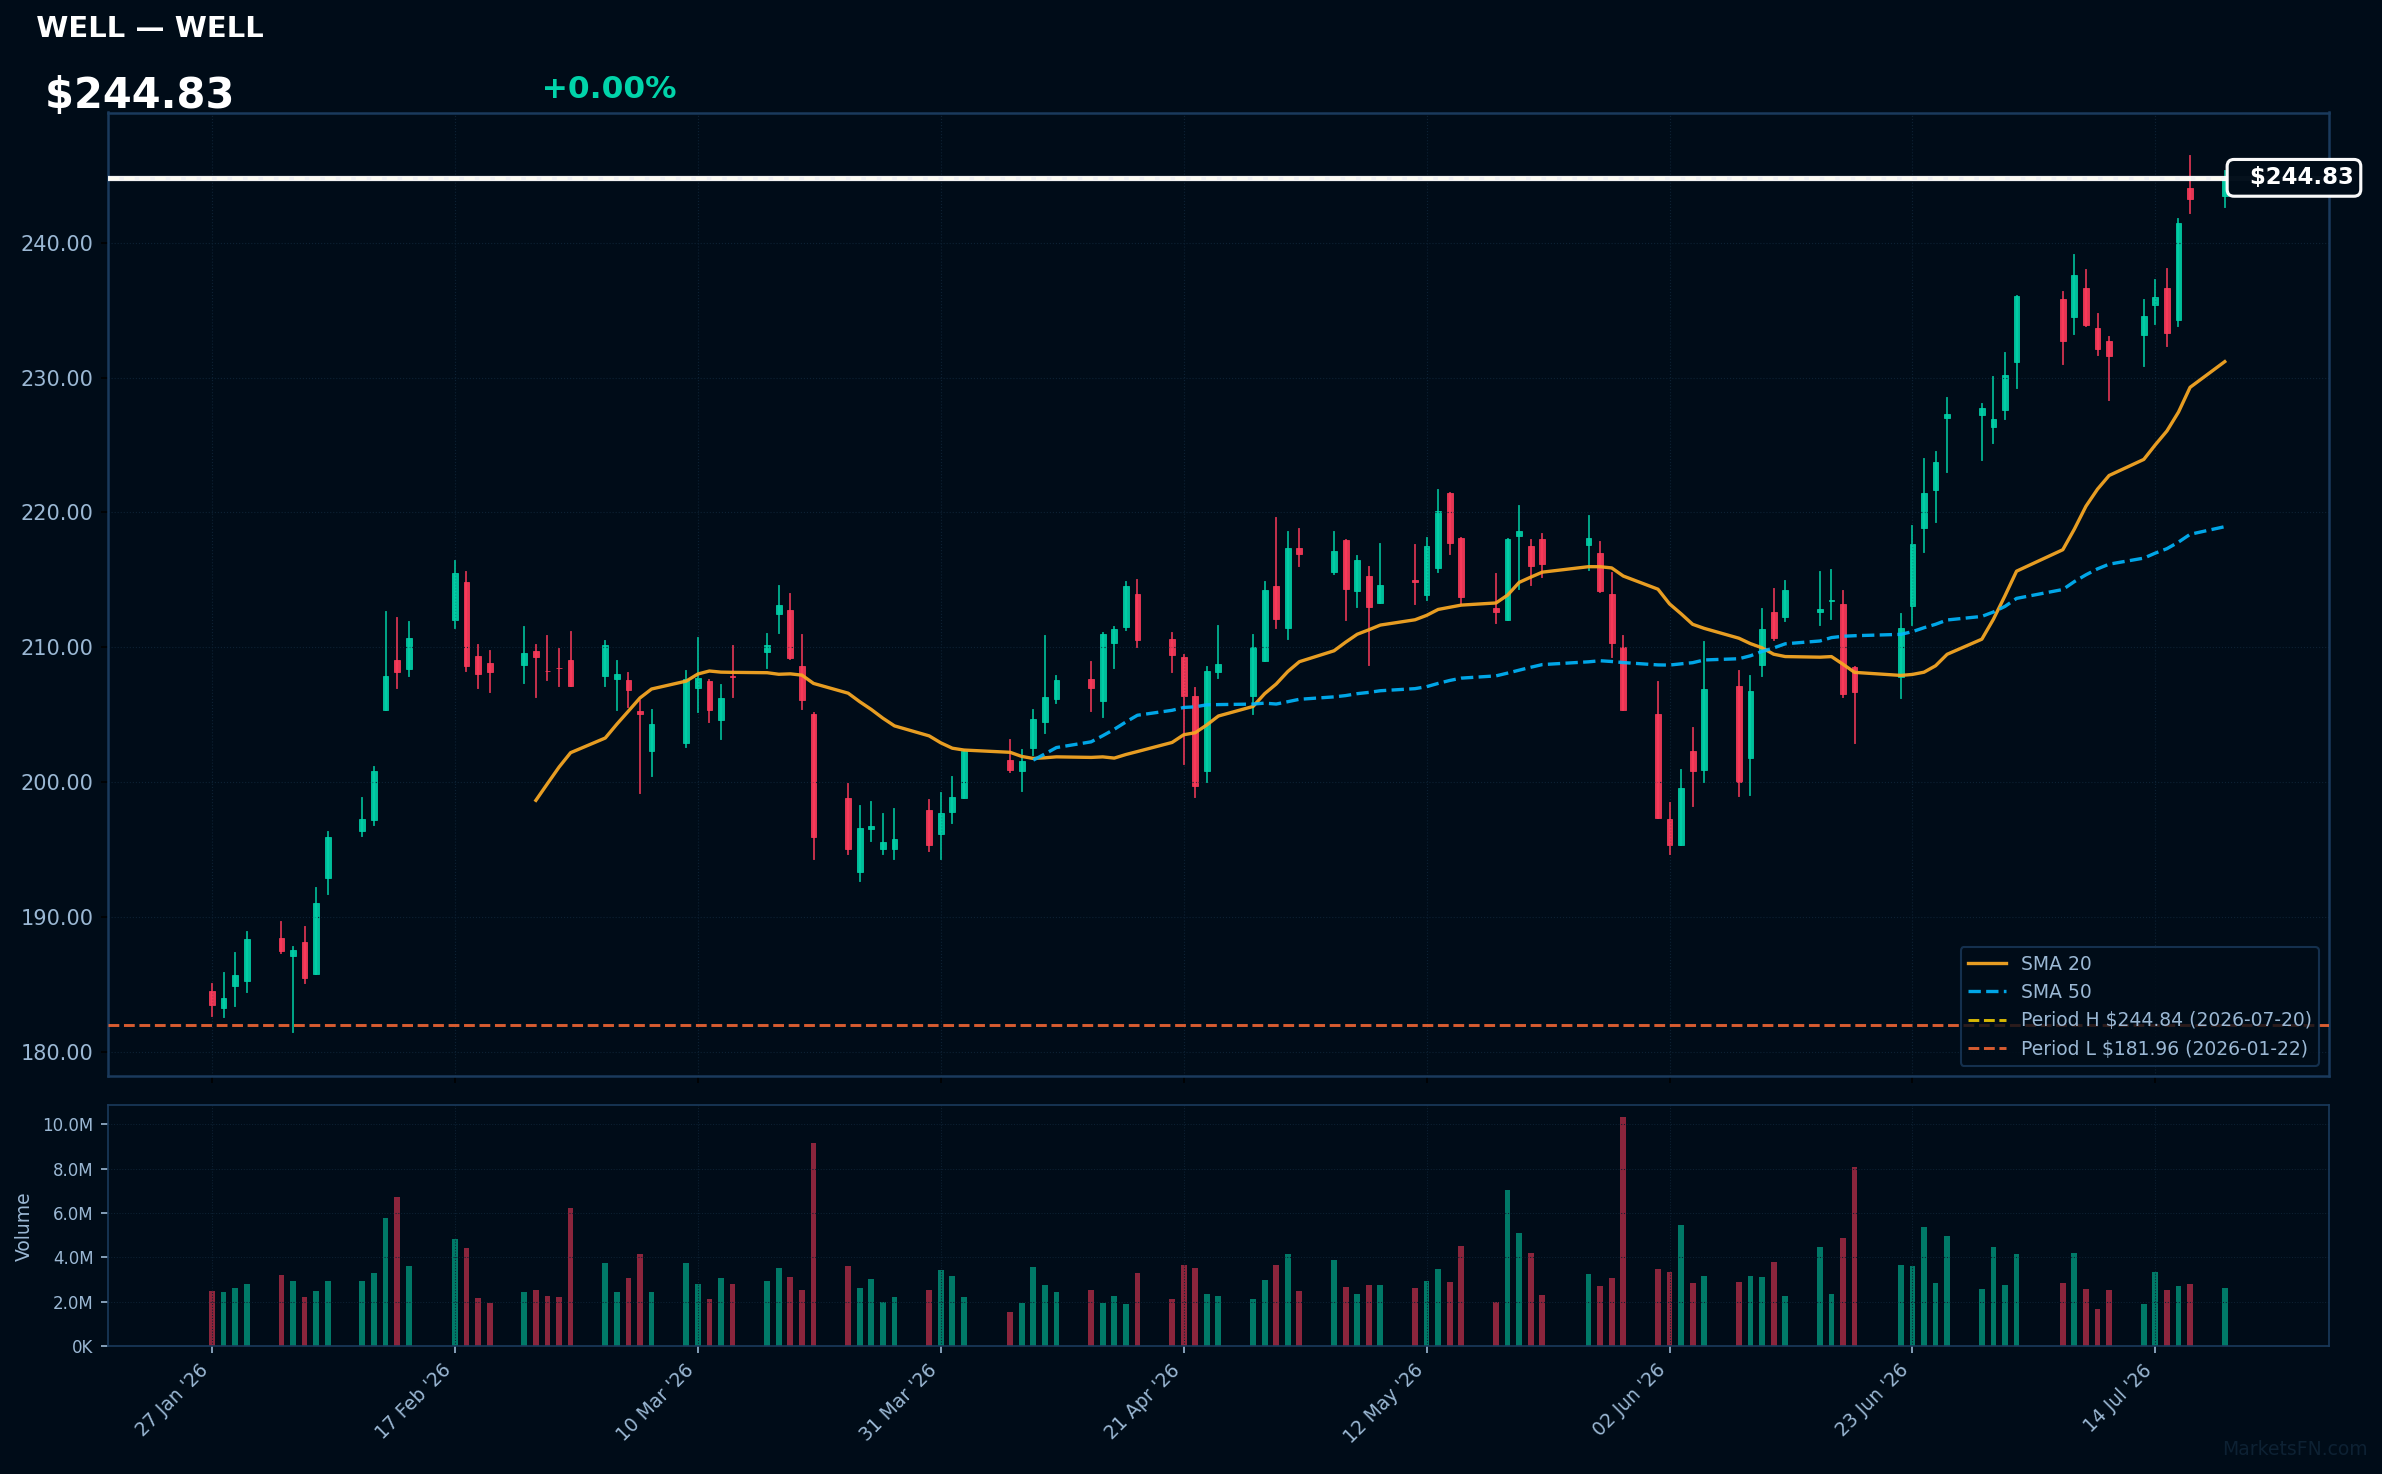
WELL | Welltower Inc | Real Estate | Price Last: $244.84 | % Realized: +30.97% | RSI: 70.2 | % above MA200: +21.7% | Trend: Above MA20, MA50, MA200
Welltower Inc (WELL) is a healthcare real estate investment trust (REIT) that owns and operates senior housing and healthcare facilities. Investors should care because its performance is tied to the growing demand for healthcare infrastructure driven by an aging population.
WELL's RSI(14) is 70.2, indicating strong momentum with price > MA20 > MA50 > MA200, a bullish MA alignment. The stock is 0.0% below its 2026 YTD high, near a potential breakout level, with a 31.0% return over the 2026 YTD period.
Related headlines
- Welltower CFO Timothy McHugh sets U.S. pay record at $167M
- Welltower Announces Date of Second Quarter 2026 Earnings Release, Conference Call and Webcast
- Welltower's Dividend Is Up 15%. Here's What Really Matters.
- Welltower Board of Directors Approves 15% Increase in Quarterly Dividend to $0.85 per Share
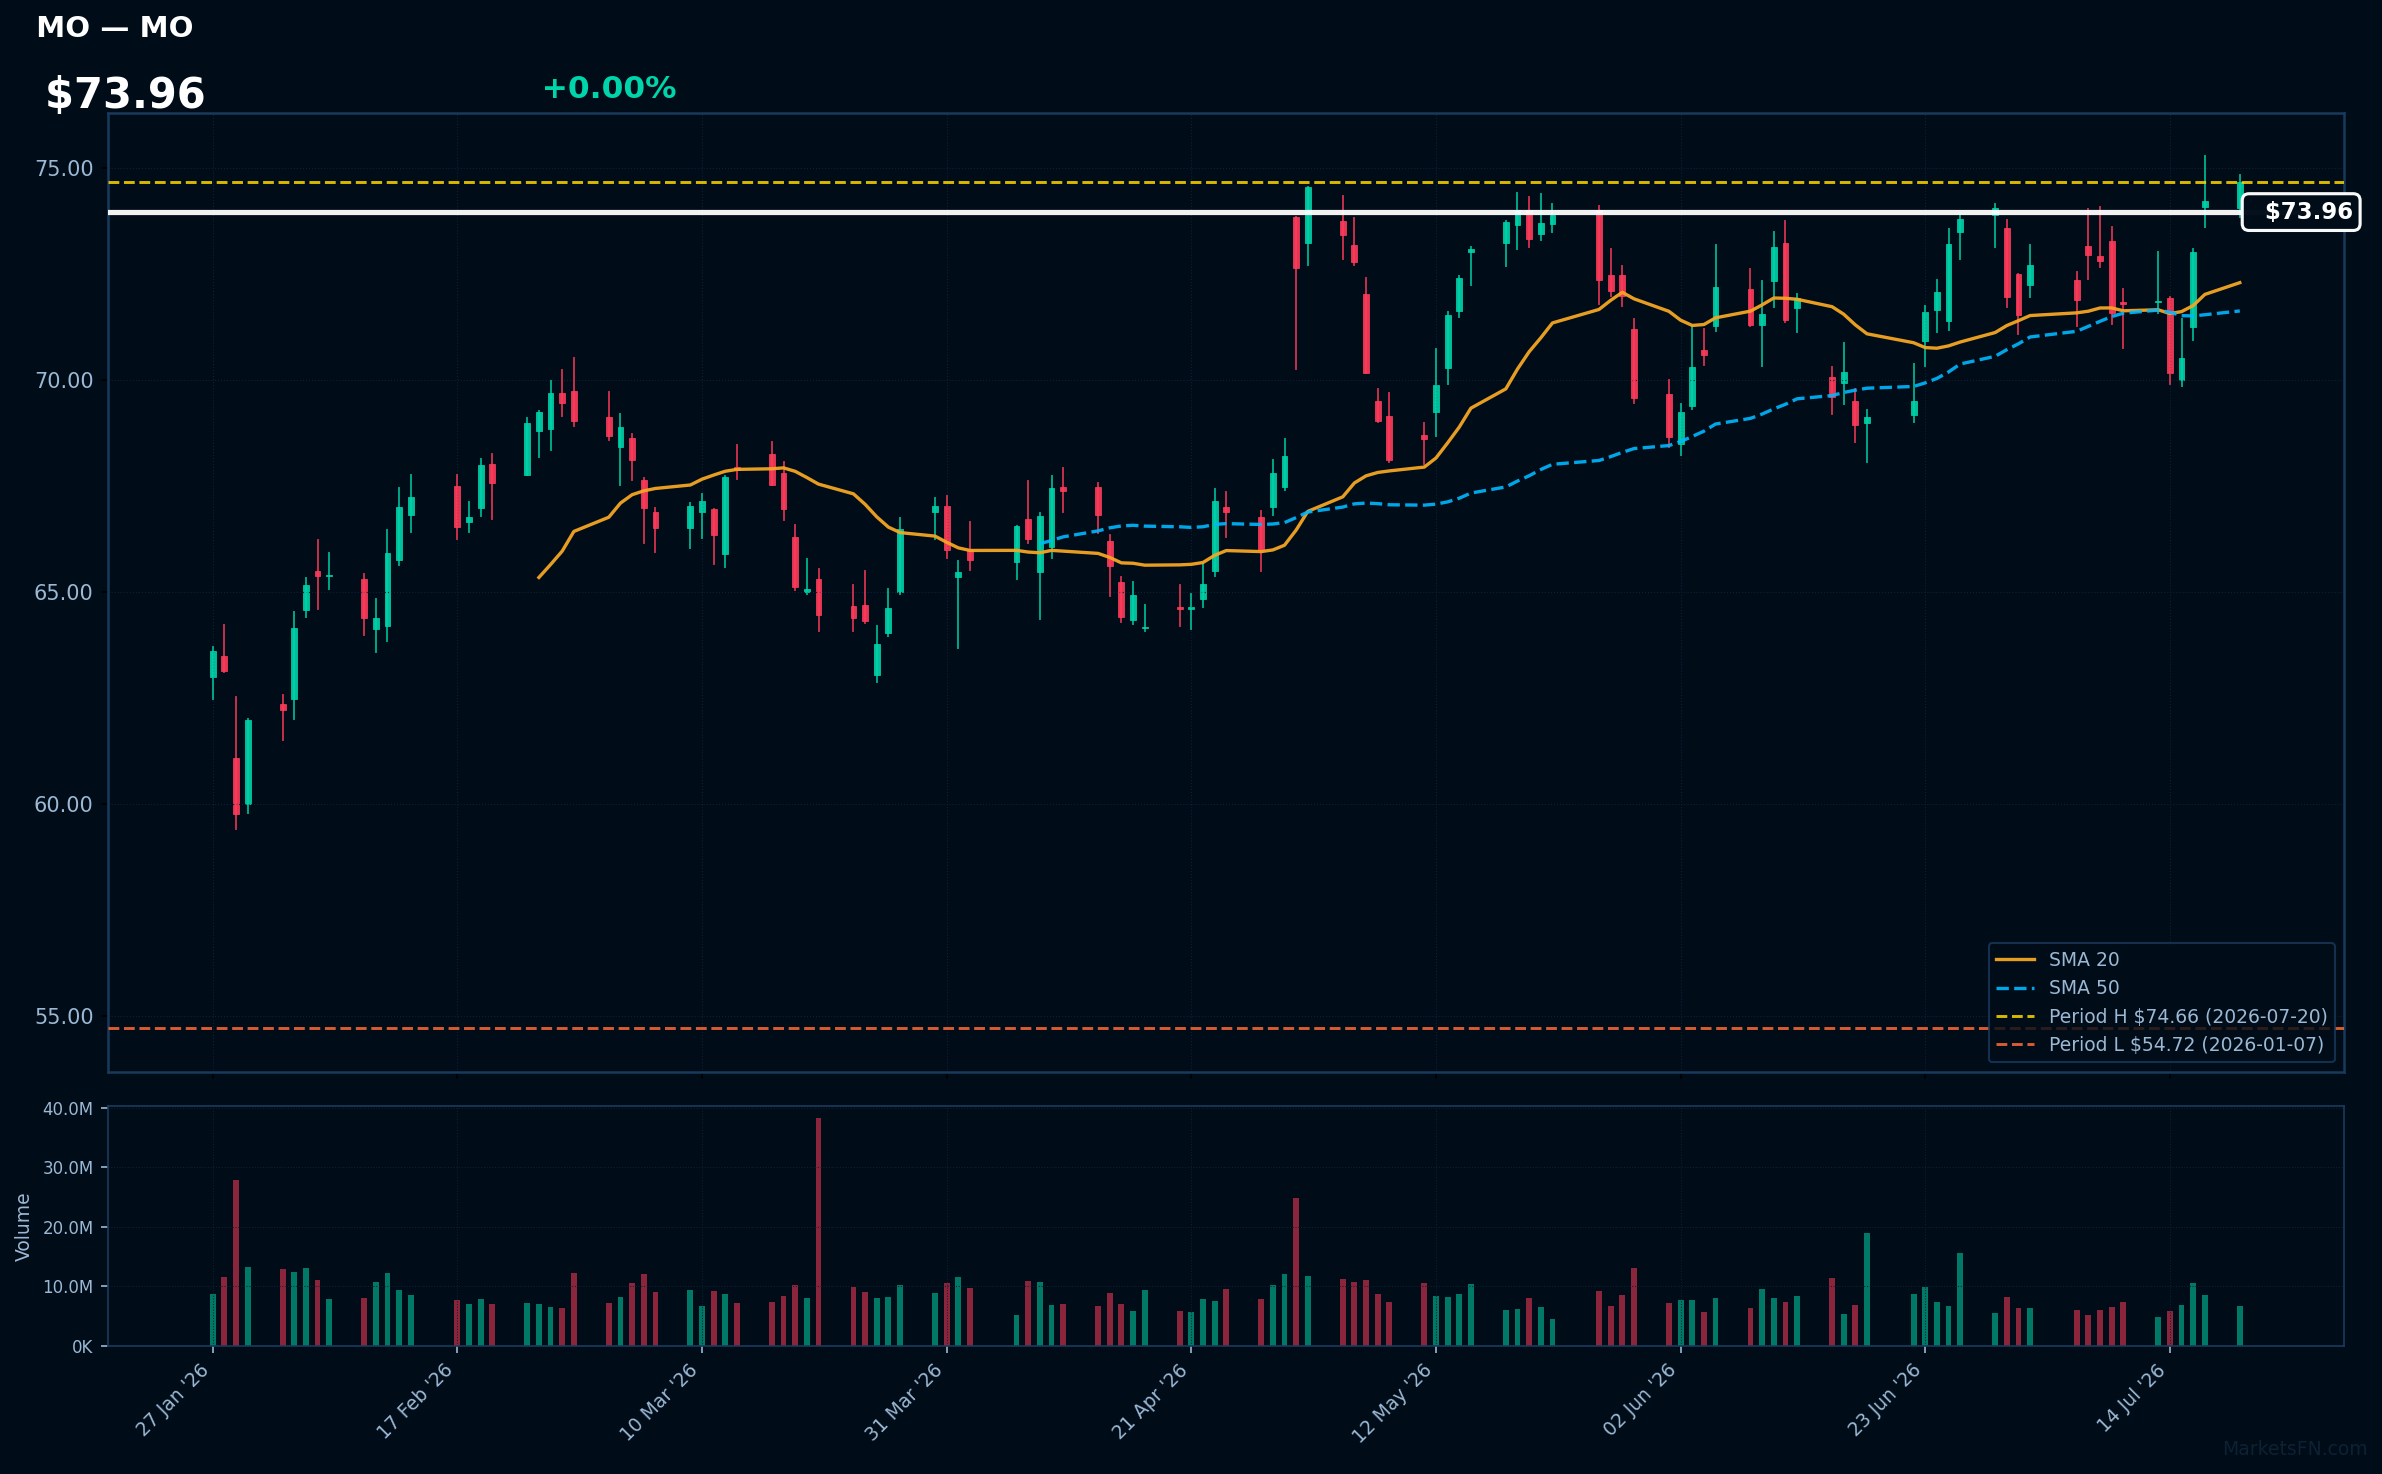
MO | Altria Group Inc | Consumer Defensive | Price Last: $74.66 | % Realized: +30.27% | RSI: 57.5 | % above MA200: +14.3% | Trend: Above MA20, MA50, MA200
Altria Group Inc is a tobacco company owning brands like Marlboro. Investors care due to its stable cash flows and dividend yield, despite declining tobacco consumption. Specific product dominance and pricing power are key factors.
Altria's technicals indicate sustained uptrend with price > MA20 > MA50 > MA200. RSI(14) is 57.5, nearing overbought territory. The stock is 0.0% below its 2026 YTD high, suggesting potential breakout momentum with 30.3% 2026 YTD return.
Related headlines
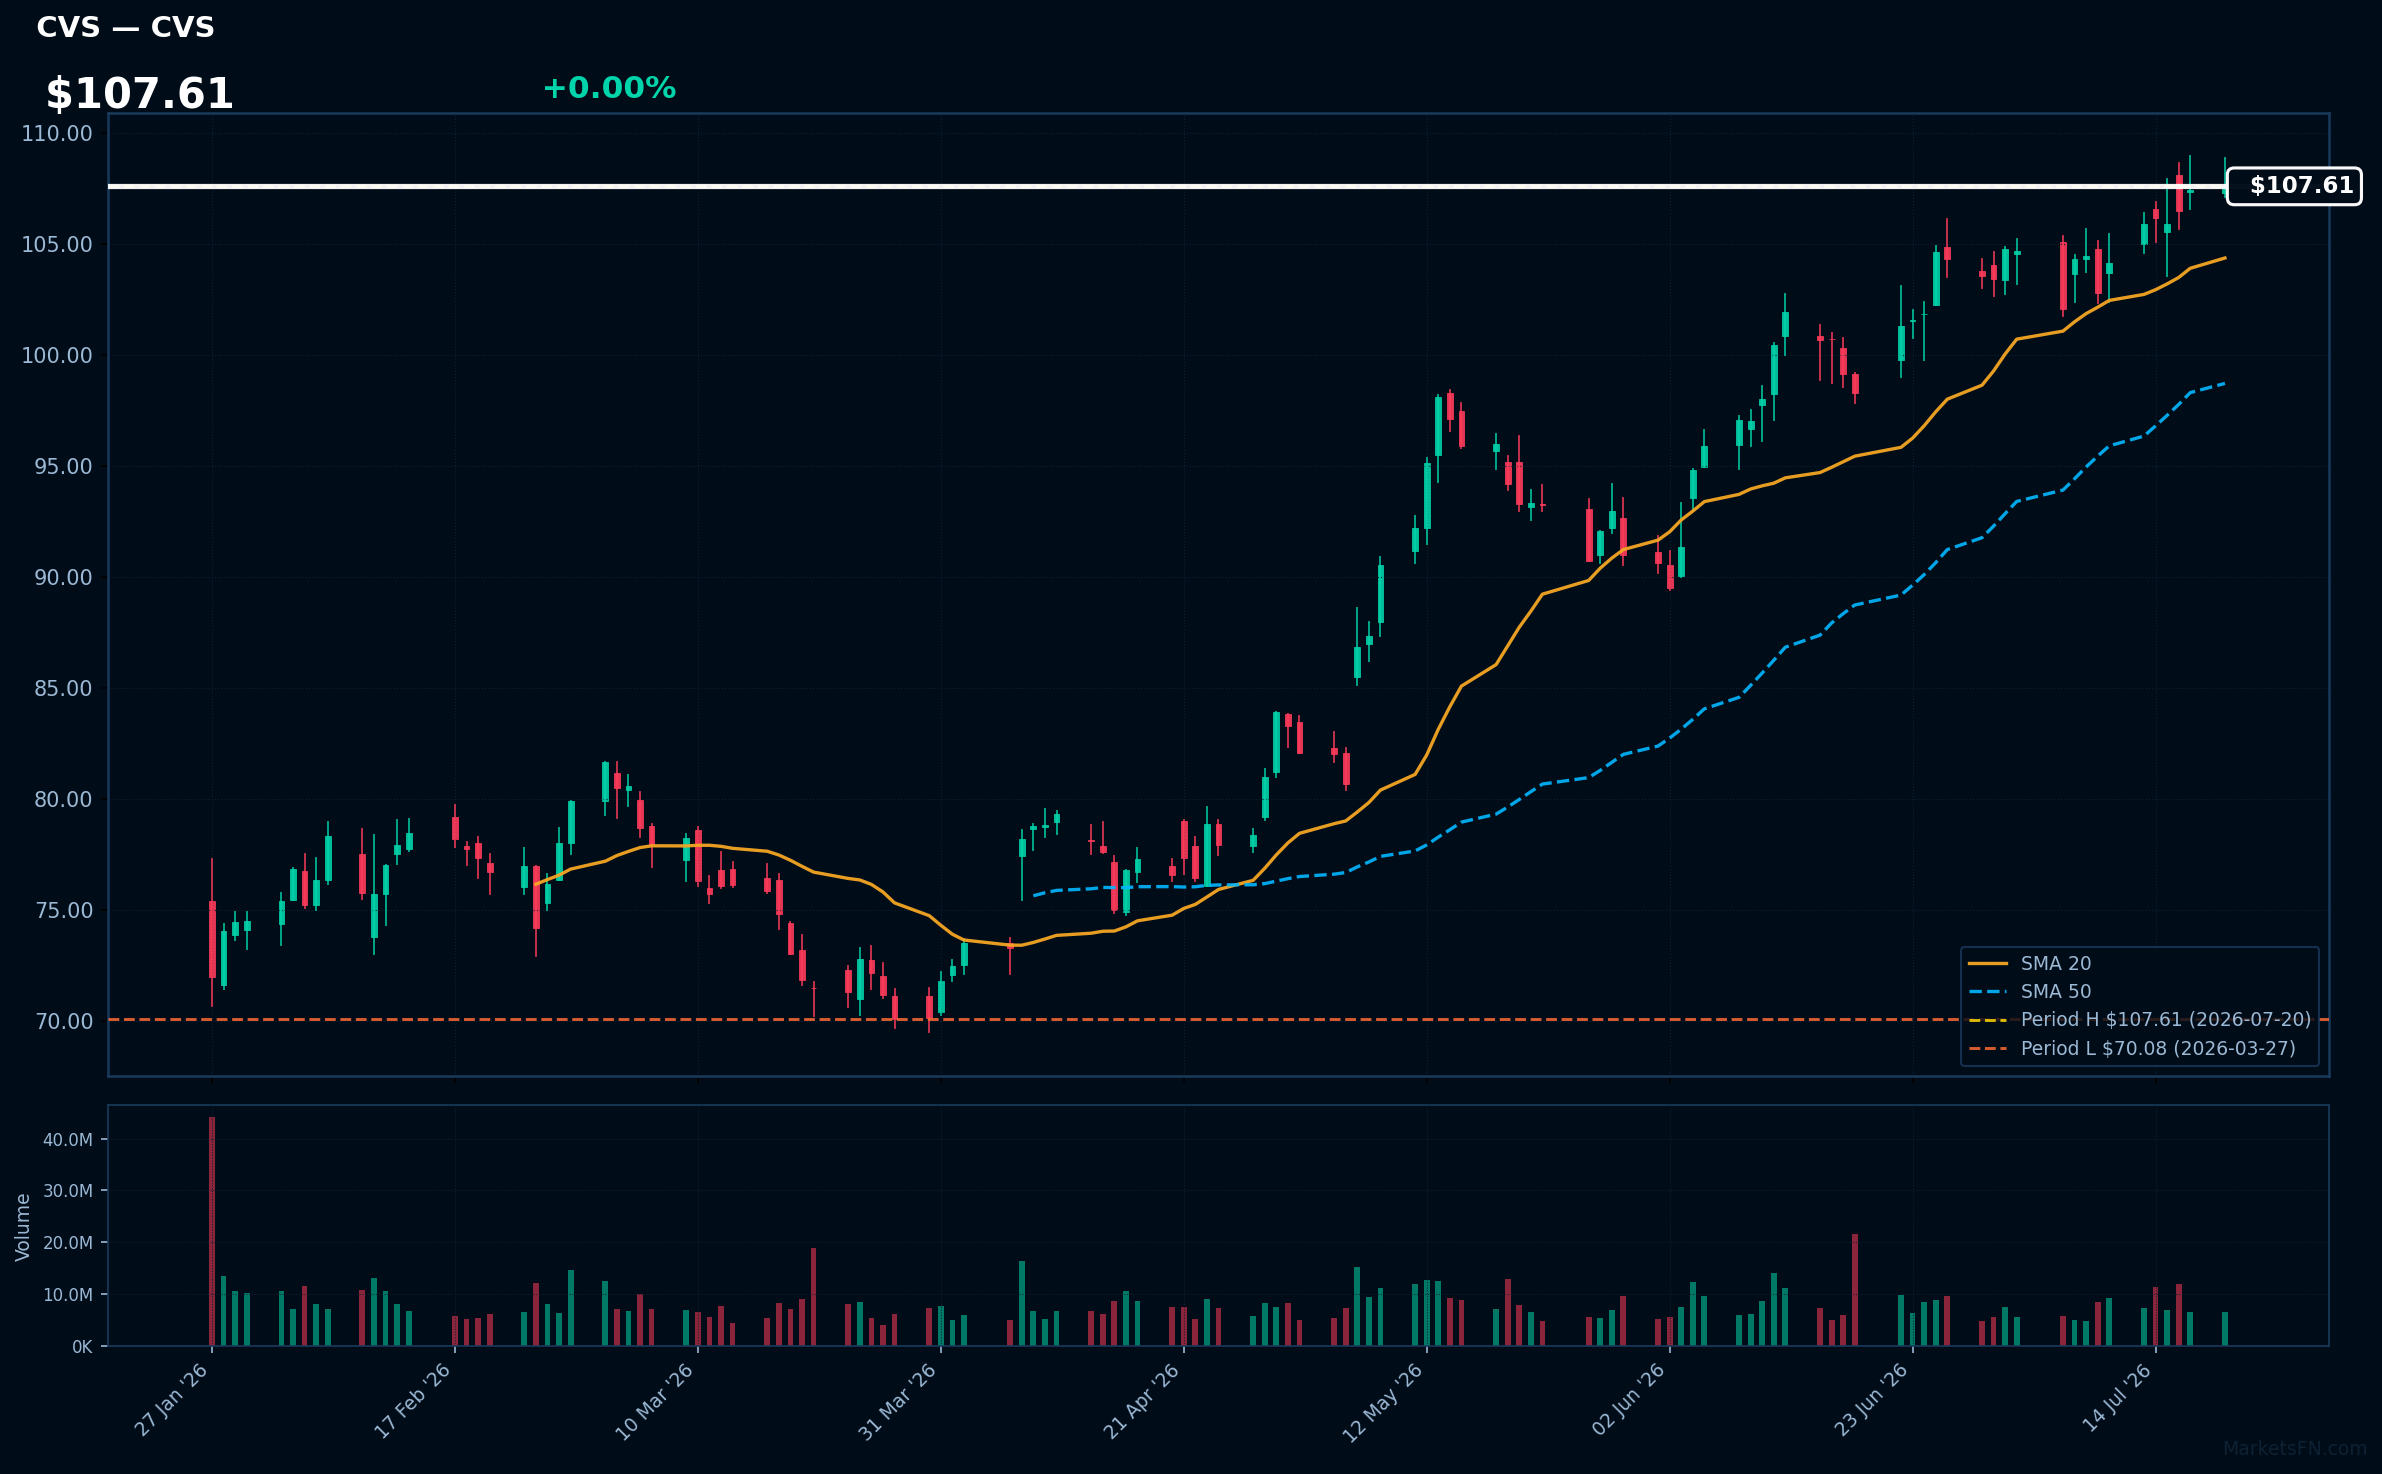
CVS | CVS Health Corp | Healthcare | Price Last: $107.61 | % Realized: +34.29% | RSI: 68.5 | % above MA200: +29.1% | Trend: Above MA20, MA50, MA200
CVS Health Corp operates a large pharmacy chain and health insurance business, making it a significant player in healthcare delivery and insurance; investors should care because its performance reflects broader healthcare trends and insurance market dynamics.
CVS is in a sustained uptrend with price > MA20 > MA50 > MA200, RSI(14) at 68.5, and is 0.0% below its 2026 YTD high, indicating strong momentum with no clear warning signs; its 34.3% 2026 YTD return reinforces this positive technical picture.
Related headlines
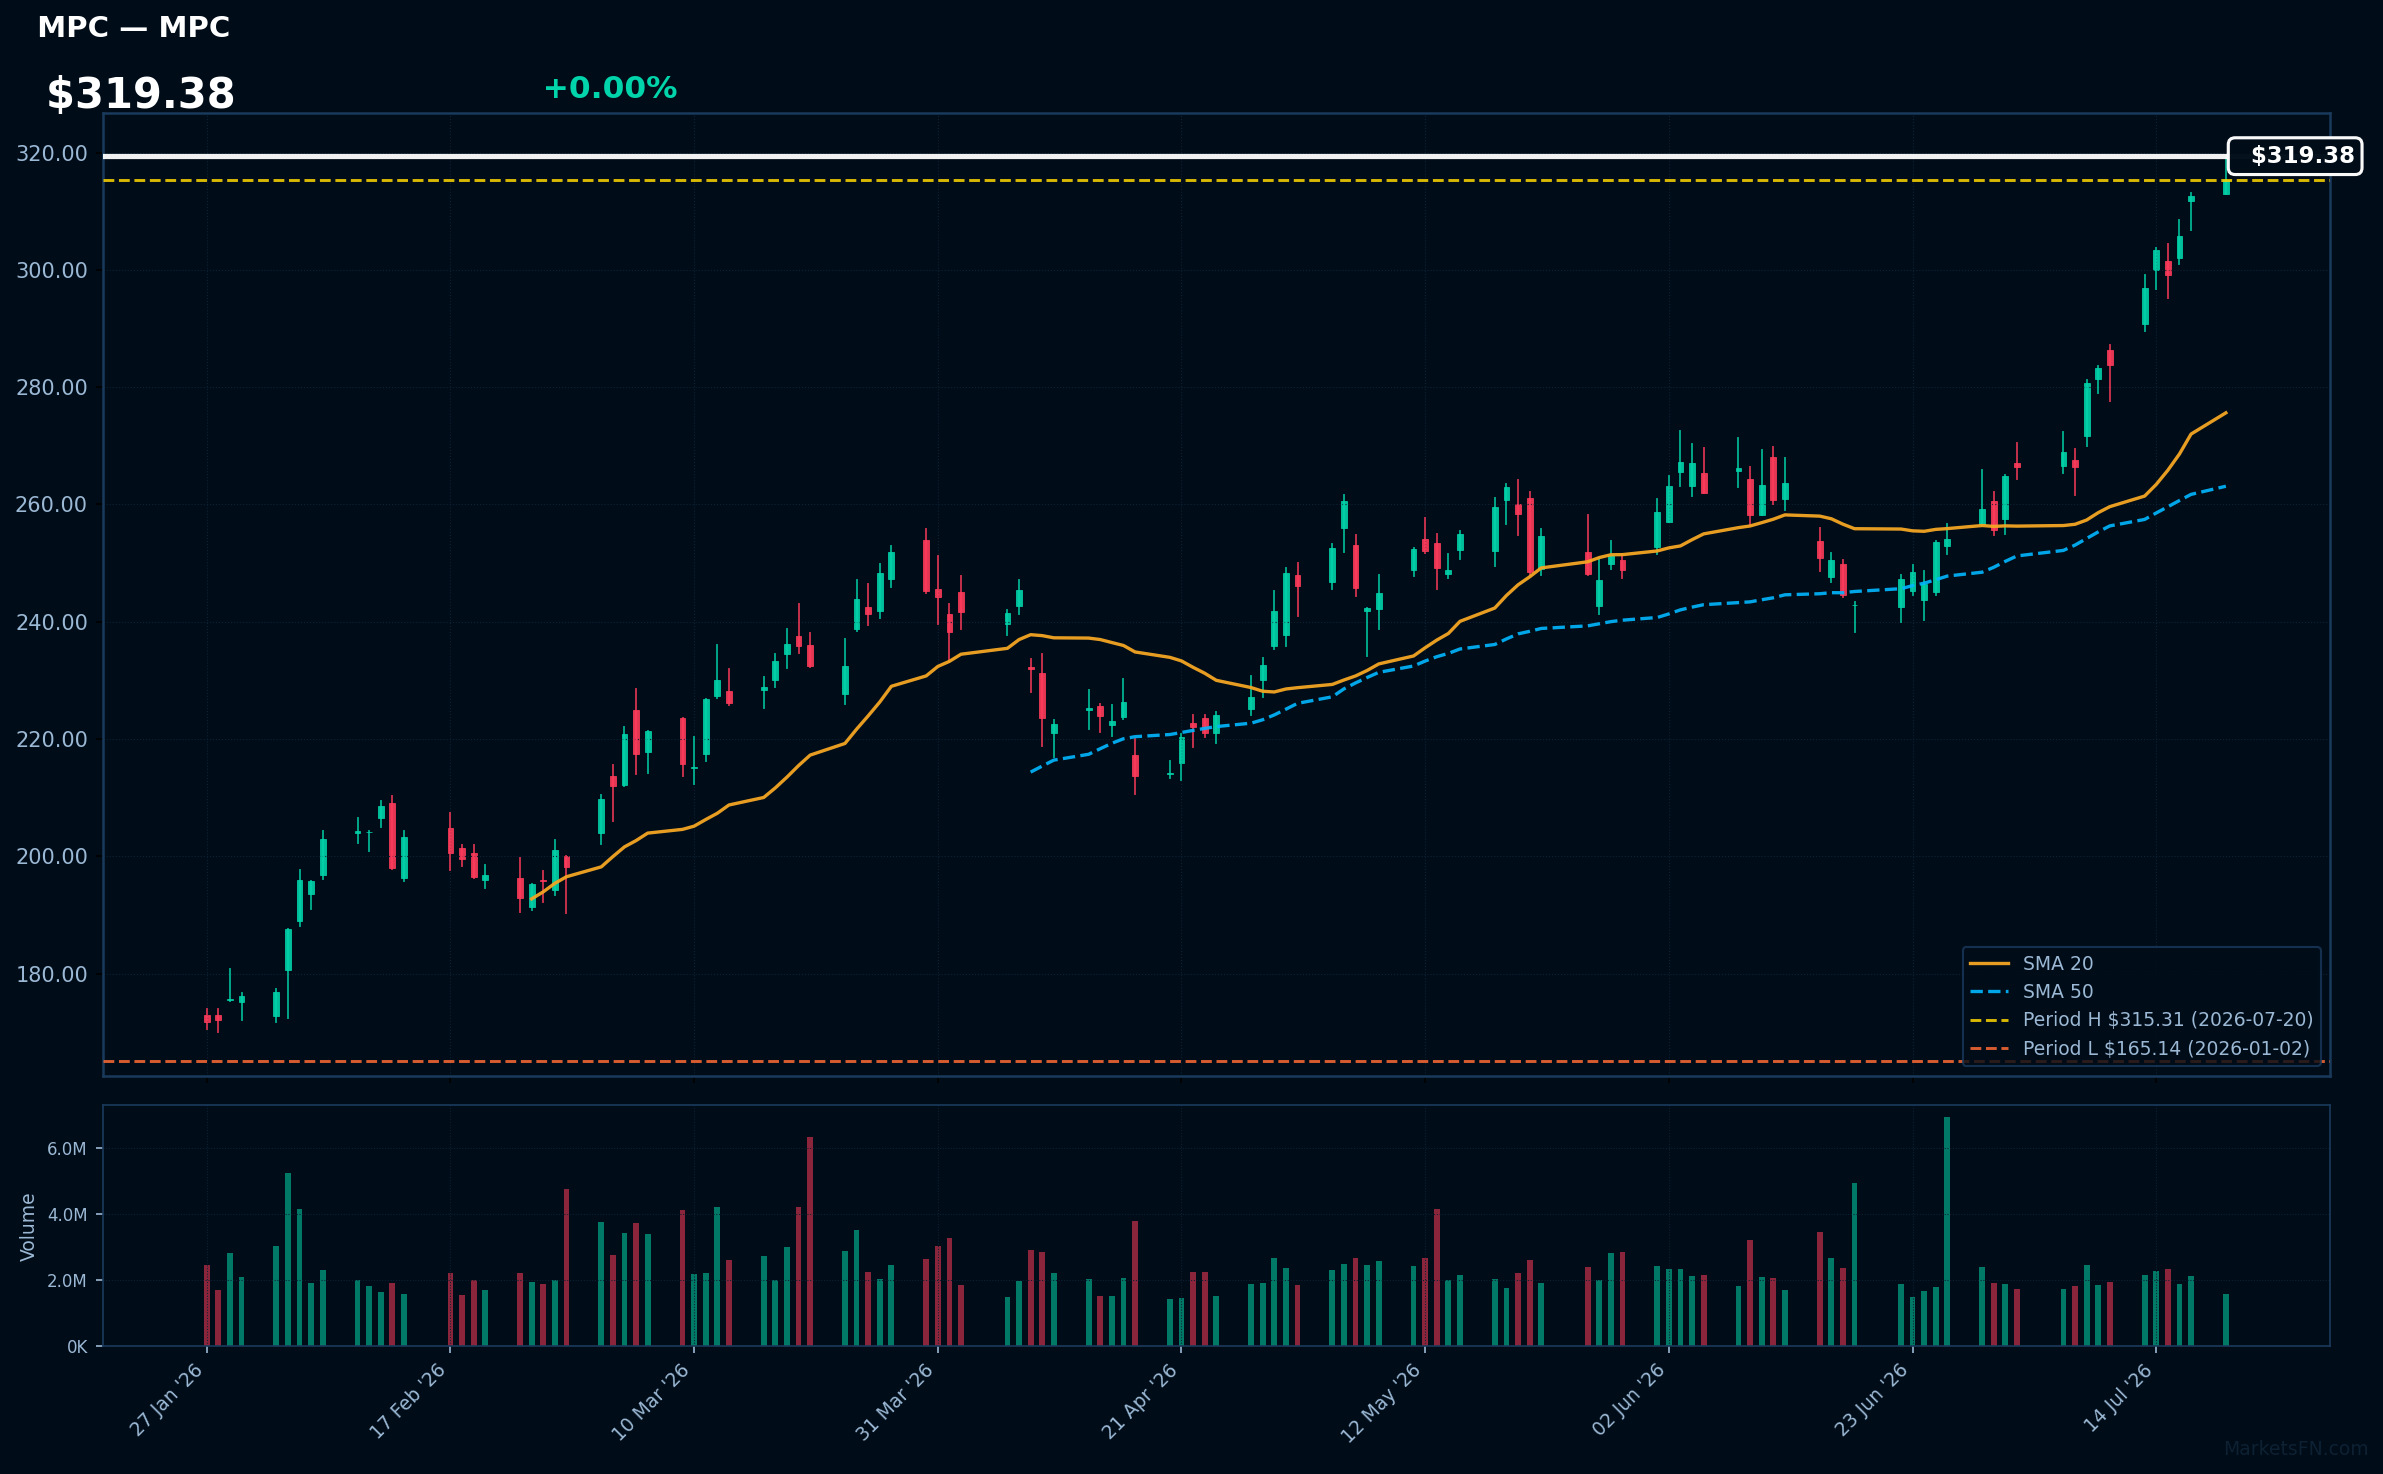
MPC | Marathon Petroleum Corp | Energy | Price Last: $315.31 | % Realized: +90.93% | RSI: 79.8 | % above MA200: +45.4% | Trend: Above MA20, MA50, MA200
Marathon Petroleum Corp is a refining and marketing company that operates a significant refining capacity and distributes petroleum products. Investors should care about its refining margins, capacity utilization, and market share, as these drive profitability.
MPC's RSI(14) is 79.8, indicating overbought conditions. The bullish MA alignment (price > MA20 > MA50 > MA200) and 0.0% proximity to its 2026 YTD high suggest sustained uptrend and potential breakout, signaling strong momentum.
Related headlines
- BP, Marathon, 7-Eleven, Walmart sued for allegedly using AI to boost California gas prices
- Marathon Petroleum Corp. to Report Second-Quarter Financial Results on August 4, 2026
- Marathon Petroleum Corp. names Brian Worthington vice president, Investor Relations; Kristina Kazarian to become vice president, Finance and Treasurer
- MPC- A US Refiner Benefitting from Tighter Jet Fuel Market
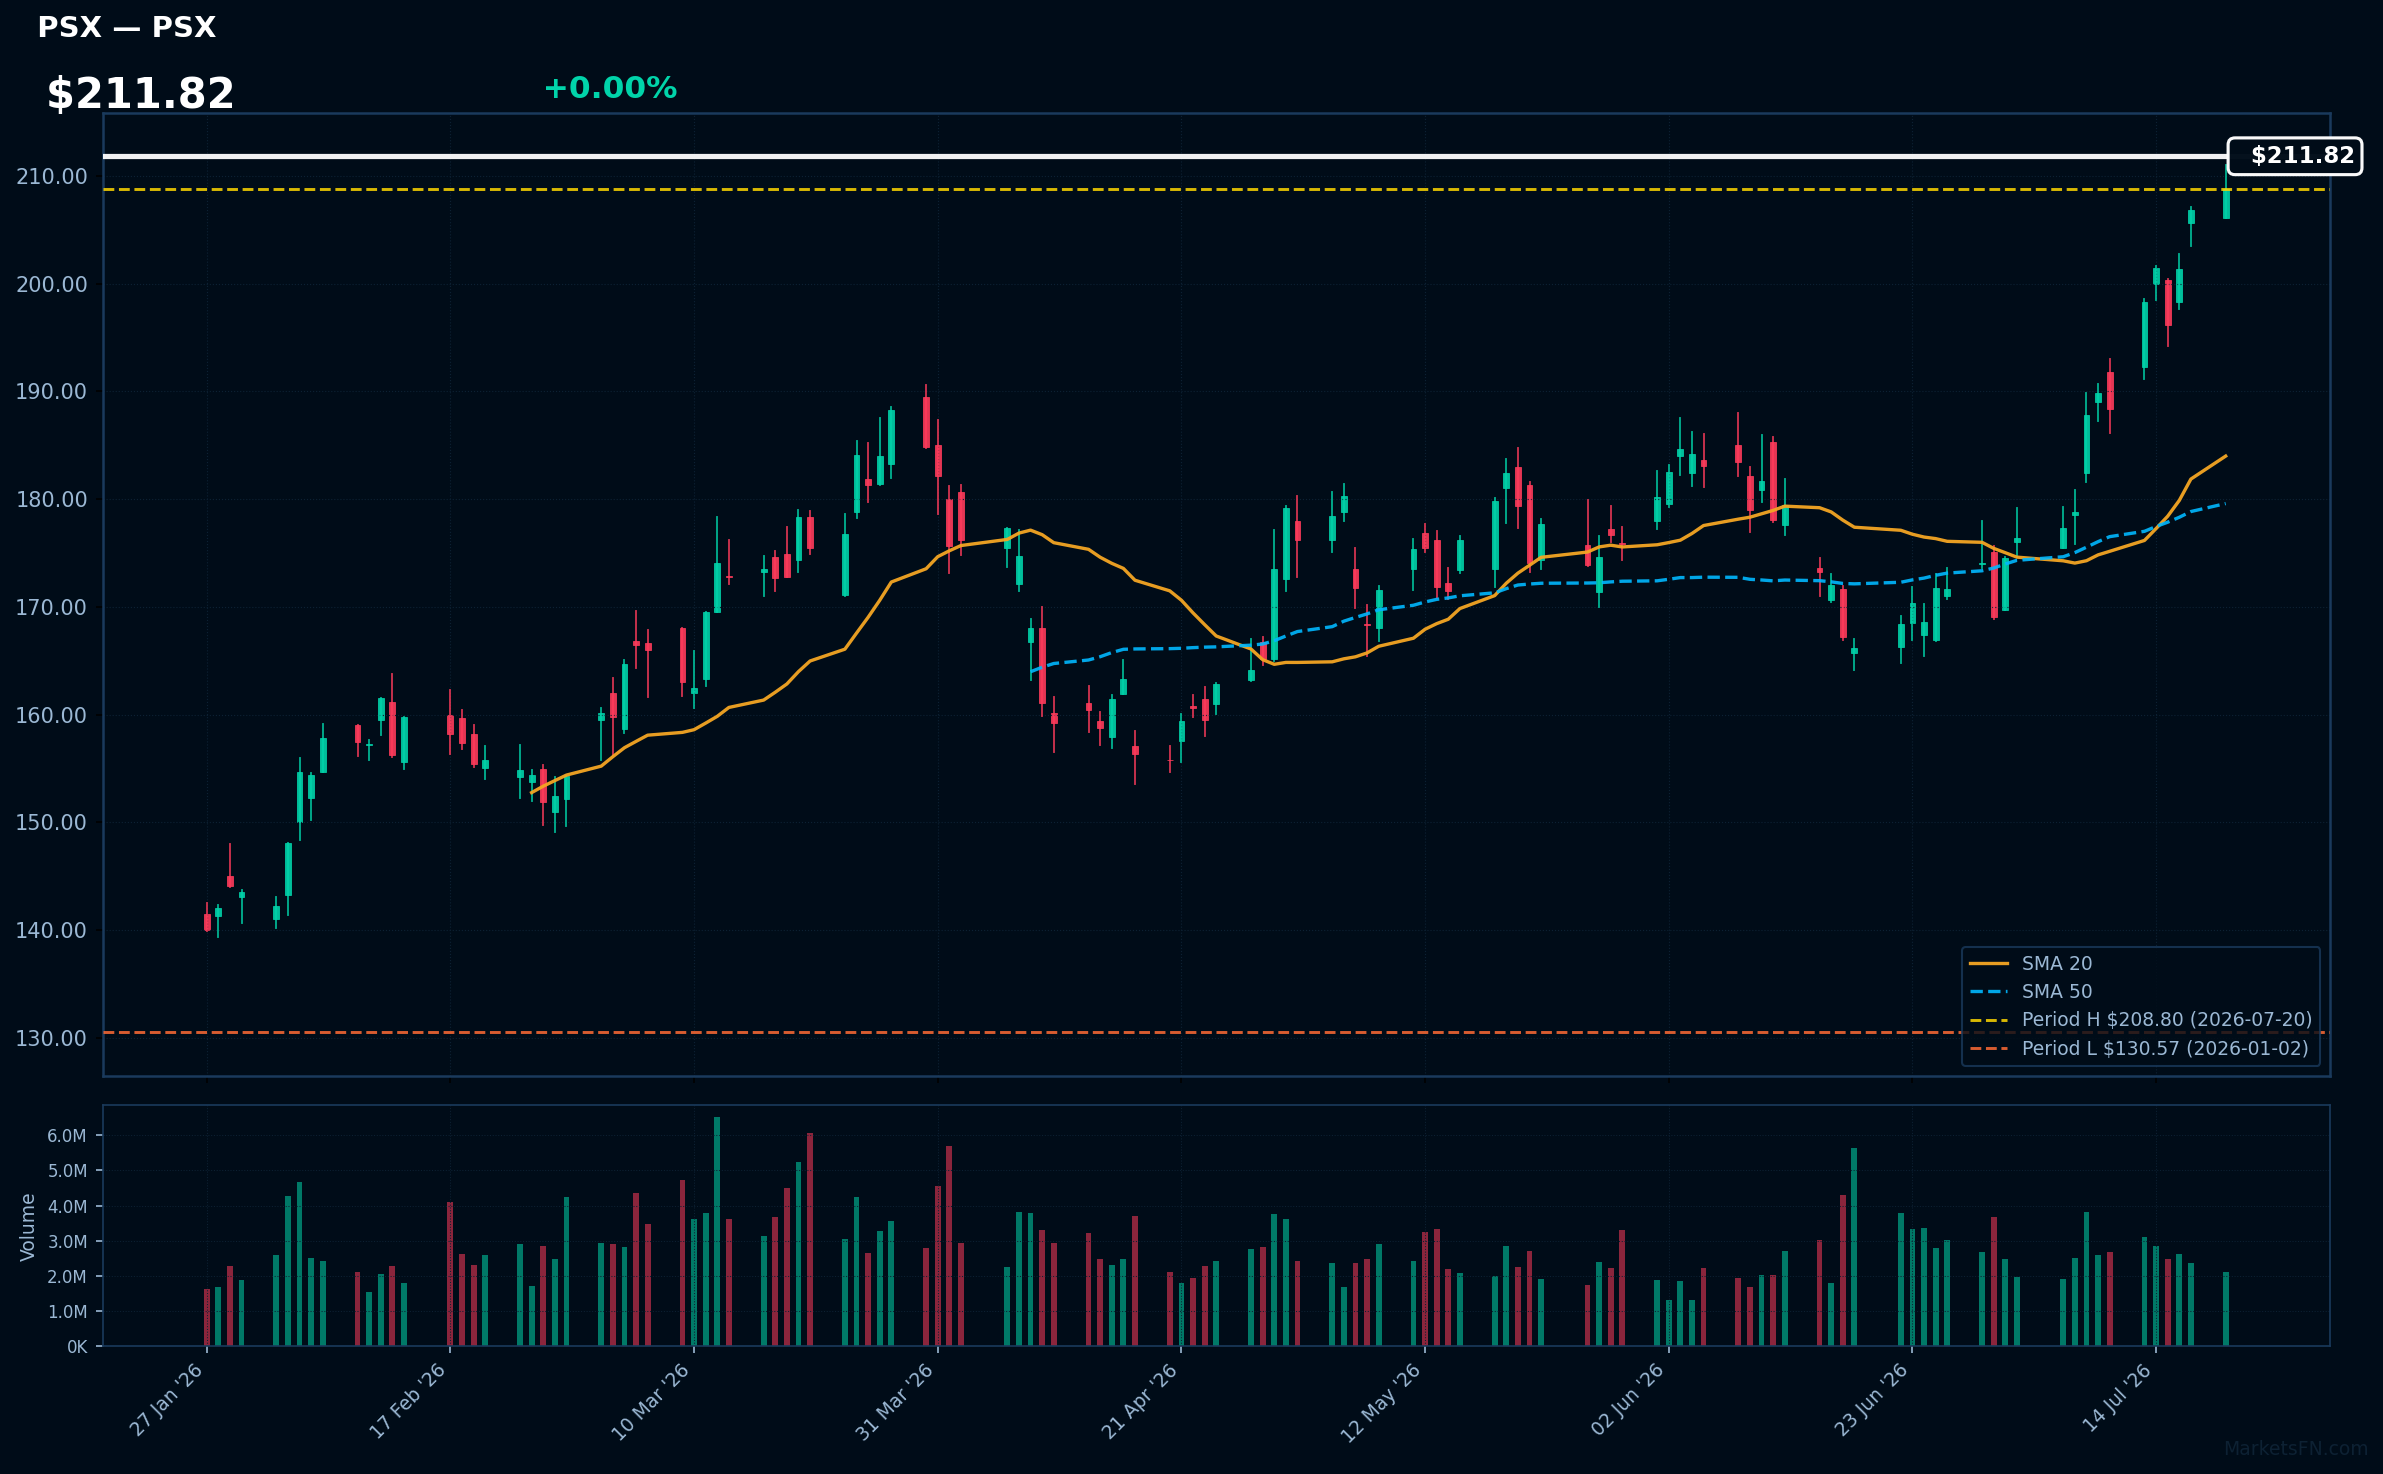
PSX | Phillips 66 | Energy | Price Last: $208.80 | % Realized: +59.91% | RSI: 75.5 | % above MA200: +33.0% | Trend: Above MA20, MA50, MA200
Phillips 66 is a diversified energy company with refining, midstream, and chemicals businesses. Investors should care about its refining margins, pipeline throughput, and chemicals demand, which drive its profitability and cash flow generation.
Phillips 66's RSI is 75.5, indicating strong momentum. With price > MA20 > MA50 > MA200 and 0.0% below its 2026 YTD high, the stock shows a sustained uptrend and potential breakout, suggesting continued momentum.
Related headlines
📉 Nearest to 2026 Low
Sectors represented: Technology (2), Communication Services (1), Consumer Cyclical (1), Basic Materials (1)
| Ticker | Company | Sector | Price Last | % Realized | 2026 YTD Low Date | RSI | % above MA200 | Trend |
|---|---|---|---|---|---|---|---|---|
| ORCL | Oracle Corp | Technology | $121.38 | -37.98% | 2026-07-20 | 30.2 | -36.1% | Below MA20, MA50, MA200 |
| NFLX | Netflix Inc | Communication Services | $67.60 | -25.71% | 2026-07-20 | 28.8 | -27.5% | Below MA20, MA50, MA200 |
| LOW | Lowe's Cos., Inc | Consumer Cyclical | $204.71 | -17.08% | 2026-07-20 | 37.8 | -14.9% | Below MA20, MA50, MA200 |
| SNPS | Synopsys, Inc | Technology | $378.46 | -21.22% | 2026-07-20 | 24.6 | -16.5% | Below MA20, MA50, MA200 |
| NEM | Newmont Corp | Basic Materials | $89.20 | -11.88% | 2026-07-20 | 41.1 | -14.2% | Below MA20, MA50, MA200 |
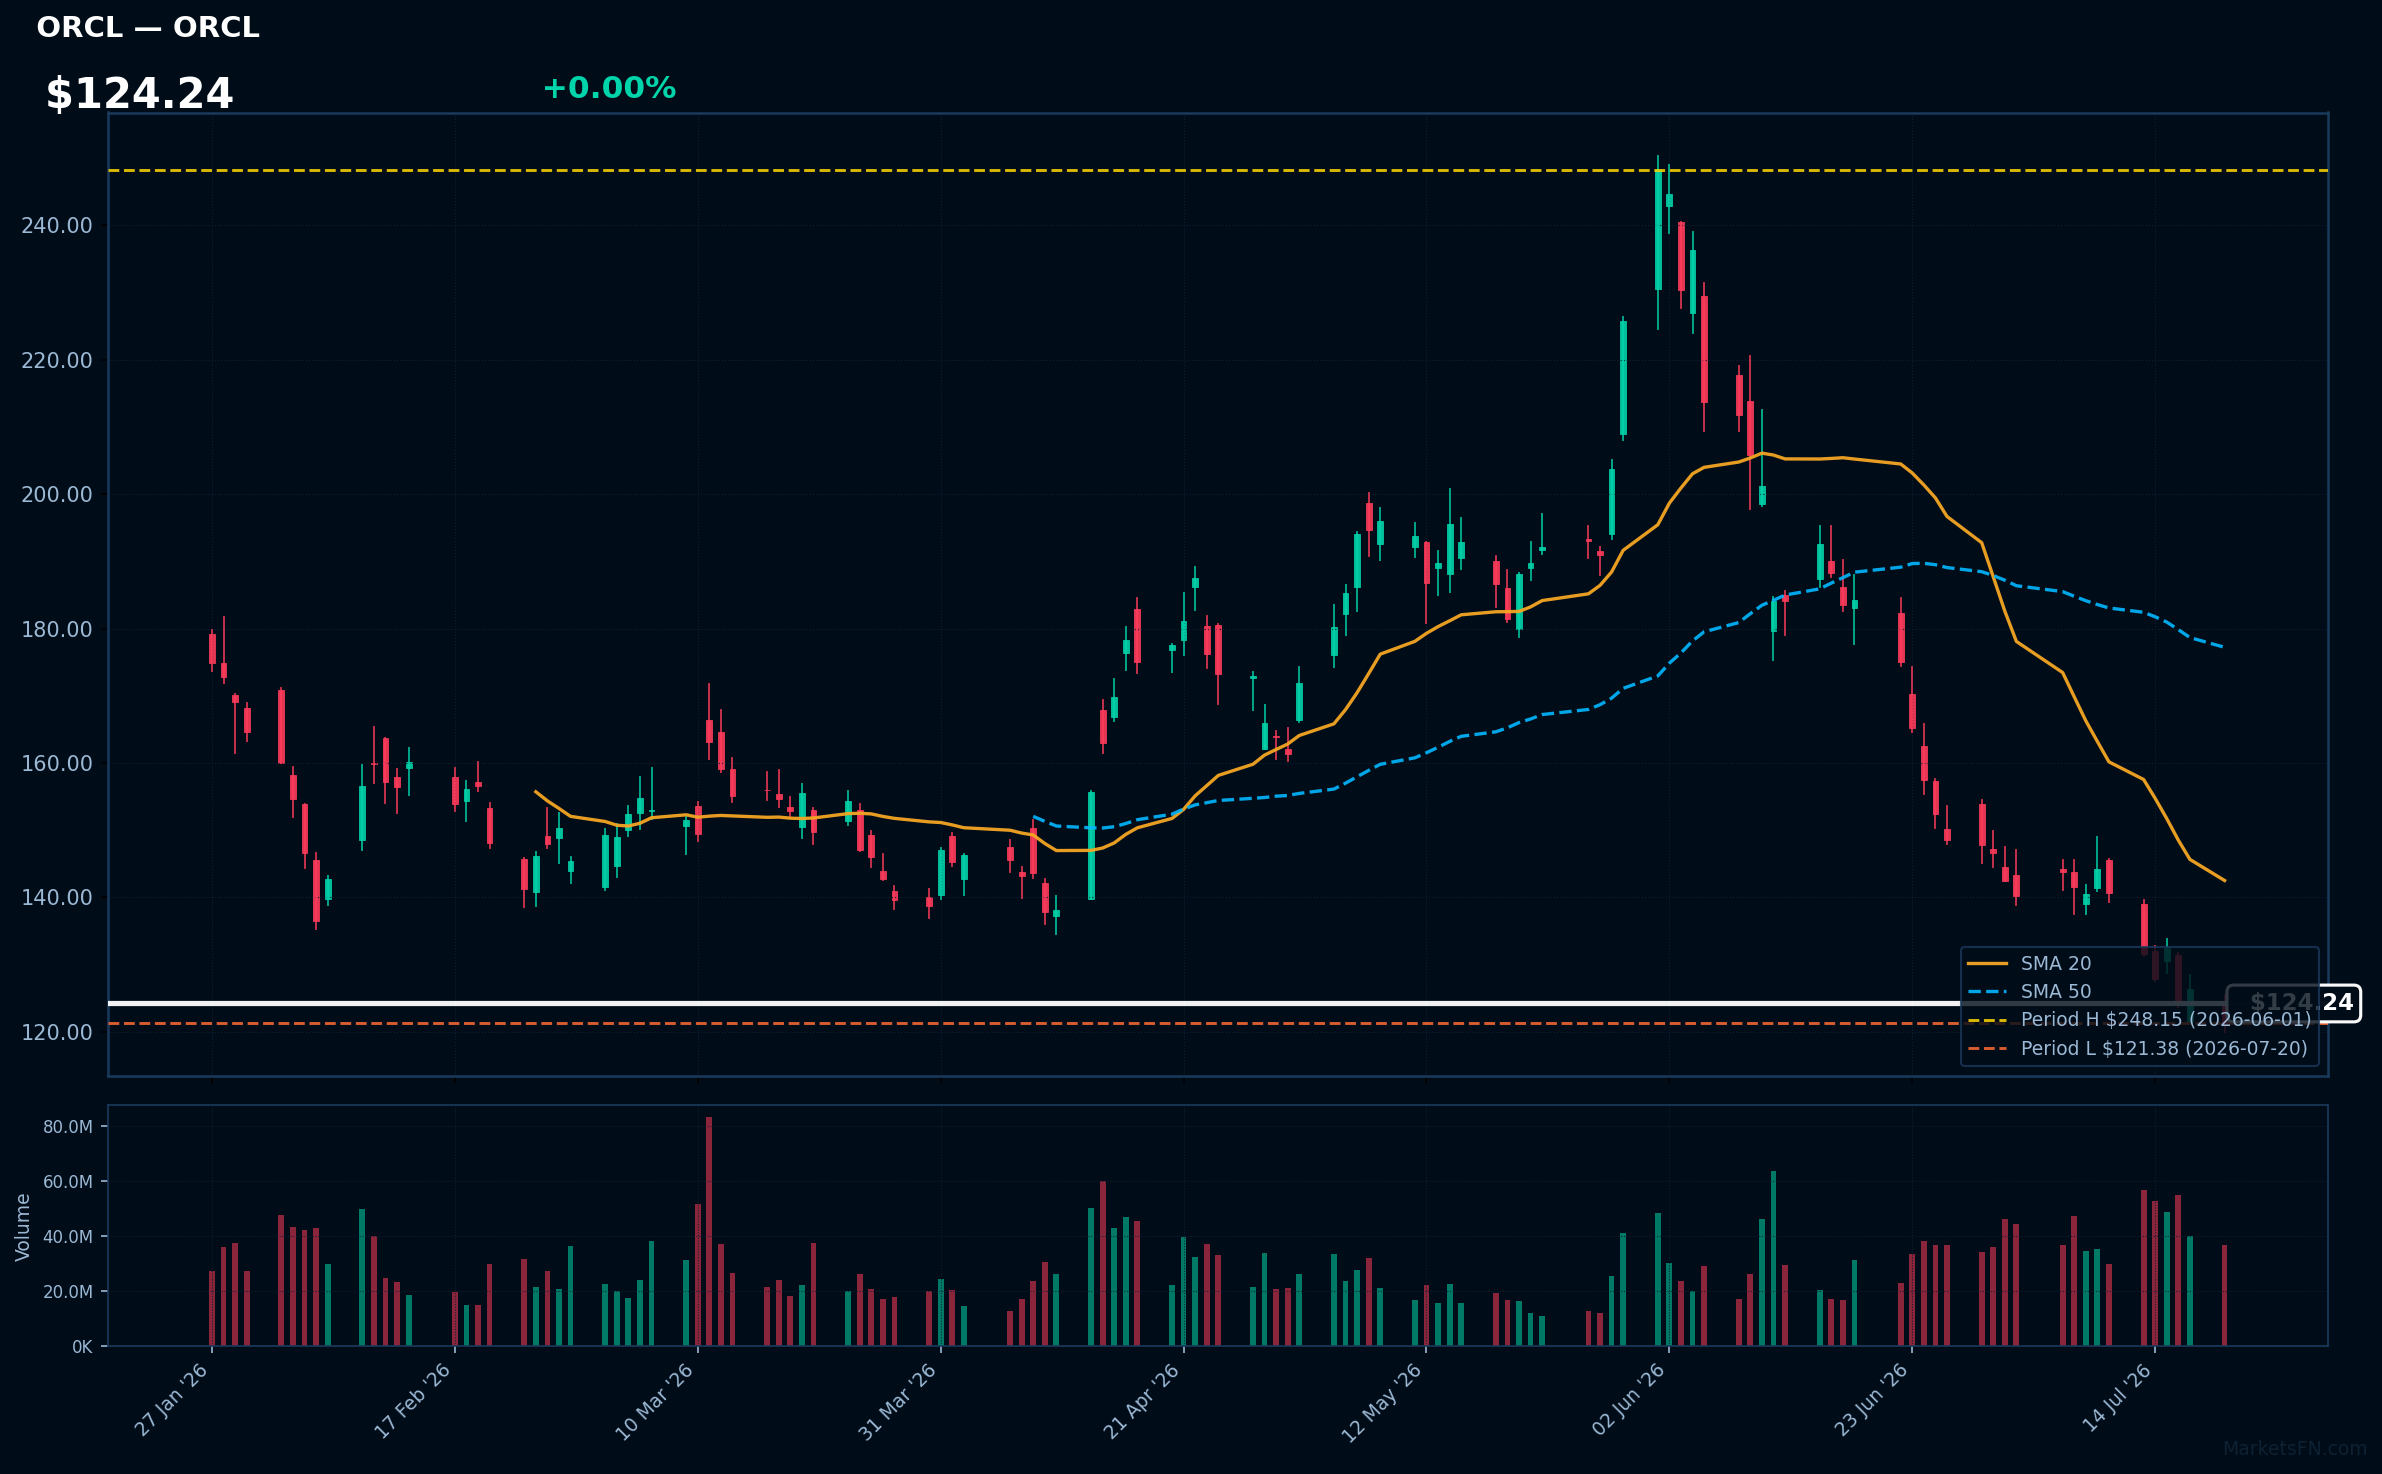
ORCL | Oracle Corp | Technology | Price Last: $121.38 | % Realized: -37.98% | RSI: 30.2 | % above MA200: -36.1% | Trend: Below MA20, MA50, MA200
Oracle Corp is a cloud computing and enterprise software company, providing database management, ERP, and customer relationship management solutions. Investors should care about its transition to cloud services and its ability to compete with Amazon and Microsoft.
Oracle Corp's technical situation is bearish, with an RSI(14) of 30.2 indicating oversold conditions, and a sustained downtrend (price < MA20 < MA50 < MA200). The stock is testing major support at its 2026 YTD low, having fallen 38.0% YTD.
Related headlines
- Oracle Faces $7 Billion Data Center Collateral Hit
- ORCL, BE, HUT, Or IREN: Retail Investors Are Split Between Two Data Center Stocks Despite Diverging Returns
- Oracle faces potential $7 billion guarantee requirement for Wisconsin AI data centre (ORCL)
- PSKY, ORCL, TLRY Stocks Hit 52-Week Lows Today: What's Driving The Selloff?
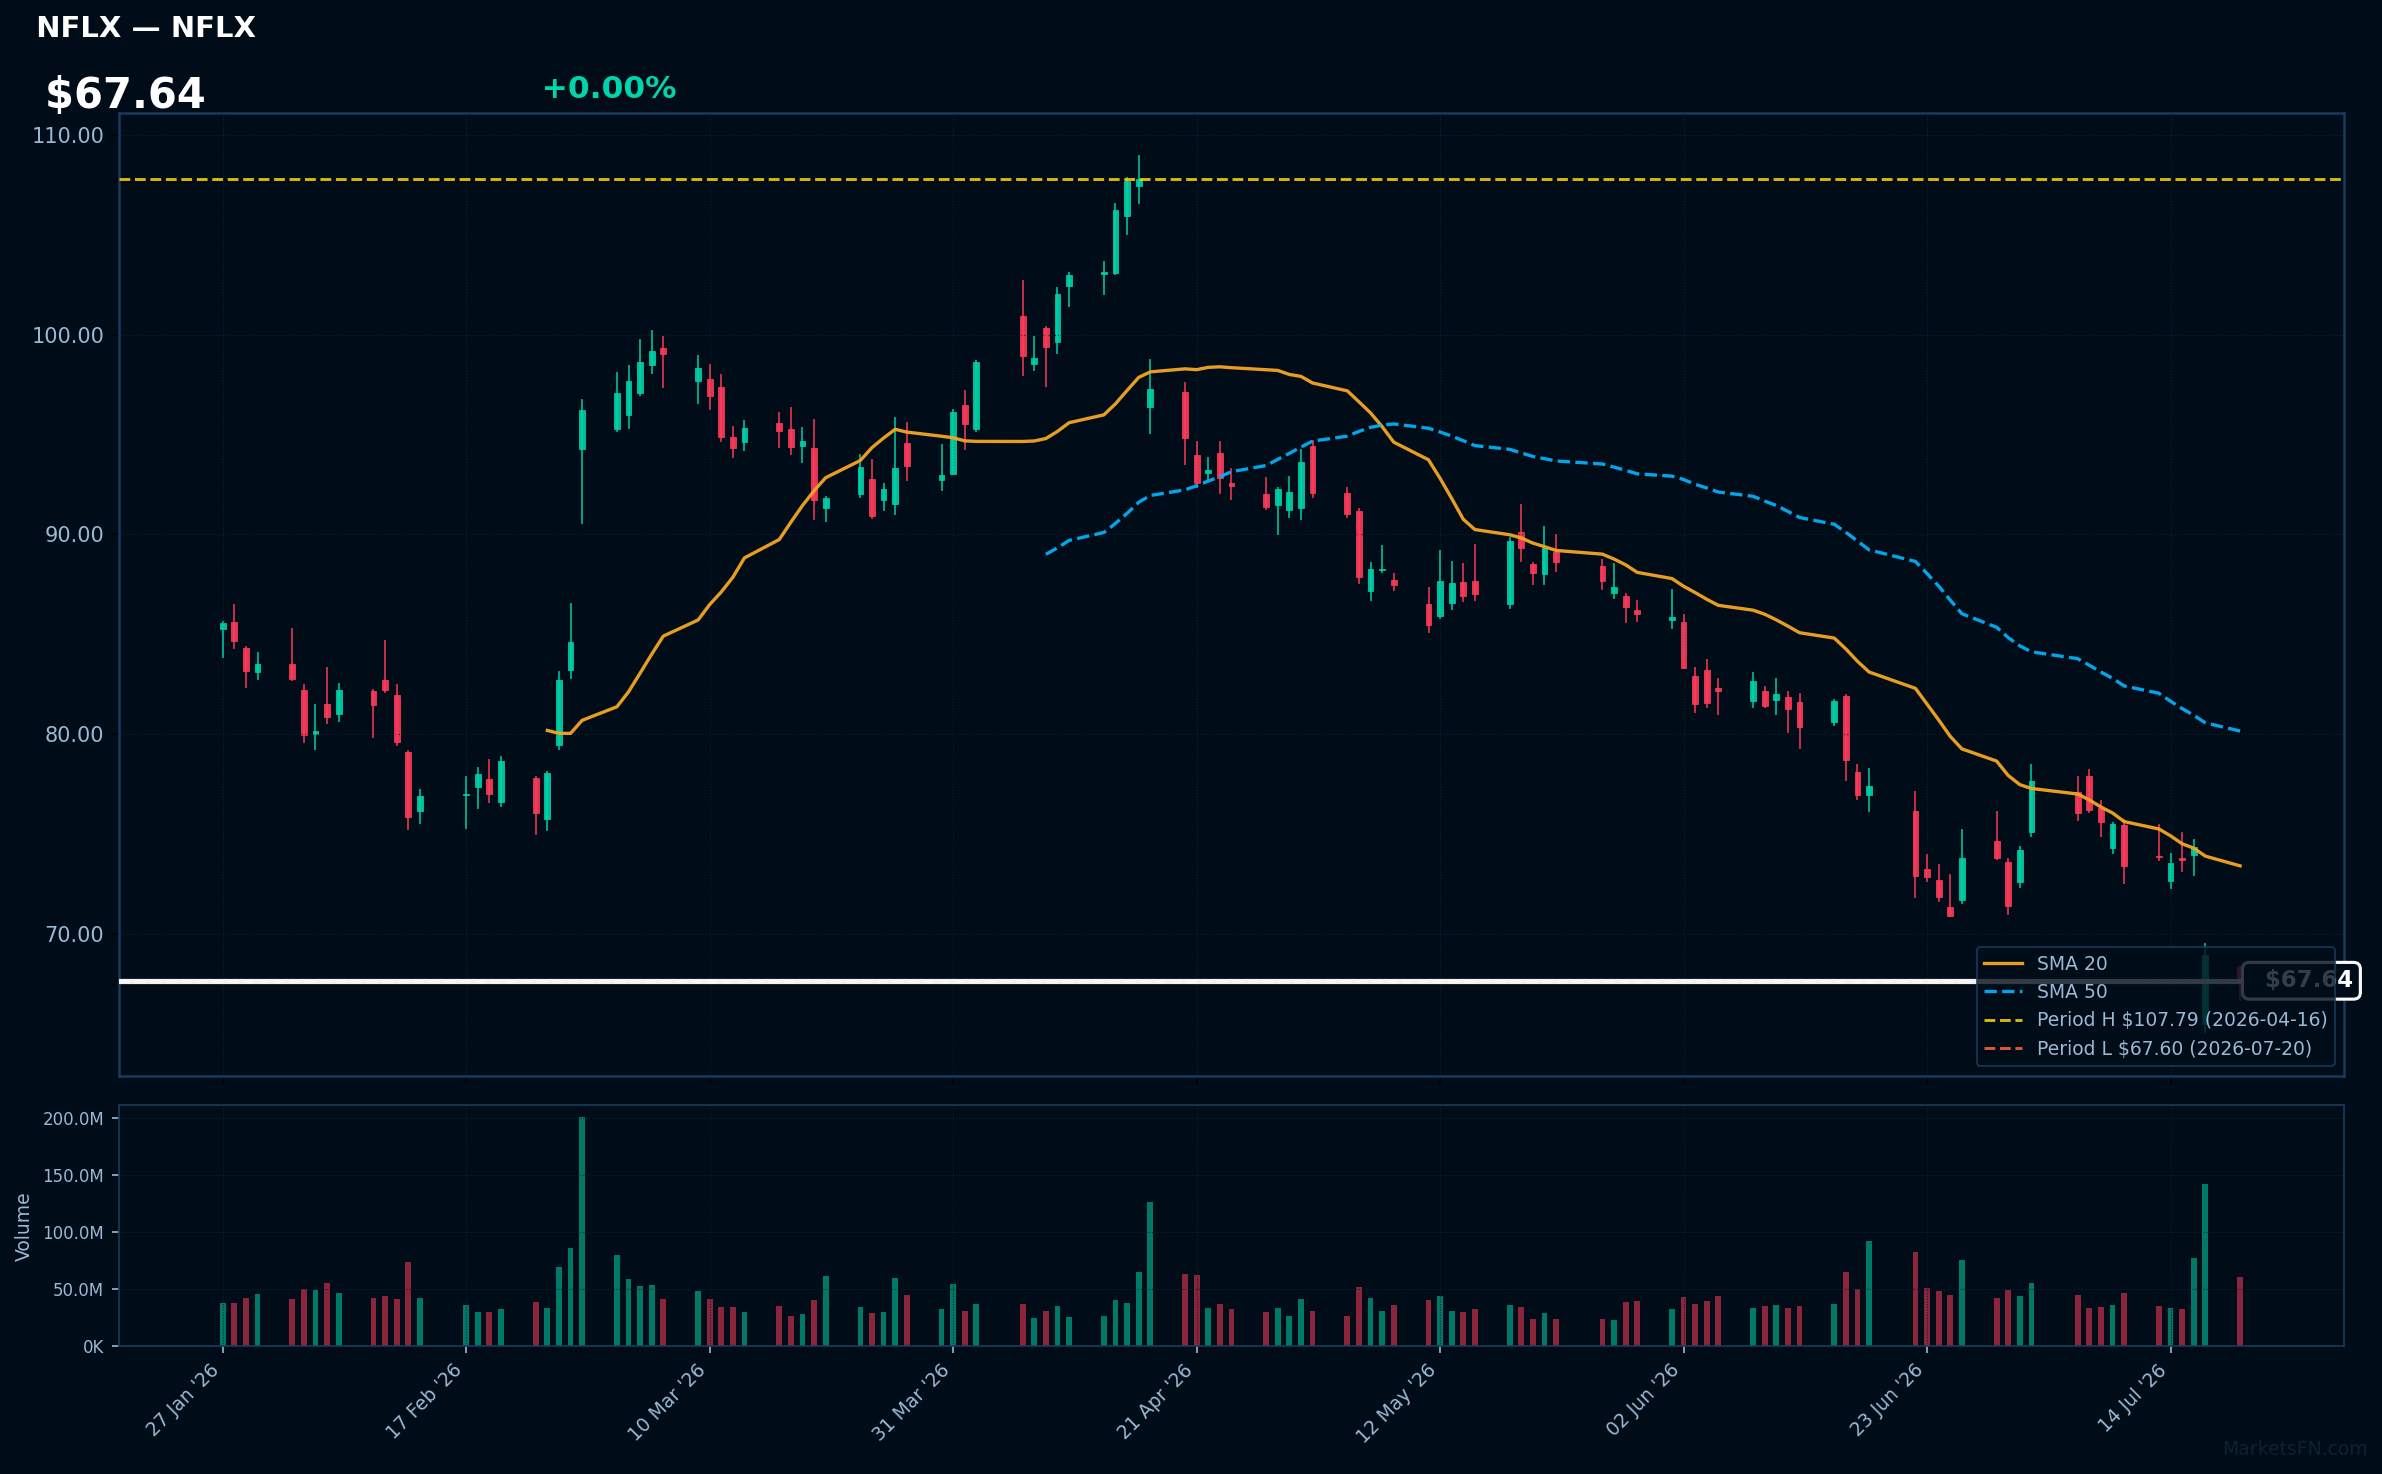
NFLX | Netflix Inc | Communication Services | Price Last: $67.60 | % Realized: -25.71% | RSI: 28.8 | % above MA200: -27.5% | Trend: Below MA20, MA50, MA200
Netflix Inc is a streaming giant providing entertainment content globally. Investors care about its subscriber growth, content pipeline, and pricing power, which drive revenue and profitability. Its dominance in the streaming market and ability to produce original content are key factors.
NFLX is in a sustained downtrend with price ($67.64) below MA20, MA50, and MA200. The RSI(14) is 28.8, near oversold territory. Testing its 2026 YTD low at 0.0% above, indicating major support level. This technical setup is a warning sign.
Related headlines
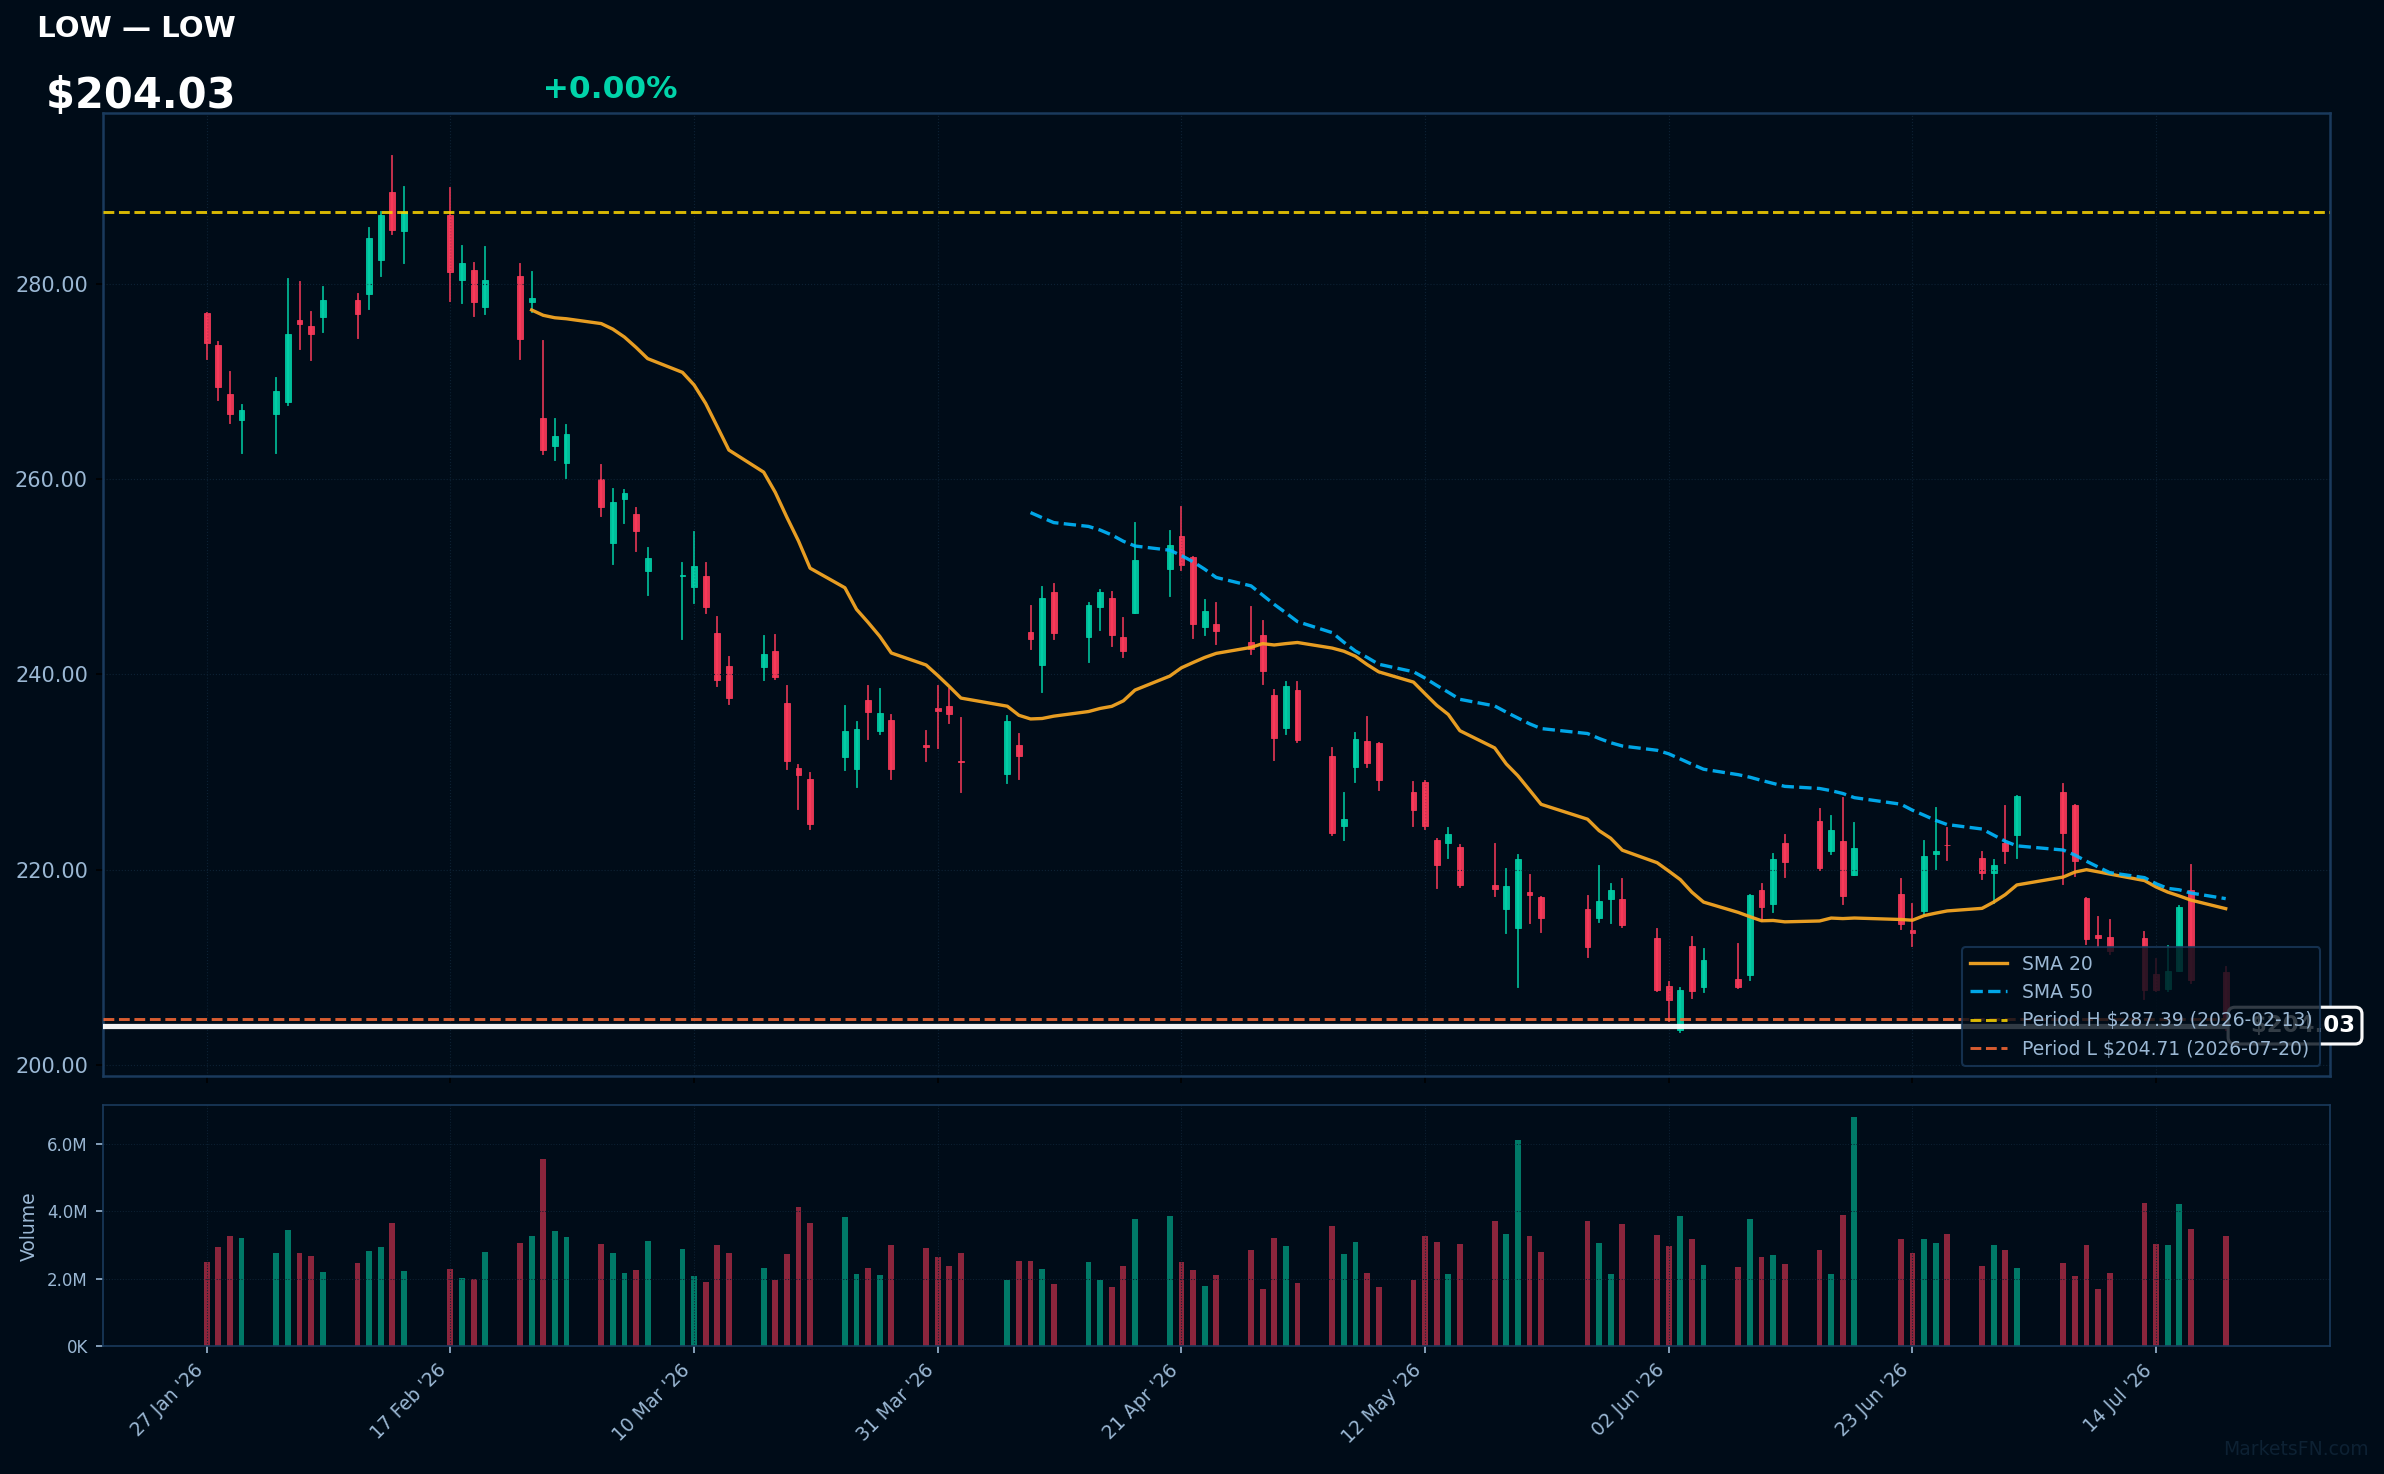
LOW | Lowe's Cos., Inc | Consumer Cyclical | Price Last: $204.71 | % Realized: -17.08% | RSI: 37.8 | % above MA200: -14.9% | Trend: Below MA20, MA50, MA200
Lowe's Cos., Inc is a home improvement retailer operating over 1,700 stores across North America, offering products for construction, renovation, and maintenance. Investors should care about its performance as it reflects housing market trends and consumer spending habits.
Lowe's is testing major support with its price 0.0% above its 2026 YTD low. The RSI(14) is 37.8, indicating bearish momentum, and the MA alignment is bearish with price < MA20 < MA50 < MA200, signaling a sustained downtrend.
Related headlines
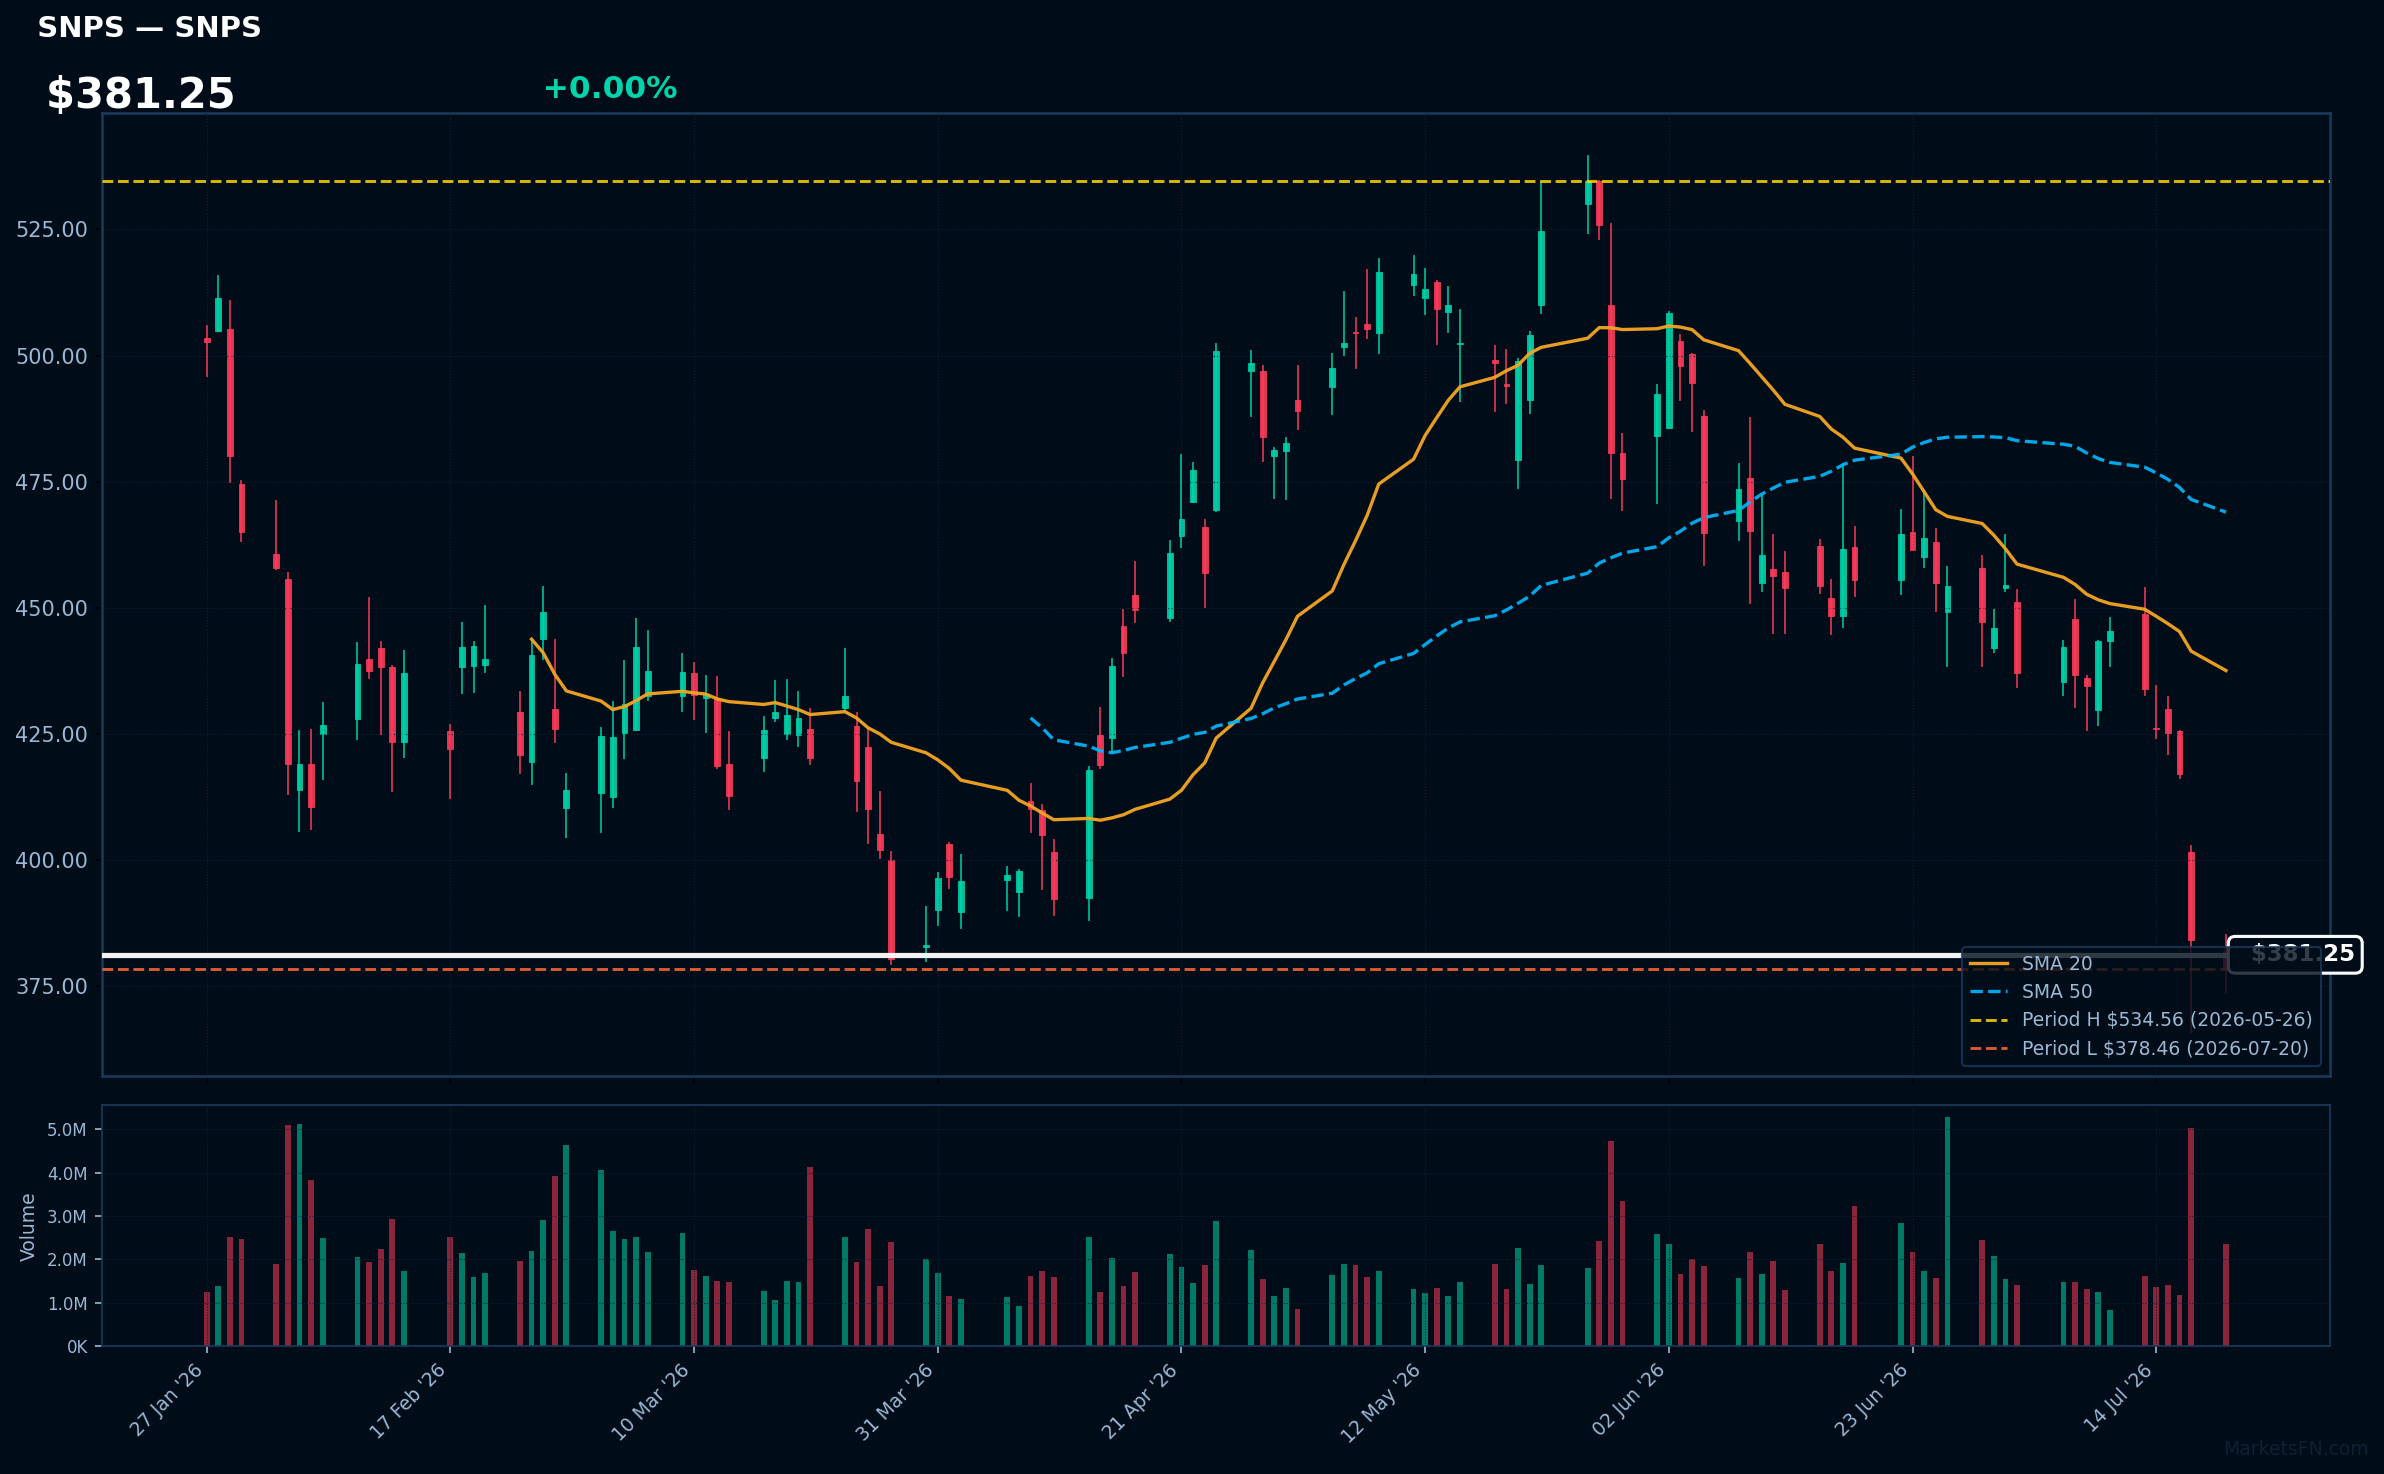
SNPS | Synopsys, Inc | Technology | Price Last: $378.46 | % Realized: -21.22% | RSI: 24.6 | % above MA200: -16.5% | Trend: Below MA20, MA50, MA200
Synopsys, Inc (SNPS) is a software company providing electronic design automation (EDA) tools and semiconductor IP, crucial for chip design and manufacturing. Investors care due to its dominant position in the growing semiconductor industry.
SNPS is testing major support with its price 0.0% above 2026 YTD low. RSI(14) is 24.6, indicating oversold conditions. MA alignment shows mixed signals with the stock below MA20, MA50, and MA200, suggesting a warning sign.
Related headlines
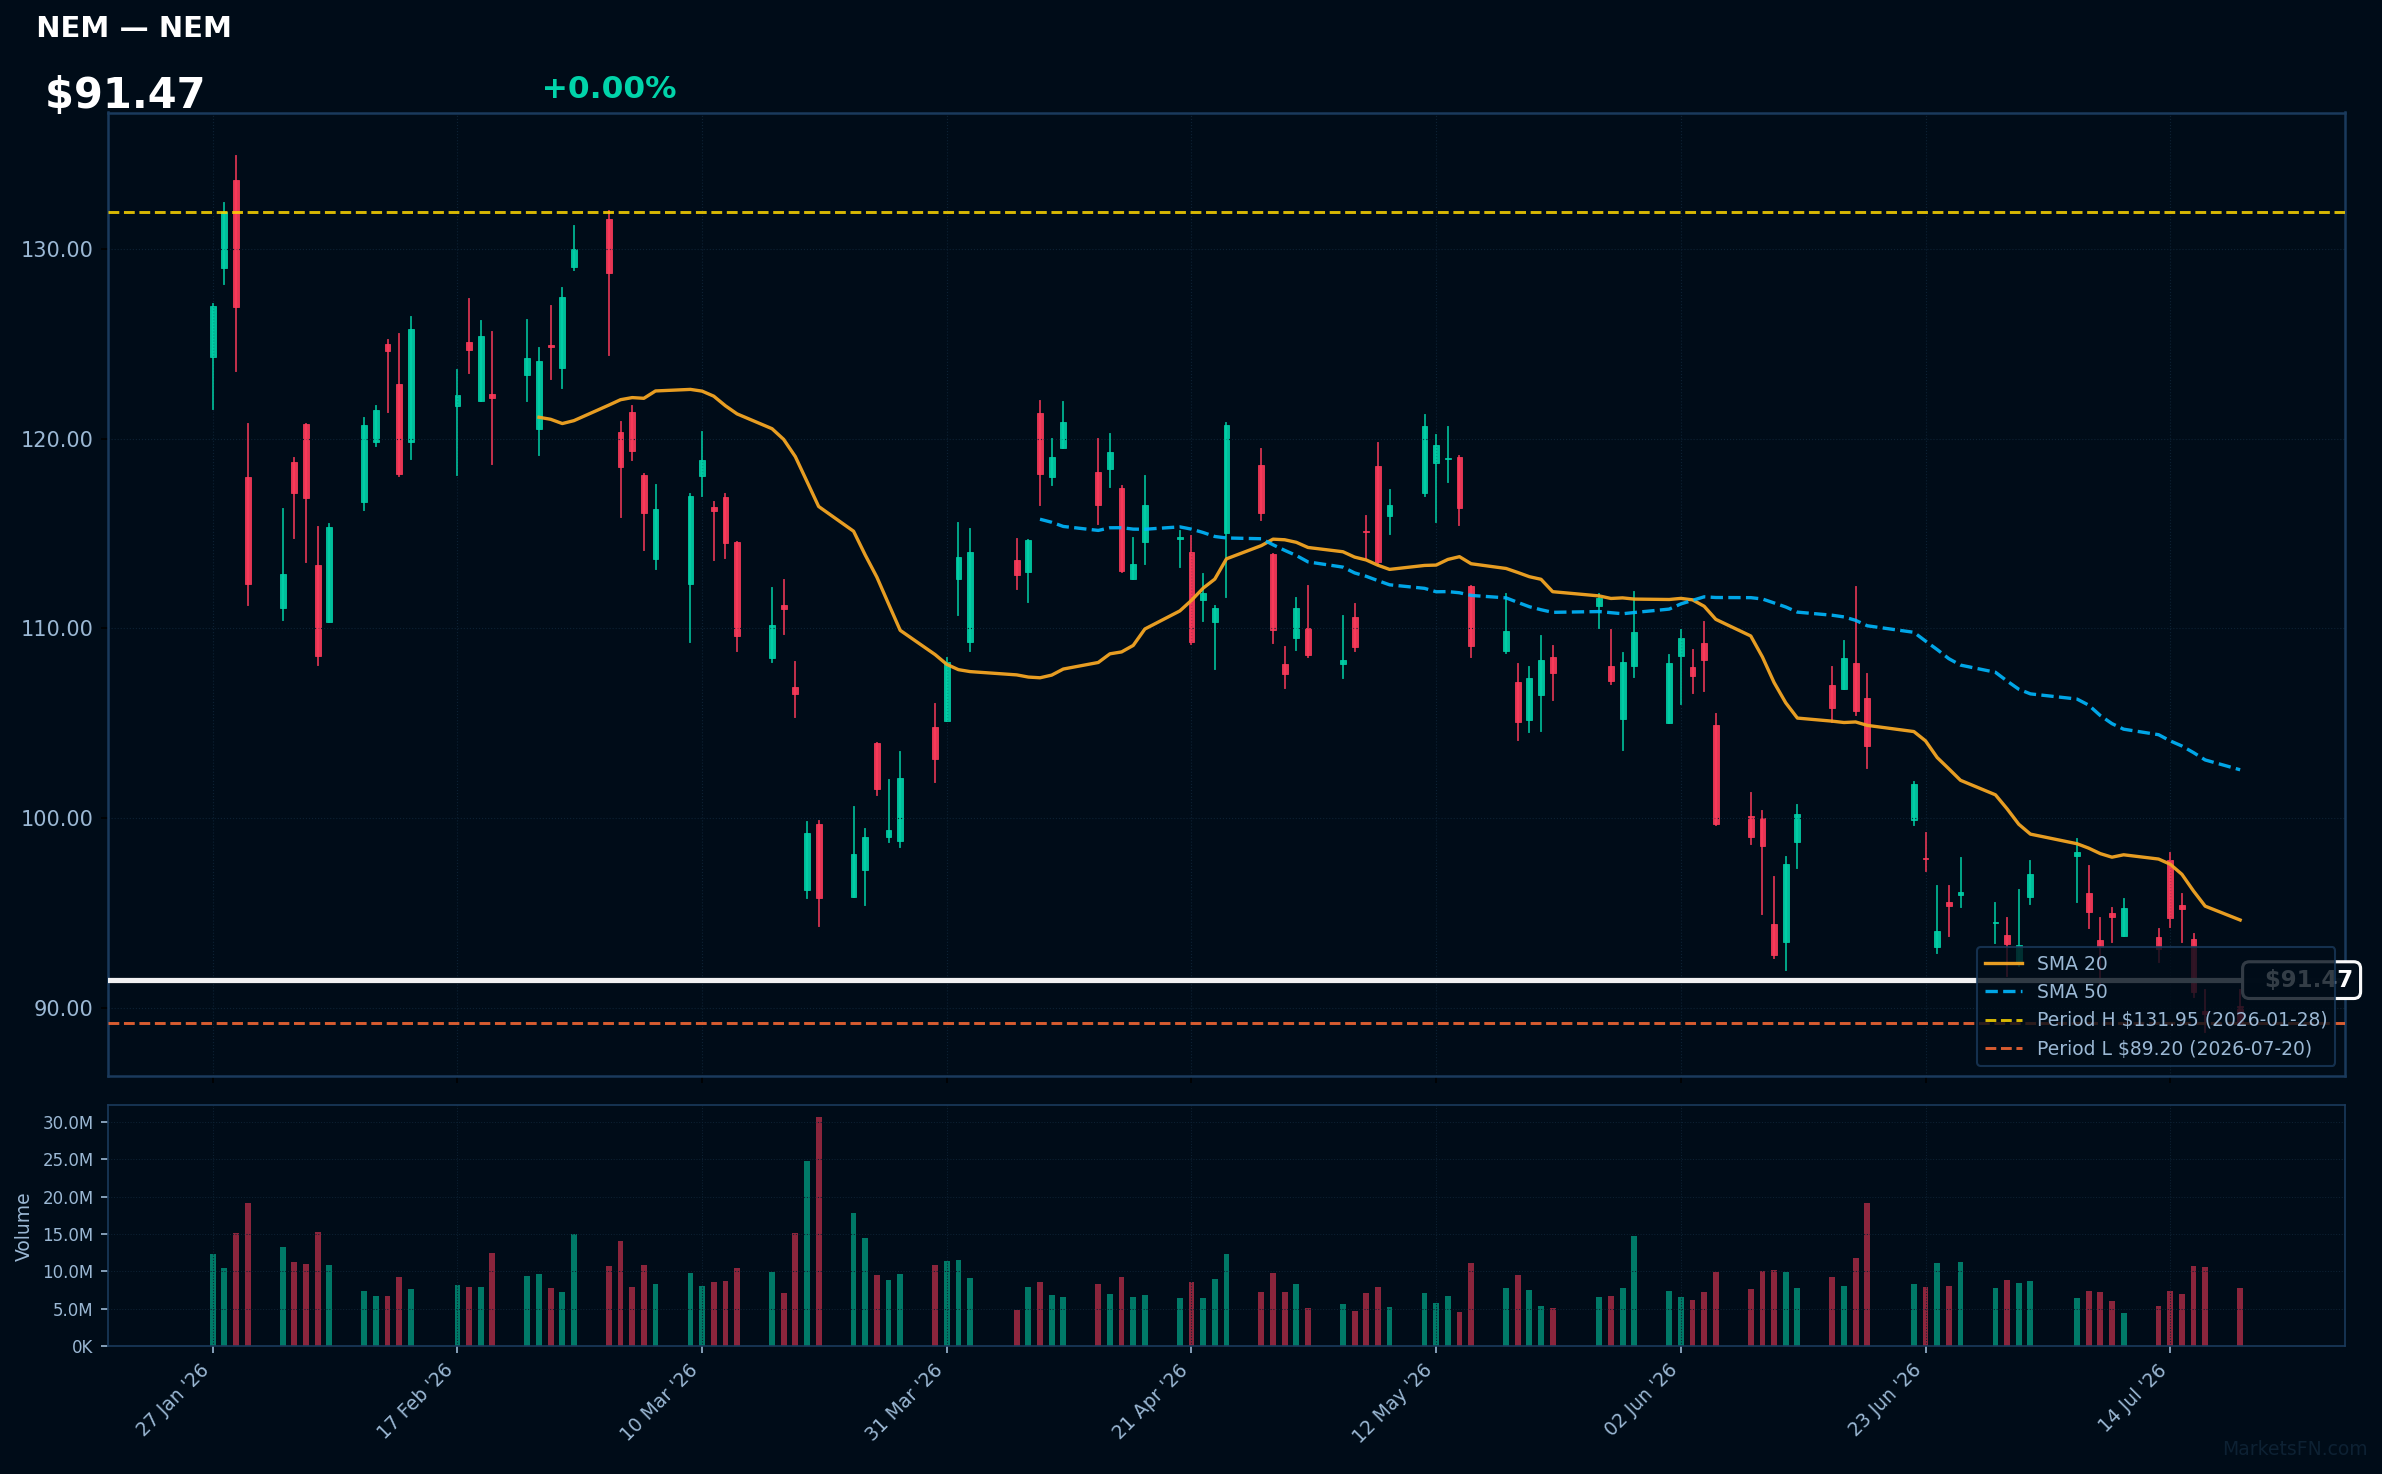
NEM | Newmont Corp | Basic Materials | Price Last: $89.20 | % Realized: -11.88% | RSI: 41.1 | % above MA200: -14.2% | Trend: Below MA20, MA50, MA200
Newmont Corp is a gold mining company. Investors should care because its stock performance is tied to gold prices and the company's operational efficiency in extracting gold. Specific details about its operations and gold reserves would be relevant, but are not provided in the given data.
Newmont Corp's current technical situation indicates a sustained downtrend with price ($91.47) below MA20, MA50, and MA200. The RSI(14) is 41.1, and the stock is 0.0% above its 2026 YTD low, suggesting a potential support test, which could be a warning sign.
Related headlines
Market Commentary
The S&P 500 stocks listed are currently trading near their year-to-date (YTD) extremes as of 2026. Stocks near their YTD highs include Welltower Inc. (WELL), Altria Group Inc. (MO), and CVS Health Corp. (CVS), all of which are at their 2026 highs. Conversely, Oracle Corp. (ORCL), Netflix Inc. (NFLX), and Lowe's Cos., Inc. (LOW) are at their 2026 lows.
The stocks near their 2026 highs are primarily from the real estate and energy sectors, indicating potential strength in these areas. In contrast, the stocks near their 2026 lows are from technology and consumer discretionary sectors, suggesting challenges in these segments. The divergence may be driven by sector-specific factors, such as changes in interest rates, commodity prices, or consumer behavior.
Investors should monitor sector trends, earnings reports, and macroeconomic indicators to gauge the sustainability of these trends. As the year progresses, changes in the composition of stocks near their YTD extremes may signal shifts in market sentiment and emerging opportunities or risks. Tracking these developments can help investors make informed decisions.
Methodology: All 503 S&P 500 constituents screened. Close prices downloaded from 2026-01-01. Period high = highest close since Jan 1 2026; period low = lowest close since Jan 1 2026. Distance = (current price / period extreme − 1) × 100. Technical indicators computed on up to 1 year of daily OHLCV data.
Disclaimer: For informational purposes only. Not investment advice. Past performance is not indicative of future results.