S&P 500 52-Week Highs & Lows Radar: Alphabet (GOOG), McDonald's (MCD) and more
· market-analysis · MarketsFN Team
S&P 500 52-Week Highs & Lows Radar: Alphabet (GOOG), McDonald's (MCD) and more
Screening all 503 S&P 500 constituents for stocks nearest to their 52-week high and their 52-week low. Data as of May 07, 2026. % Realized = 52-week total return.
Legend: RSI > 70 = overbought · RSI < 30 = oversold · Green % Realized = positive 52W return · Red = negative.
📈 Nearest to 52-Week High
Sectors represented: Technology (2), Communication Services (1), Healthcare (1), Industrials (1)
| Ticker | Company | Sector | Price Last | % Realized | 52-Week High Date | RSI | % above MA200 | Trend |
|---|---|---|---|---|---|---|---|---|
| GOOG | Alphabet Inc | Communication Services | $395.30 | +153.80% | 2026-05-07 | 82.9 | +38.6% | Above MA20, MA50, MA200 |
| QCOM | Qualcomm, Inc | Technology | $202.55 | +39.59% | 2026-05-07 | 82.6 | +28.7% | Above MA20, MA50, MA200 |
| CVS | CVS Health Corp | Healthcare | $87.36 | +28.75% | 2026-05-07 | 70.1 | +14.9% | Above MA20, MA50, MA200 |
| HWM | Howmet Aerospace Inc | Industrials | $272.54 | +73.04% | 2026-05-07 | 68.3 | +28.9% | Above MA20, MA50, MA200 |
| GLW | Corning, Inc | Technology | $182.40 | +304.88% | 2026-05-07 | 64.6 | +77.8% | Above MA20, MA50, MA200 |
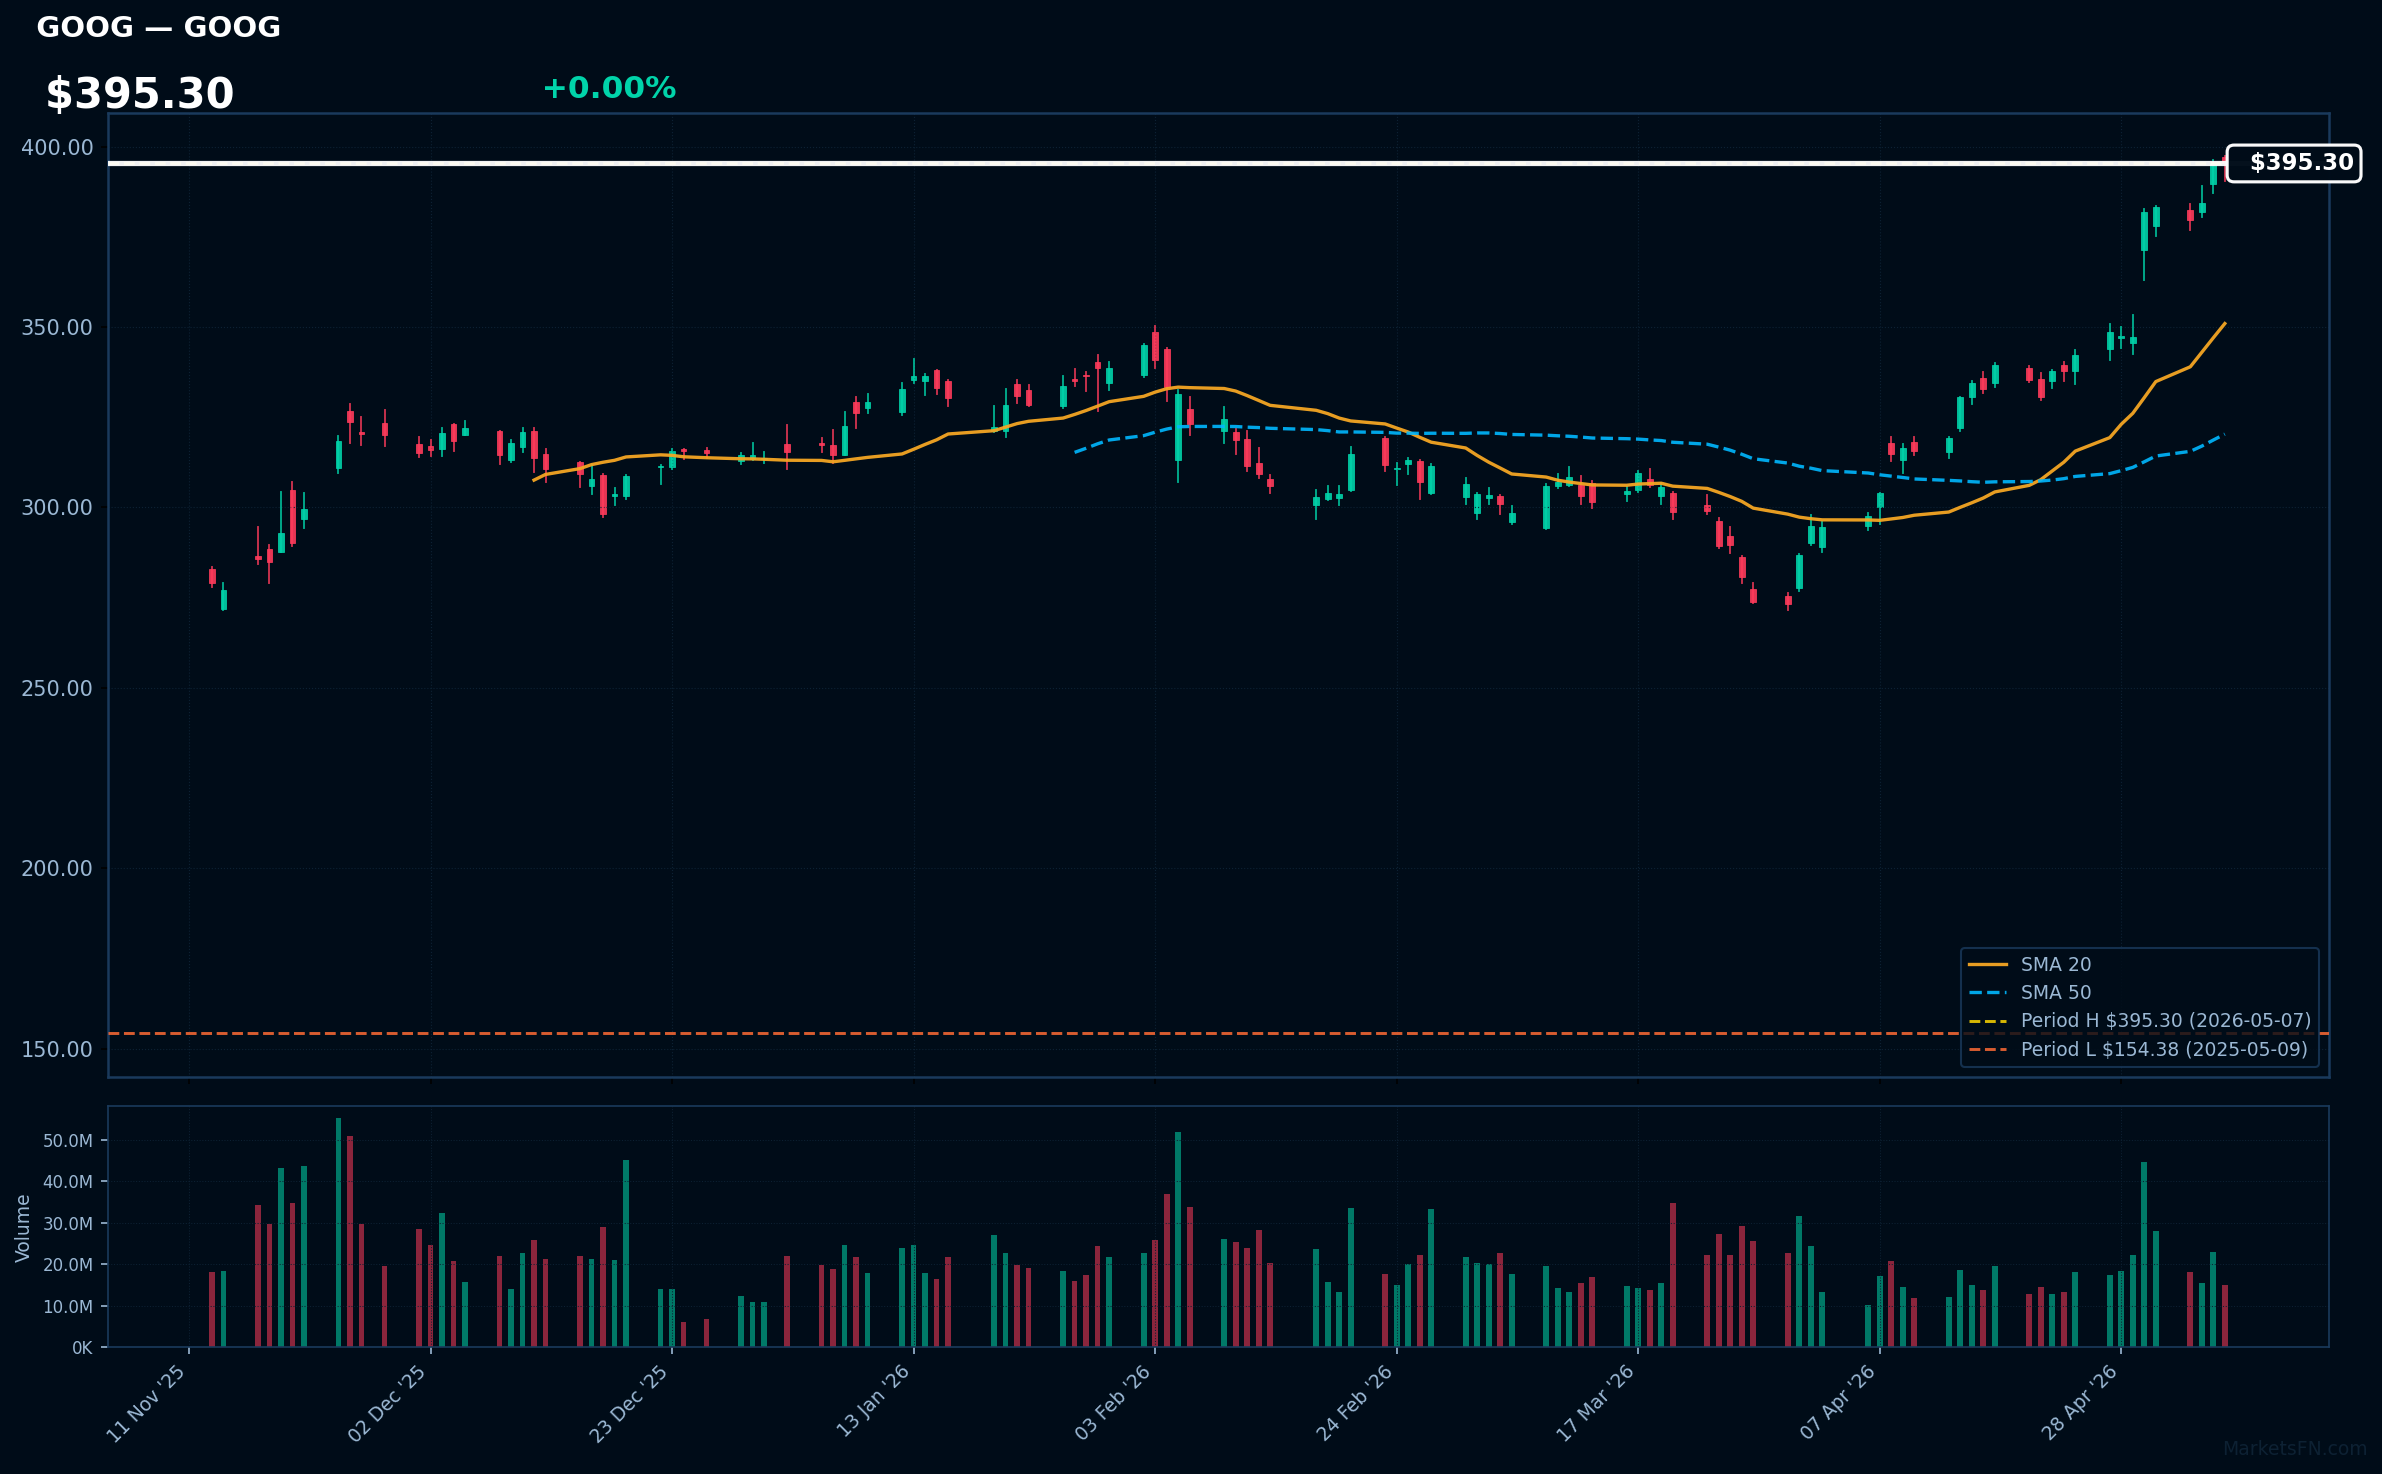
GOOG | Alphabet Inc | Communication Services | Price Last: $395.30 | % Realized: +153.80% | RSI: 82.9 | % above MA200: +38.6% | Trend: Above MA20, MA50, MA200
Alphabet Inc., Google's parent, operates the dominant Google Search for ad revenue, Google Cloud for computing services, and ventures in AI, hardware like Pixel phones, and self-driving tech via Waymo. Investors should care due to its advertising monopoly, AI leadership, and high-growth cloud sector driving substantial profits.
Alphabet's stock, at RSI 82.9 (overbought), shows bullish MA alignment and sits 0.0% below its 52-week high with 153.8% yearly gains, indicating strong momentum. This reflects fundamental tech strength, but high RSI warns of potential correction despite nearing record levels.
Related headlines
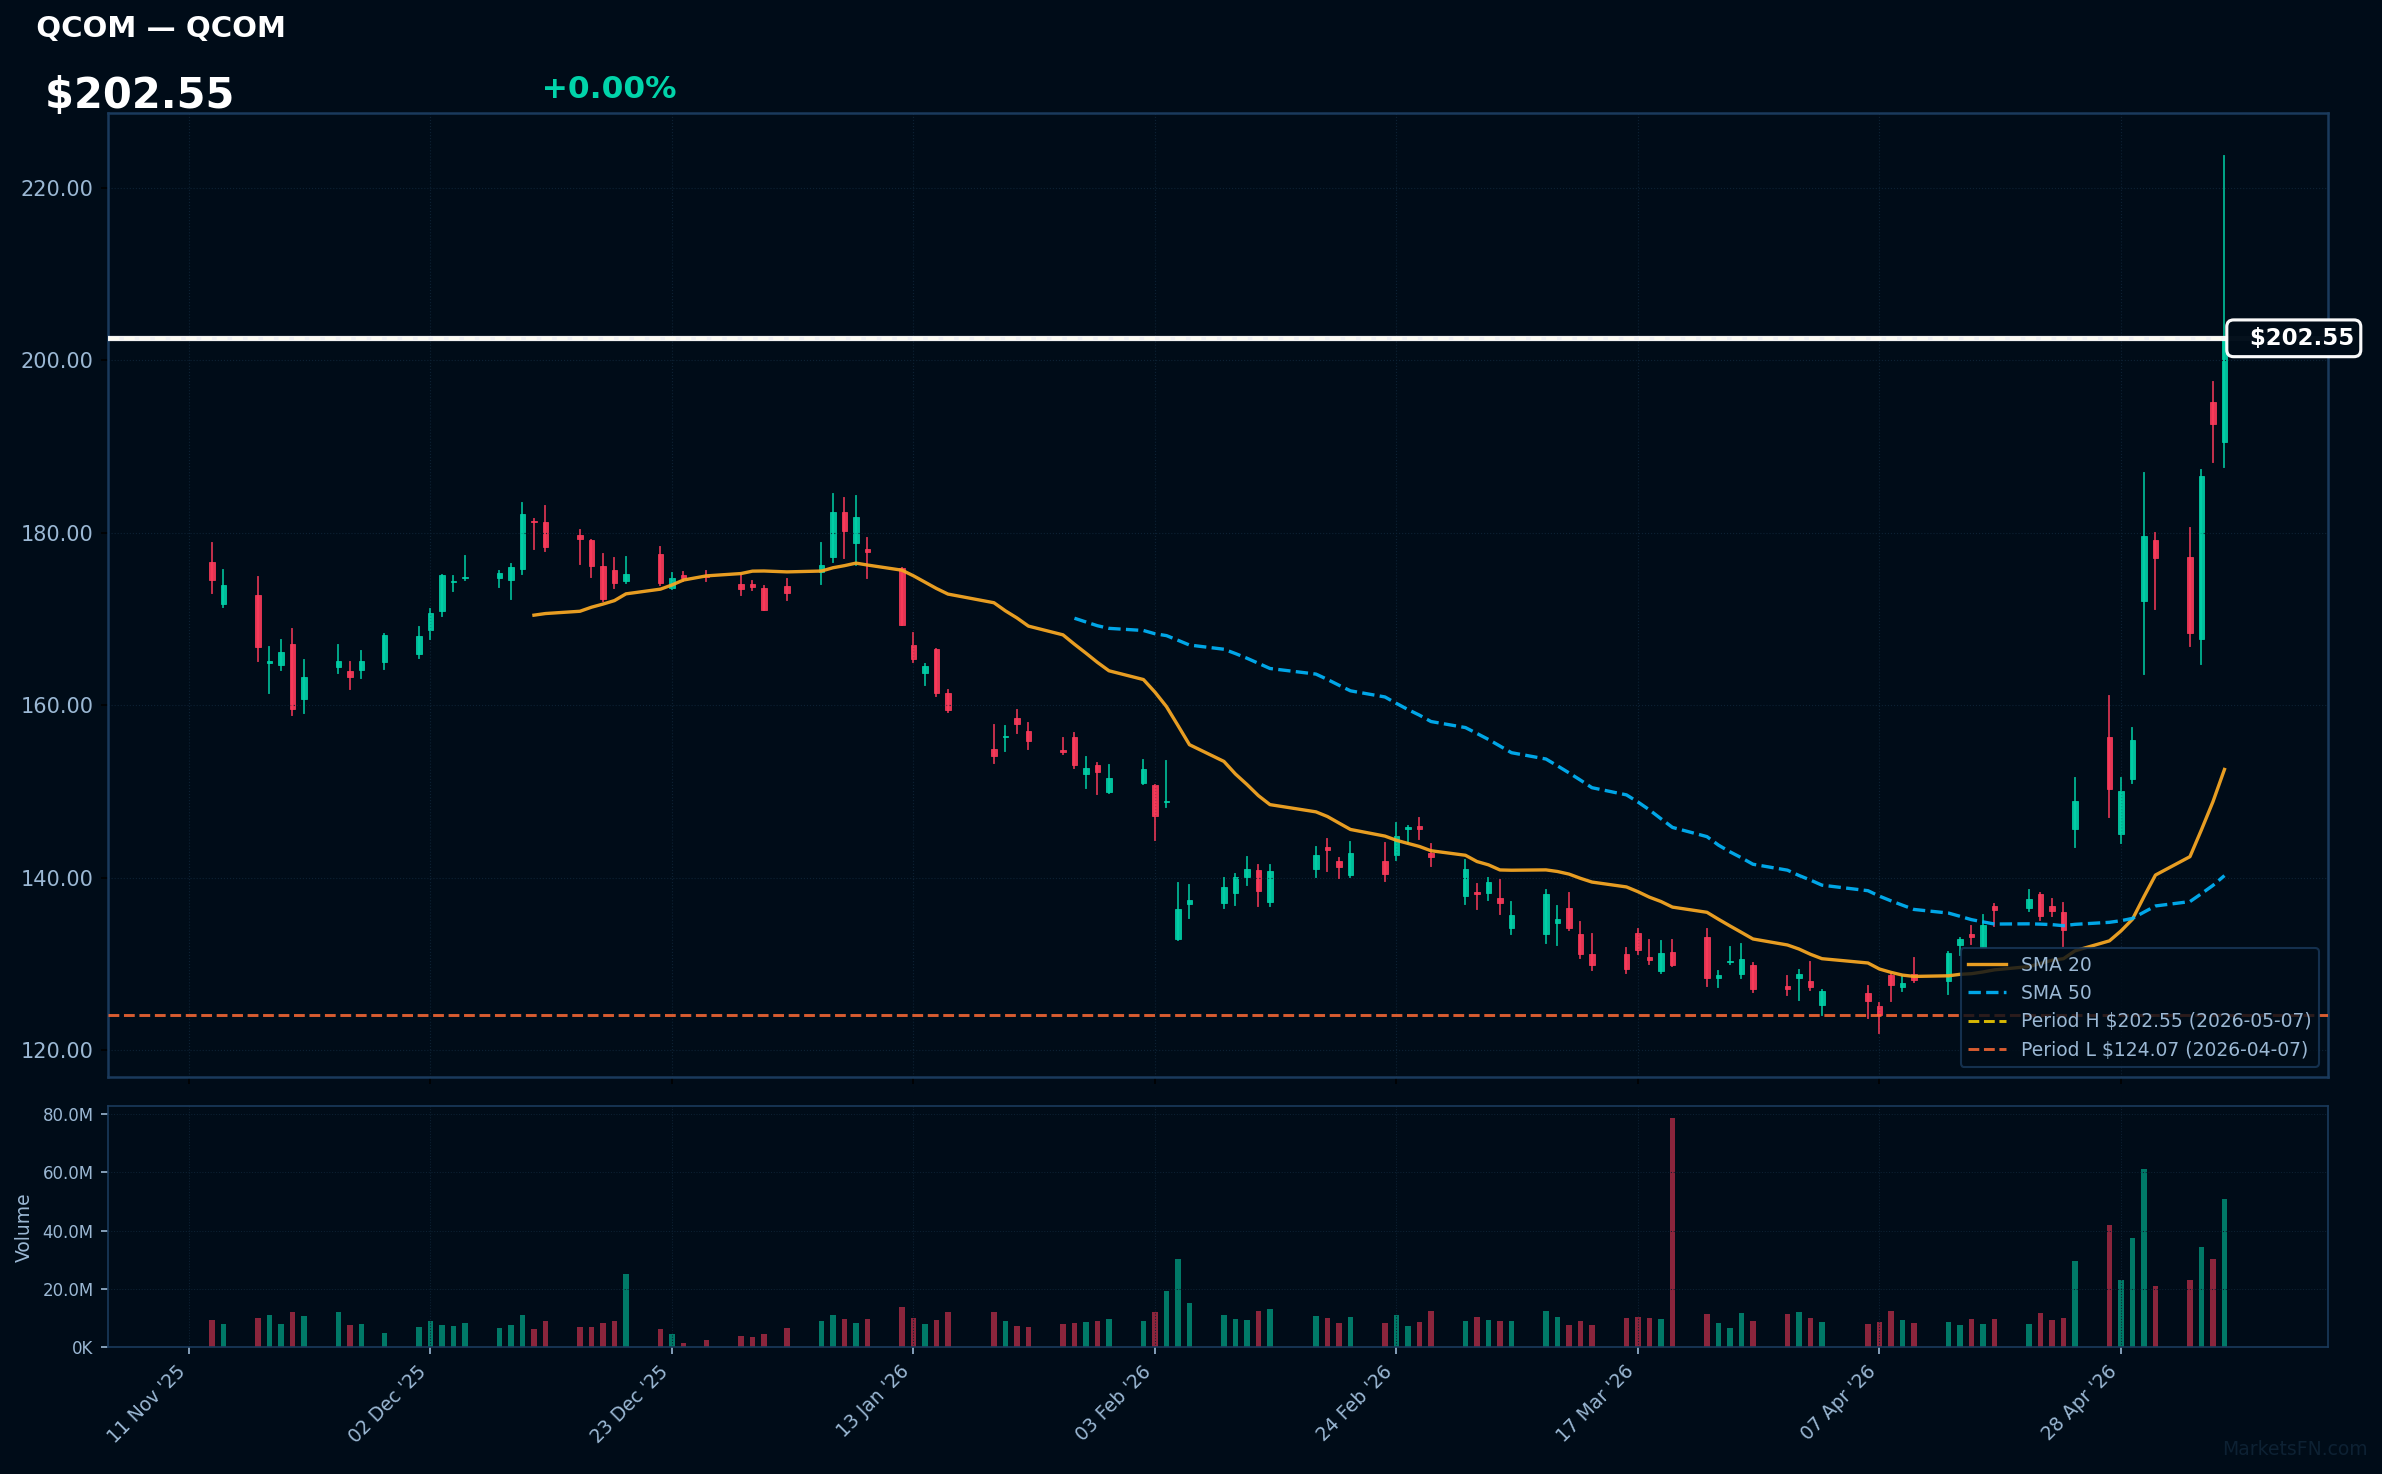
QCOM | Qualcomm, Inc | Technology | Price Last: $202.55 | % Realized: +39.59% | RSI: 82.6 | % above MA200: +28.7% | Trend: Above MA20, MA50, MA200
Qualcomm designs and sells semiconductors and wireless tech for mobile devices, IoT, and automotive. Investors should care due to its 5G dominance, valuable patents generating steady royalties, and growth in AI-driven connectivity, making it a high-revenue tech leader.
QCOM's RSI at 82.6 signals overbought conditions, but with price above MA20/MA50/MA200 and 0.0% below its 52-week high after 39.6% gains, it shows momentum from 5G demand. This could reflect fundamental strength or warn of a pullback to record levels.
Related headlines
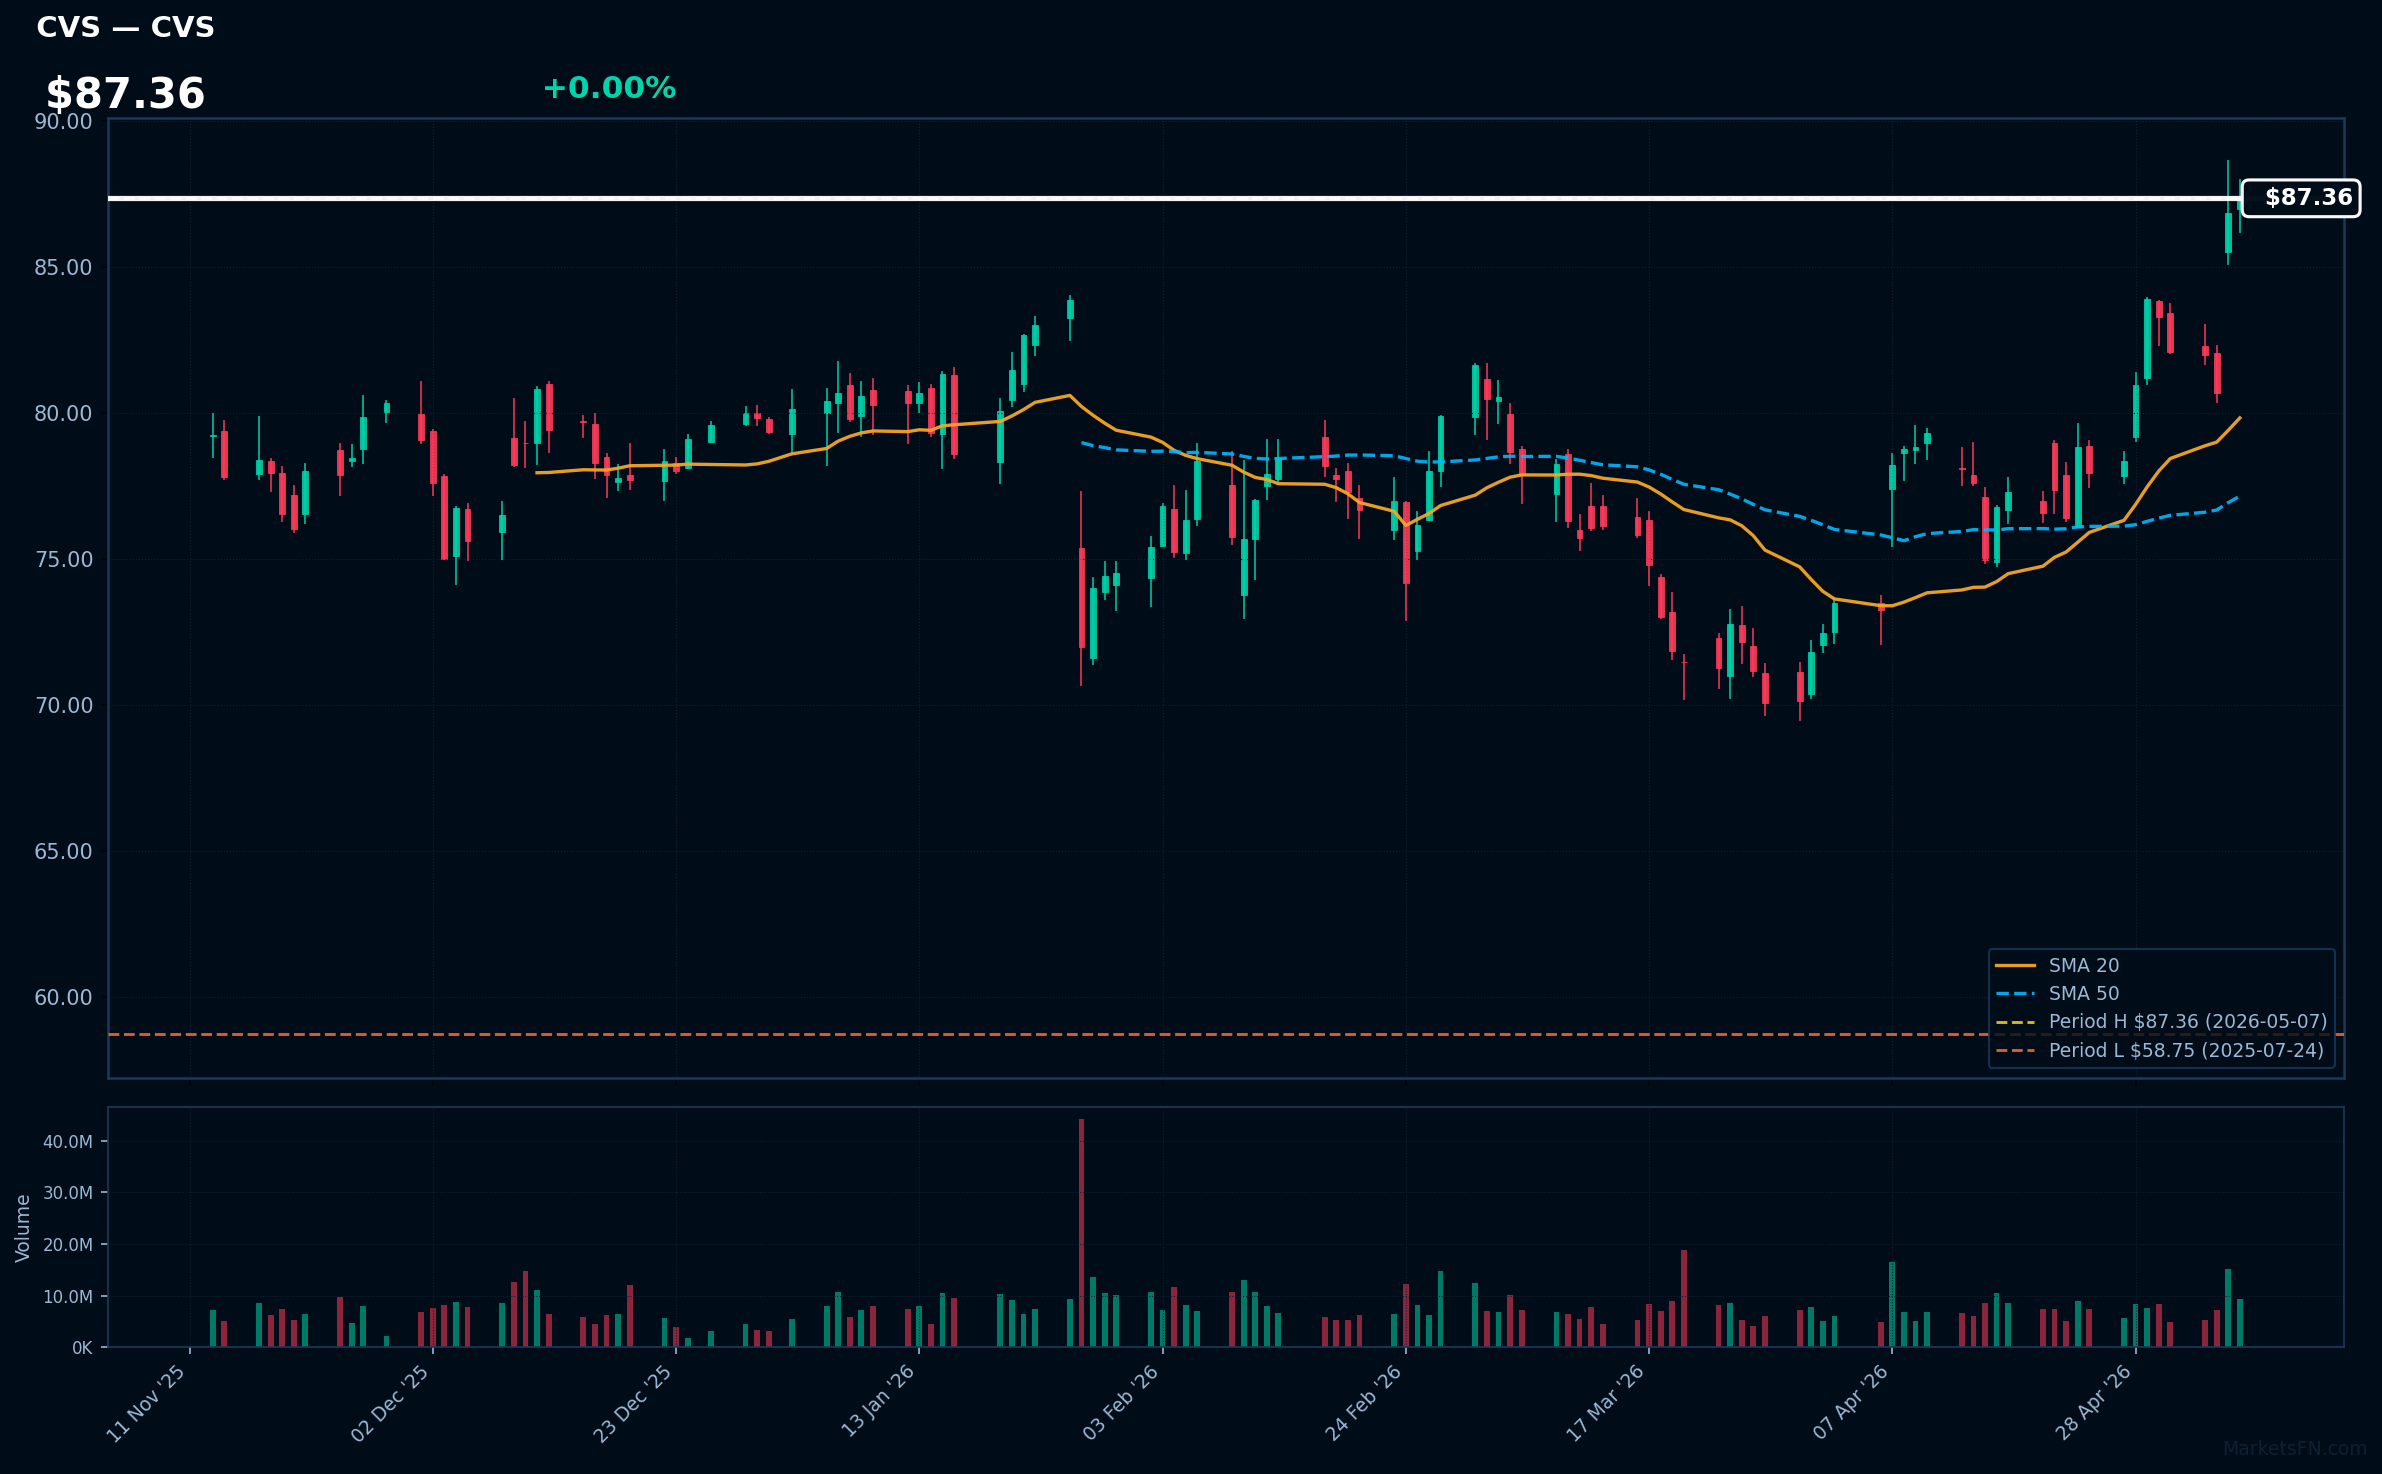
CVS | CVS Health Corp | Healthcare | Price Last: $87.36 | % Realized: +28.75% | RSI: 70.1 | % above MA200: +14.9% | Trend: Above MA20, MA50, MA200
CVS Health Corp runs retail pharmacies, manages prescriptions, provides health insurance through Aetna, and offers primary care via MinuteClinic. Investors should care because it's a key player in essential healthcare, with stable revenue from an aging population, growth via acquisitions, and exposure to drug pricing trends for potential returns.
With RSI at 70.1 indicating overbought conditions, CVS's bullish MA alignment and position at its 52-week high (28.8% yearly gain) suggest strong momentum. This could reflect fundamental strength or warn of a pullback; it's at record levels, so watch for breakout or correction.
Related headlines
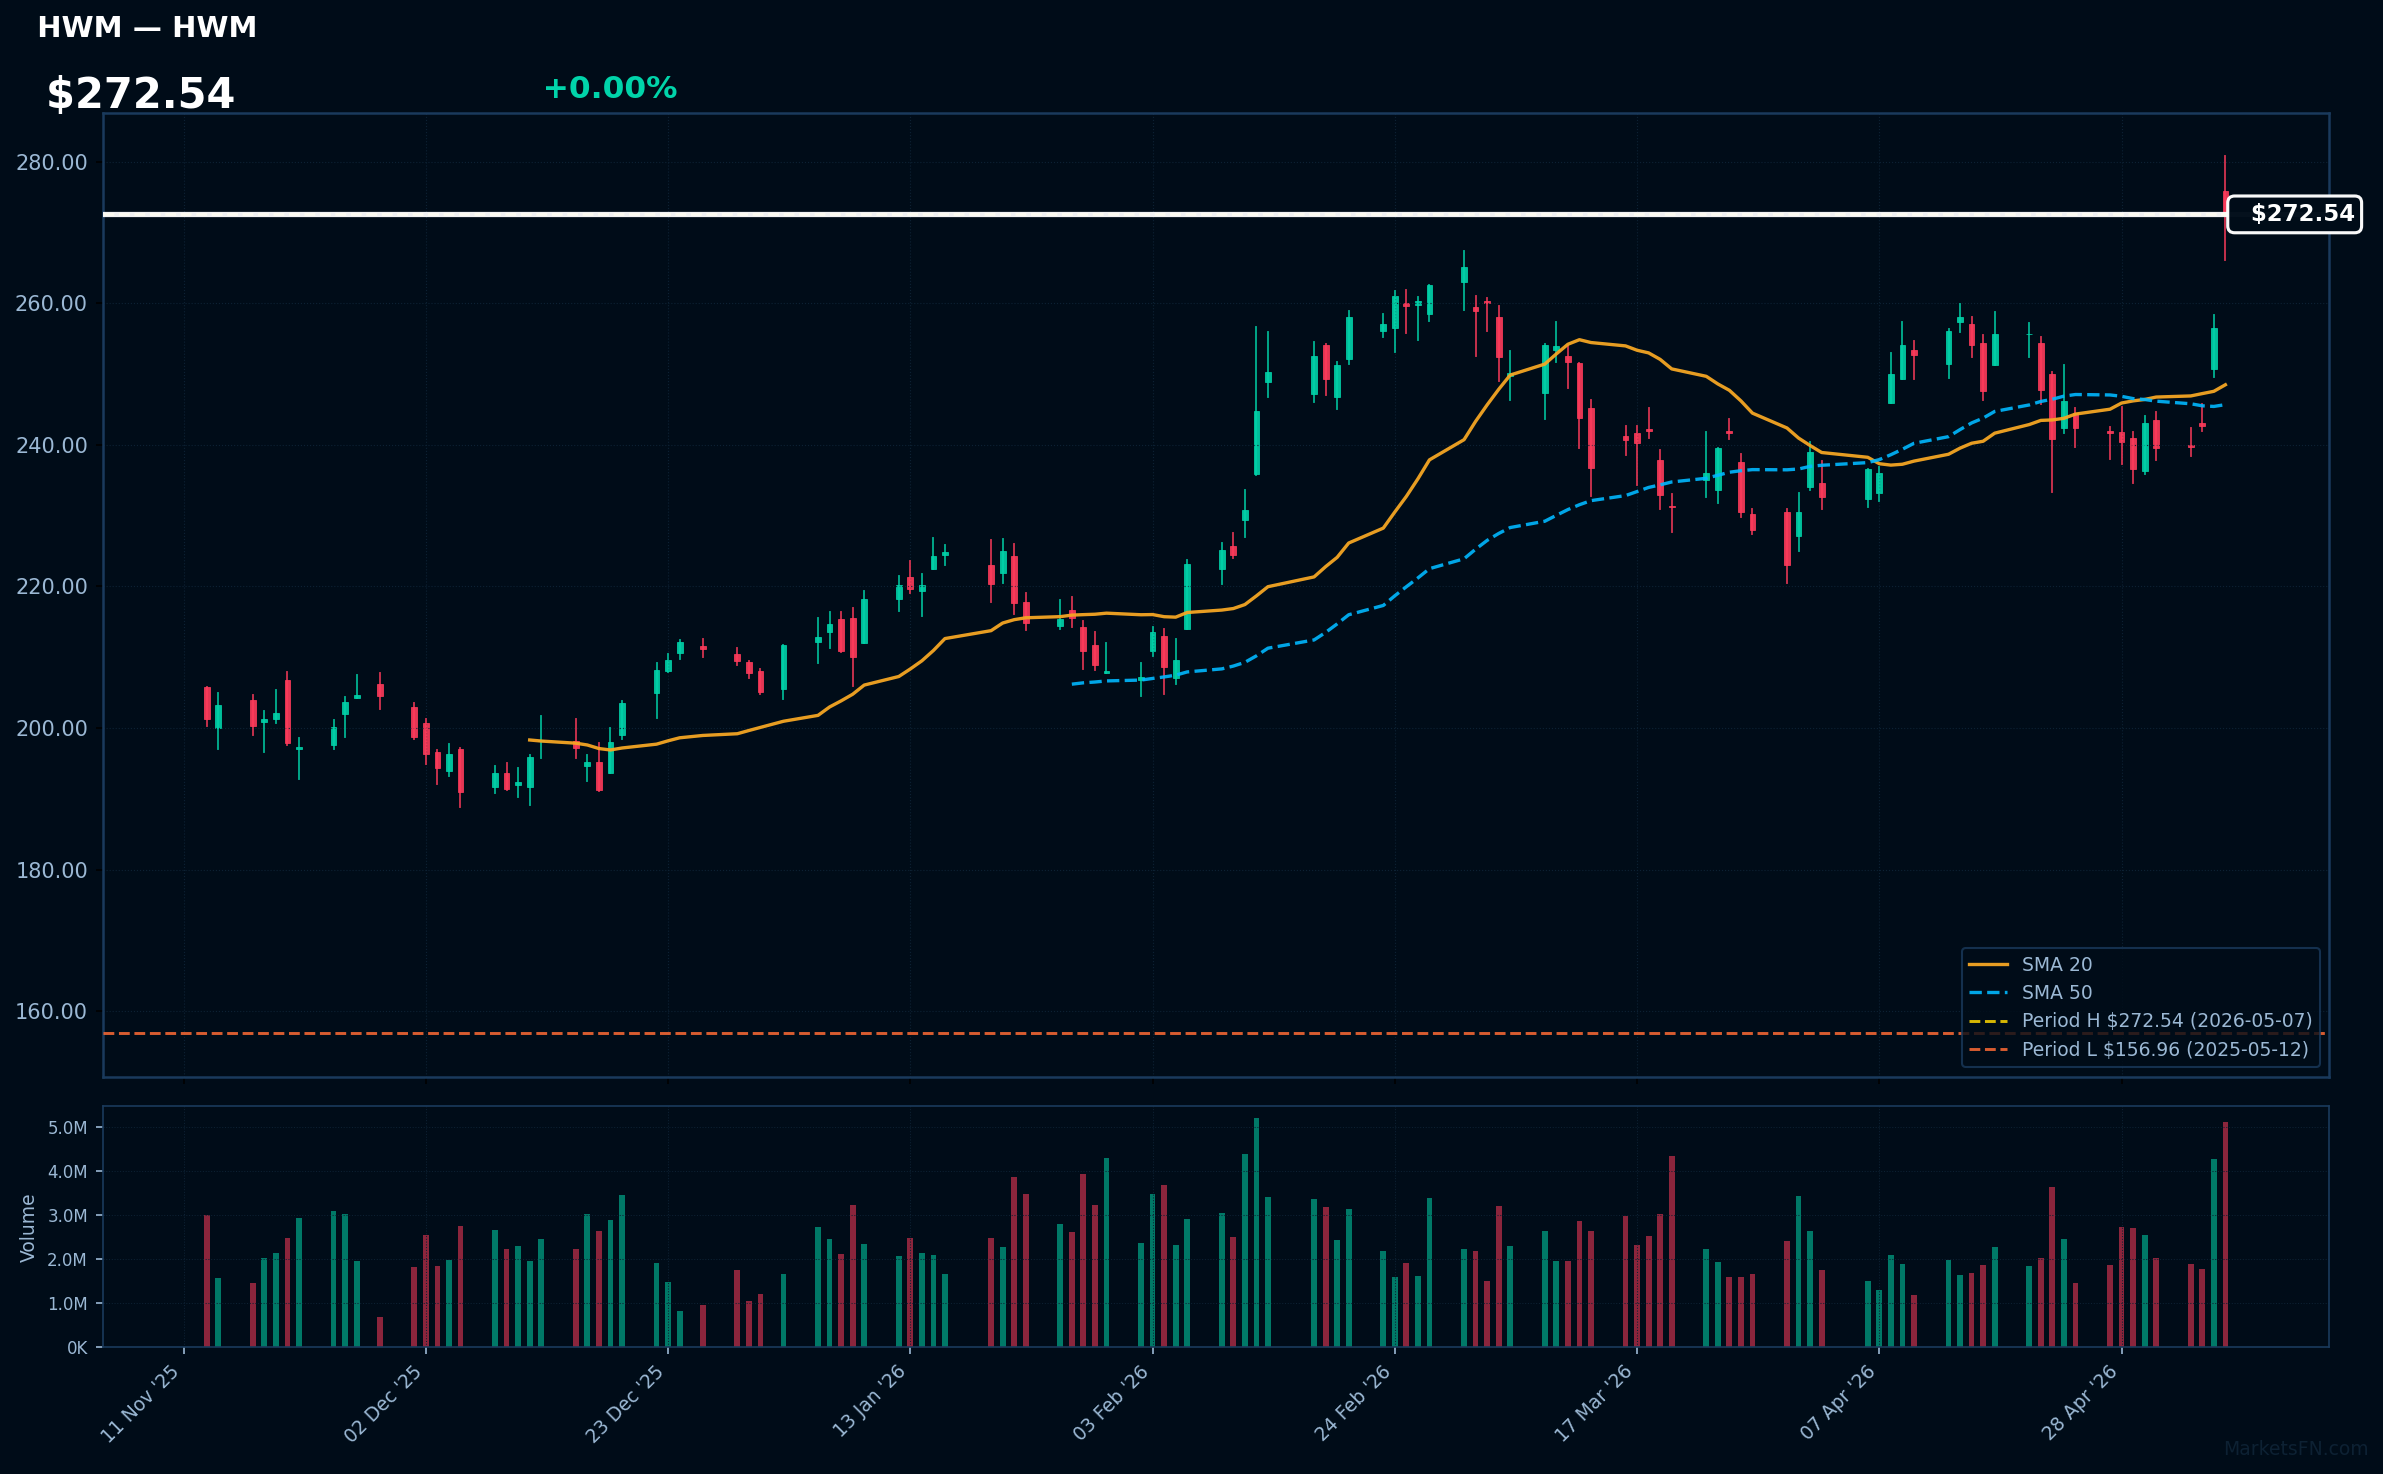
HWM | Howmet Aerospace Inc | Industrials | Price Last: $272.54 | % Realized: +73.04% | RSI: 68.3 | % above MA200: +28.9% | Trend: Above MA20, MA50, MA200
Howmet Aerospace manufactures advanced components like jet engine parts and structural materials using innovative alloys. Investors should care due to its pivotal role in the growing aerospace and defense sectors, providing steady revenue from long-term contracts and exposure to high-demand technologies.
With RSI at 68.3 signaling overbought and a bullish MA alignment (price > MA20 > MA50 > MA200), HWM is in a sustained uptrend, at its 52-week high with 73.0% gains. This reflects momentum and fundamental strength in aerospace, but could warn of a pullback.
Related headlines
- Howmet Aerospace Inc. stock outperforms competitors on strong trading day
- Howmet Aerospace Boosts FY26 Outlook; Declares Dividend; Shares Up 8% - Update
- Howmet Aerospace Breakout-Ready After Demand-Fueled Beat, Lifted Guidance
- Howmet Stock Surges. The Iran Conflict Is No Problem For Commercial Aerospace.
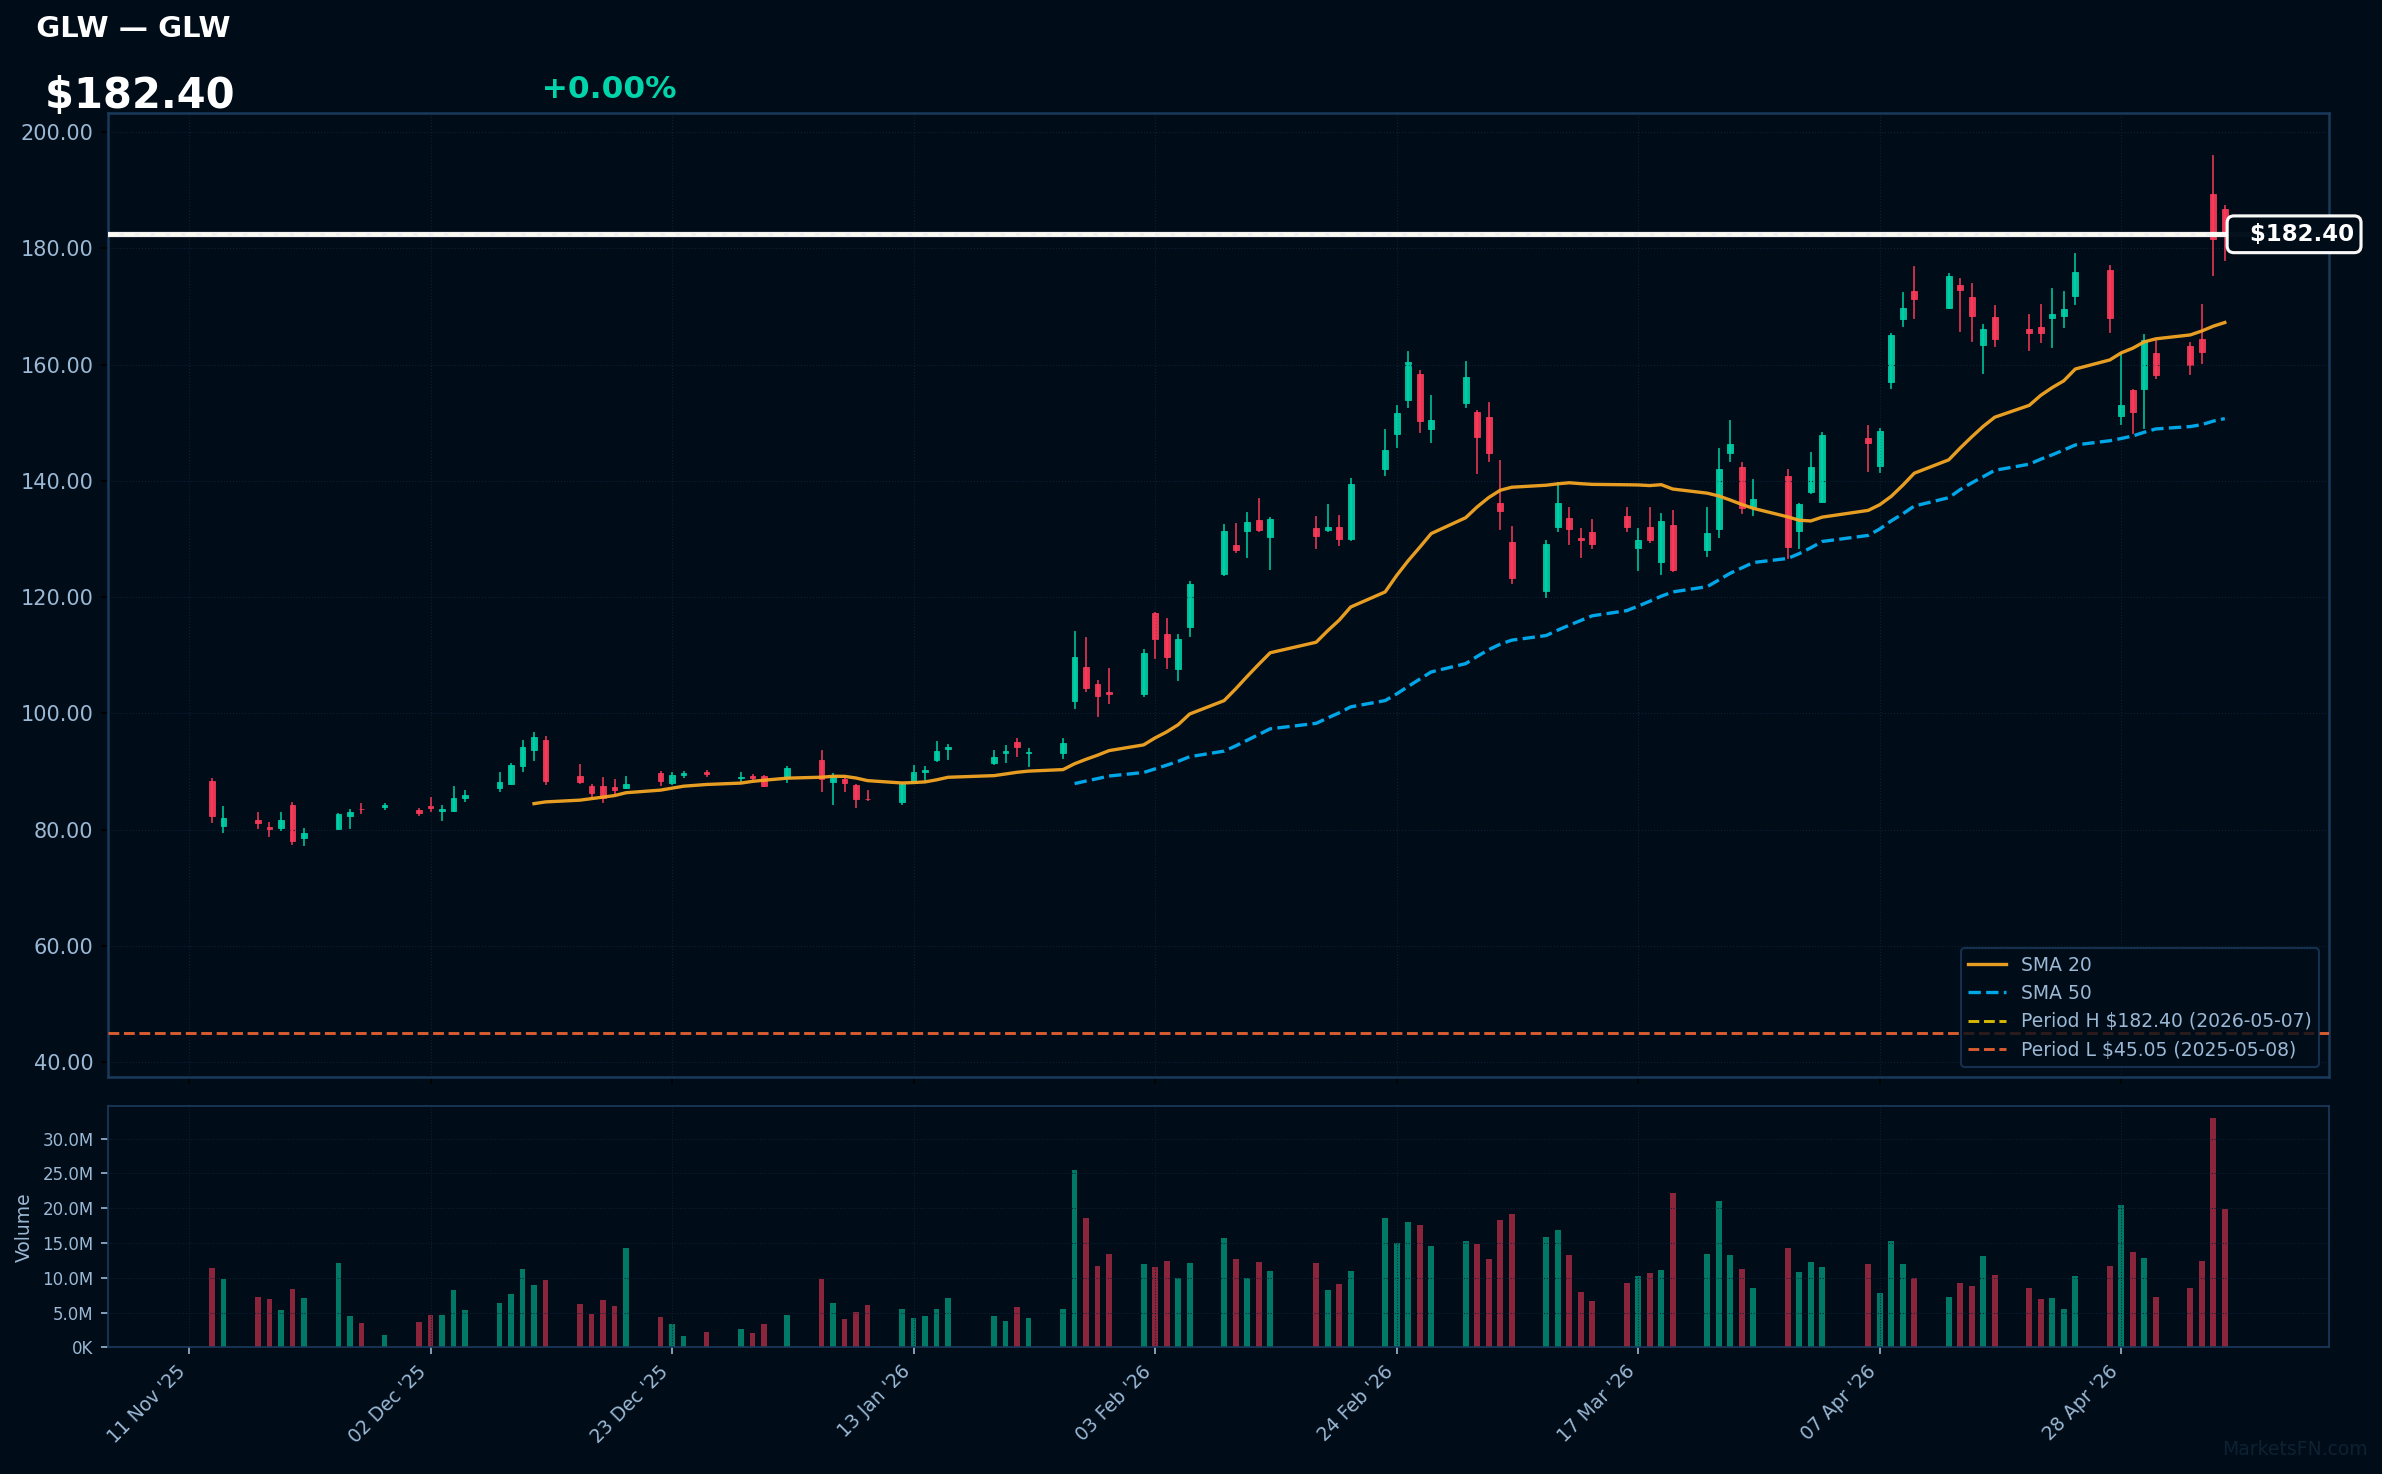
GLW | Corning, Inc | Technology | Price Last: $182.40 | % Realized: +304.88% | RSI: 64.6 | % above MA200: +77.8% | Trend: Above MA20, MA50, MA200
Corning produces specialty glass and ceramics, like Gorilla Glass for devices and optical fibers for networks. Investors care because its innovative materials fuel tech growth in telecom, displays, and autos, providing strong revenue from essential, high-demand products.
Corning's stock, with RSI 64.6 and price above key MAs, is in an uptrend and at its 52-week high after 304.9% gains. This suggests momentum and fundamental strength, but at record levels, it could indicate overbought risks.
Related headlines
📉 Nearest to 52-Week Low
Sectors represented: Consumer Cyclical (2), Technology (2), Healthcare (1)
| Ticker | Company | Sector | Price Last | % Realized | 52-Week Low Date | RSI | % above MA200 | Trend |
|---|---|---|---|---|---|---|---|---|
| MCD | McDonald's Corp | Consumer Cyclical | $283.70 | -9.50% | 2026-05-07 | 30.6 | -8.3% | Below MA20, MA50, MA200 |
| ZTS | Zoetis Inc | Healthcare | $87.31 | -46.00% | 2026-05-07 | 15.2 | -33.5% | Below MA20, MA50, MA200 |
| TSCO | Tractor Supply Co | Consumer Cyclical | $31.74 | -38.27% | 2026-05-07 | 16.6 | -39.6% | Below MA20, MA50, MA200 |
| LDOS | Leidos Holdings Inc | Technology | $131.26 | -15.16% | 2026-05-07 | 22.0 | -26.5% | Below MA20, MA50, MA200 |
| TRMB | Trimble Inc | Technology | $61.85 | -8.21% | 2026-05-07 | 33.0 | -18.0% | Below MA20, MA50, MA200 |
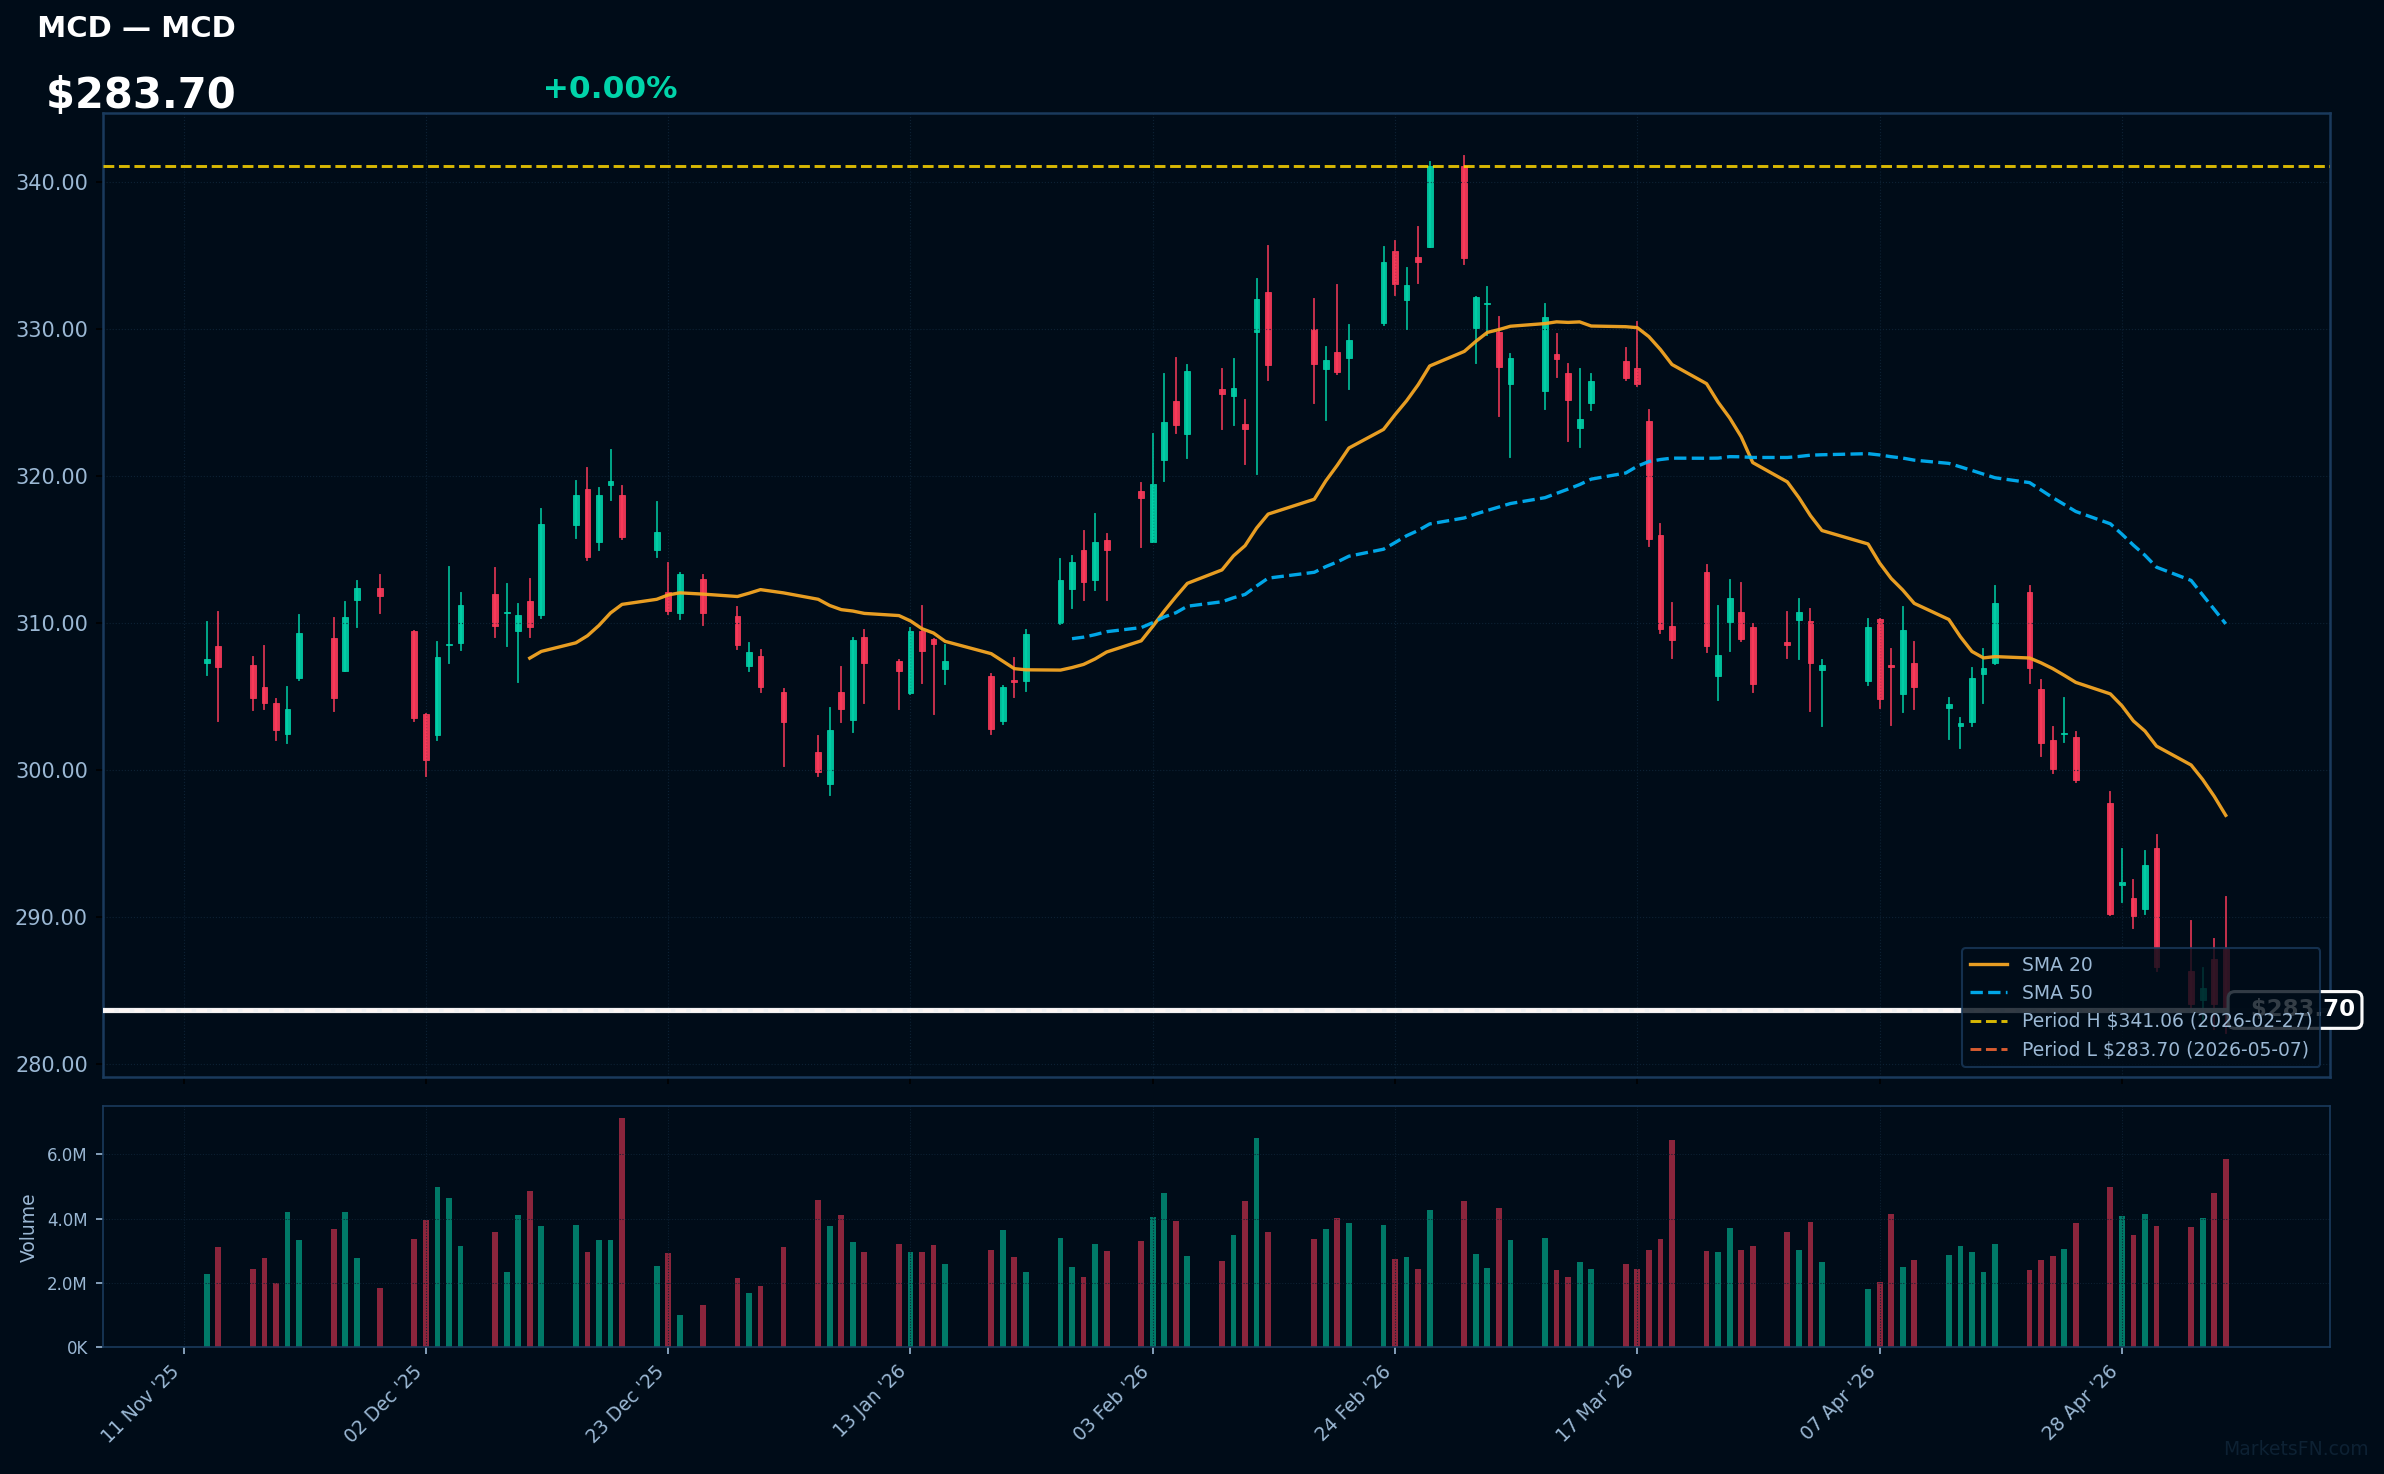
MCD | McDonald's Corp | Consumer Cyclical | Price Last: $283.70 | % Realized: -9.50% | RSI: 30.6 | % above MA200: -8.3% | Trend: Below MA20, MA50, MA200
McDonald's Corp operates and franchises over 39,000 fast-food restaurants globally, serving burgers, fries, and beverages through a robust supply chain and real estate empire. Investors should care for its reliable cash flow from franchising, consistent dividends (over 45 years), and resilience in economic downturns, offering steady long-term growth.
With RSI at 30.6 signaling oversold conditions, MCD trades below its 20, 50, and 200-day moving averages, indicating bearish momentum. At its 52-week low with a -9.5% annual return, this appears a warning sign despite strong fundamentals, potentially testing support for a rebound opportunity.
Related headlines
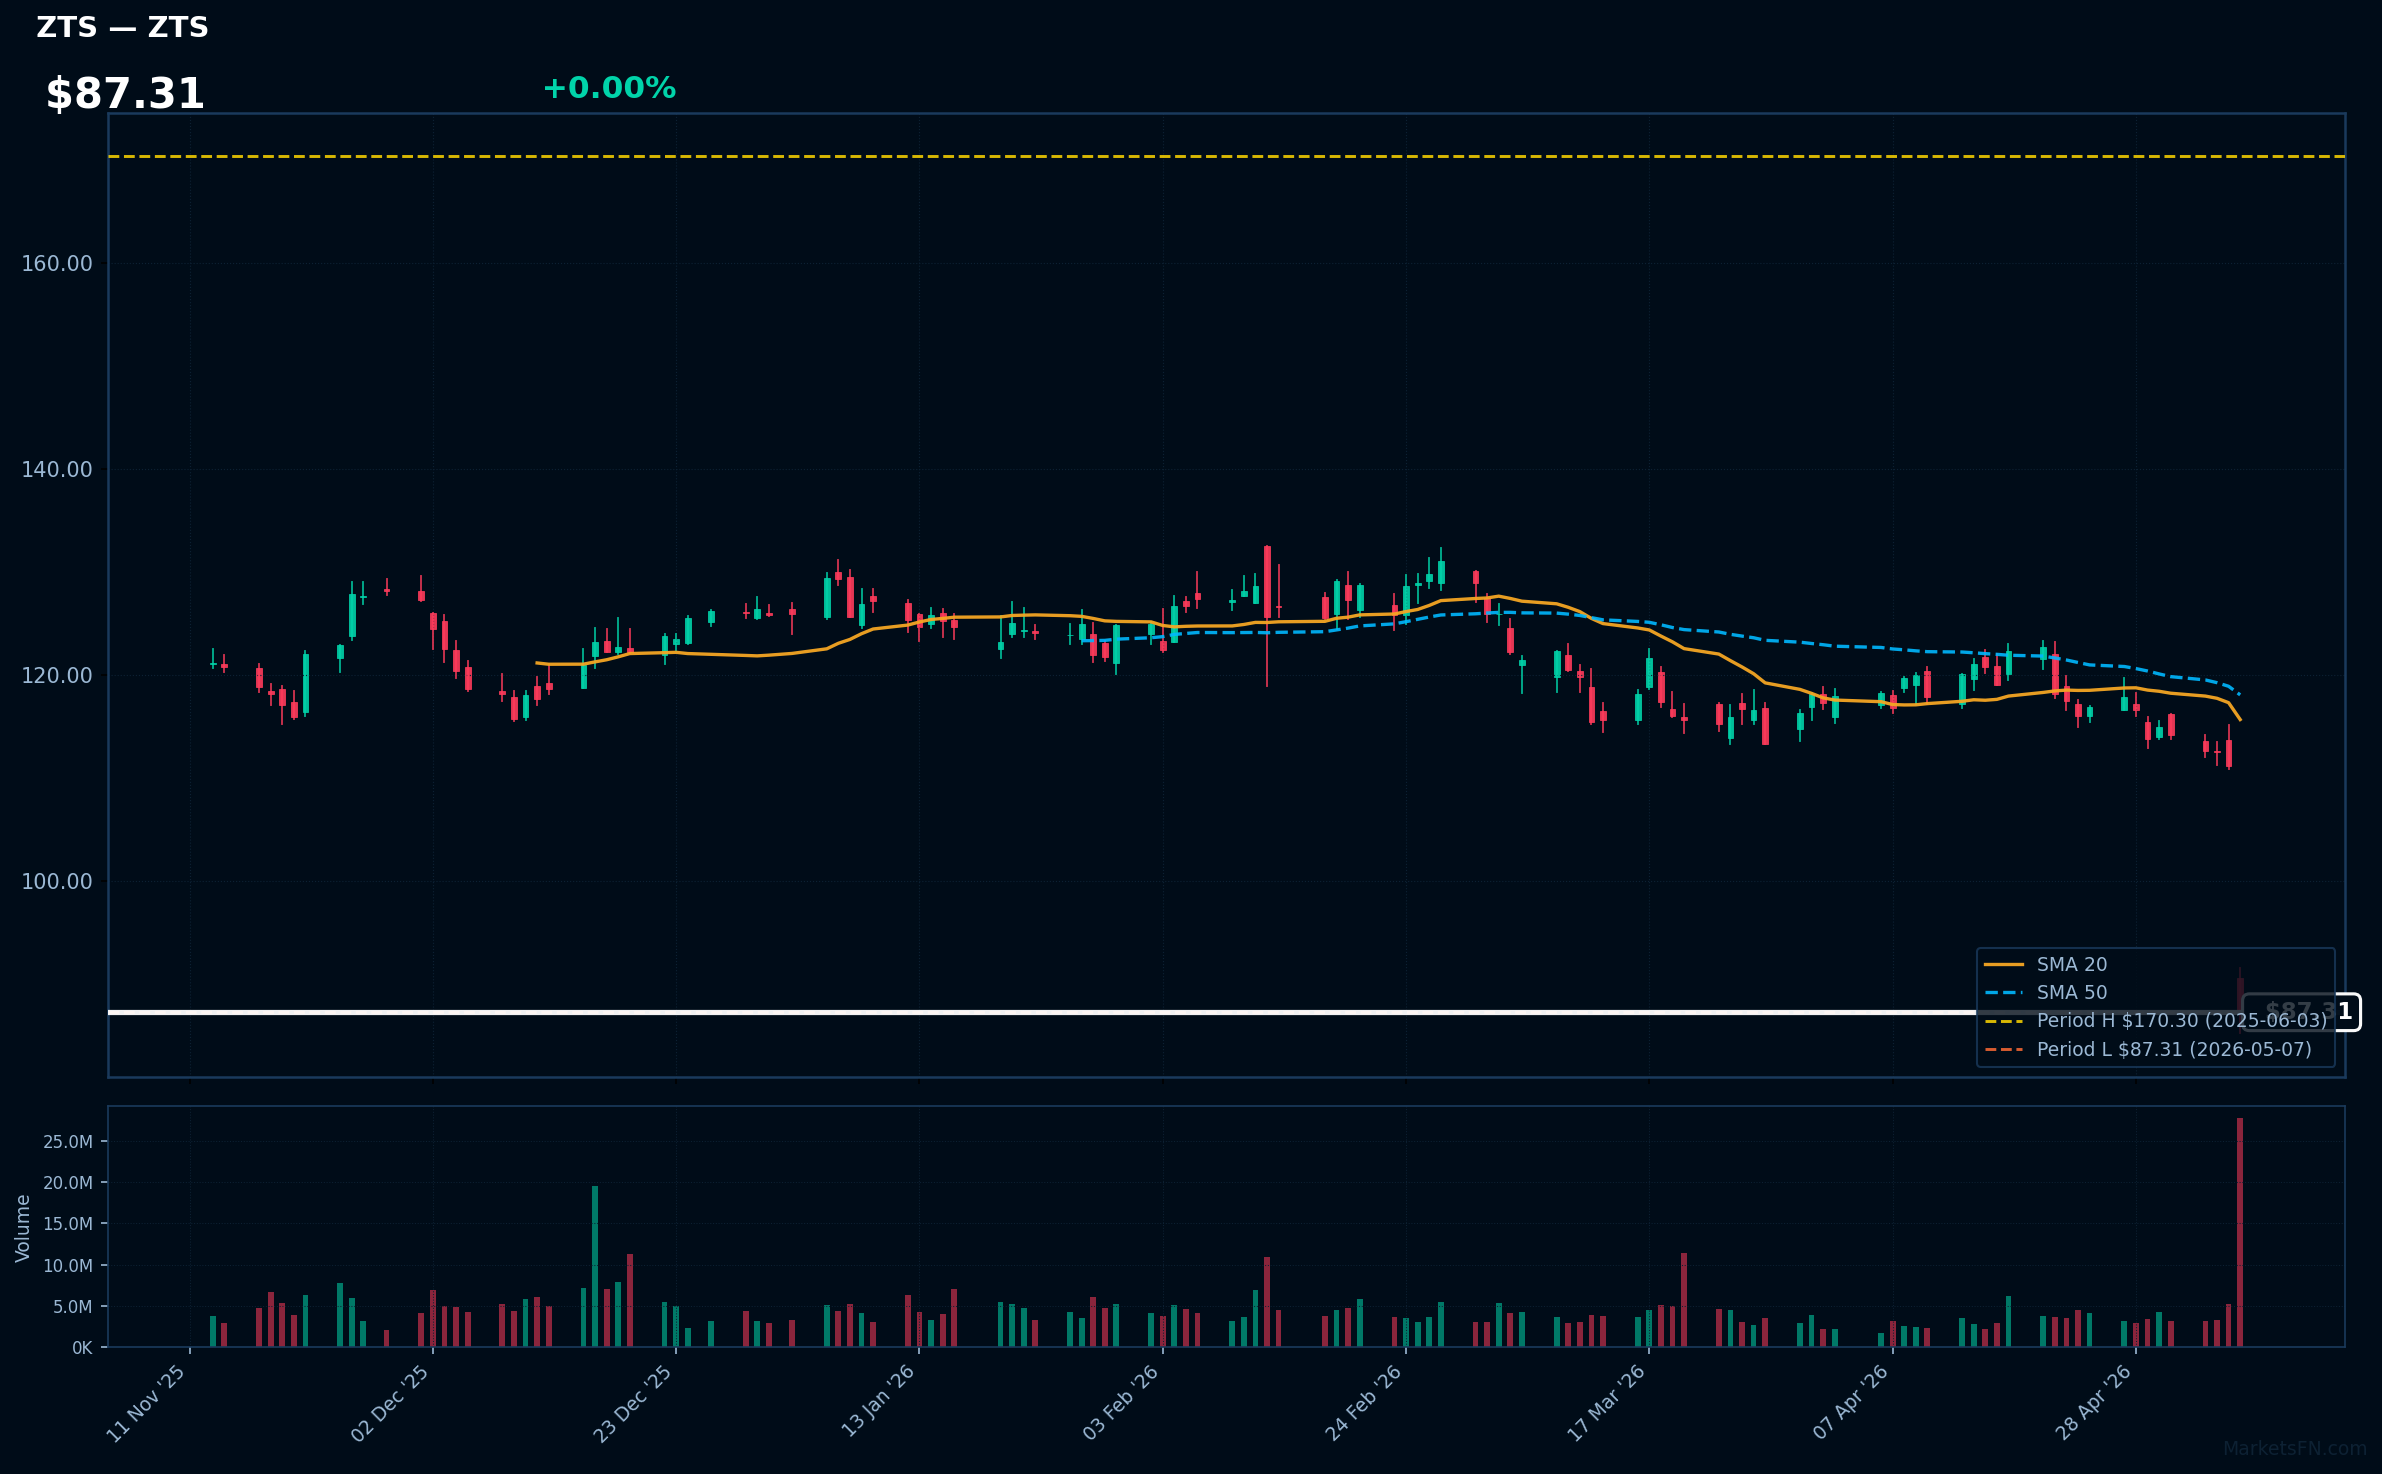
ZTS | Zoetis Inc | Healthcare | Price Last: $87.31 | % Realized: -46.00% | RSI: 15.2 | % above MA200: -33.5% | Trend: Below MA20, MA50, MA200
Zoetis Inc develops, manufactures, and markets animal health medicines, vaccines, and diagnostics for pets and livestock. Investors should care because it's the global leader in this sector, benefiting from rising pet ownership, increasing demand for food animal products, and innovative treatments that drive consistent revenue growth amid growing global veterinary needs.
Zoetis stock at $87.31 is in a sustained downtrend, with RSI at 15.2 (oversold), price below MA20 < MA50 < MA200, and just 0.0% above its 52-week low after a -46.0% annual drop. This could be a warning sign of ongoing weakness rather than momentum or fundamental strength, as it tests major support levels near record lows.
Related headlines
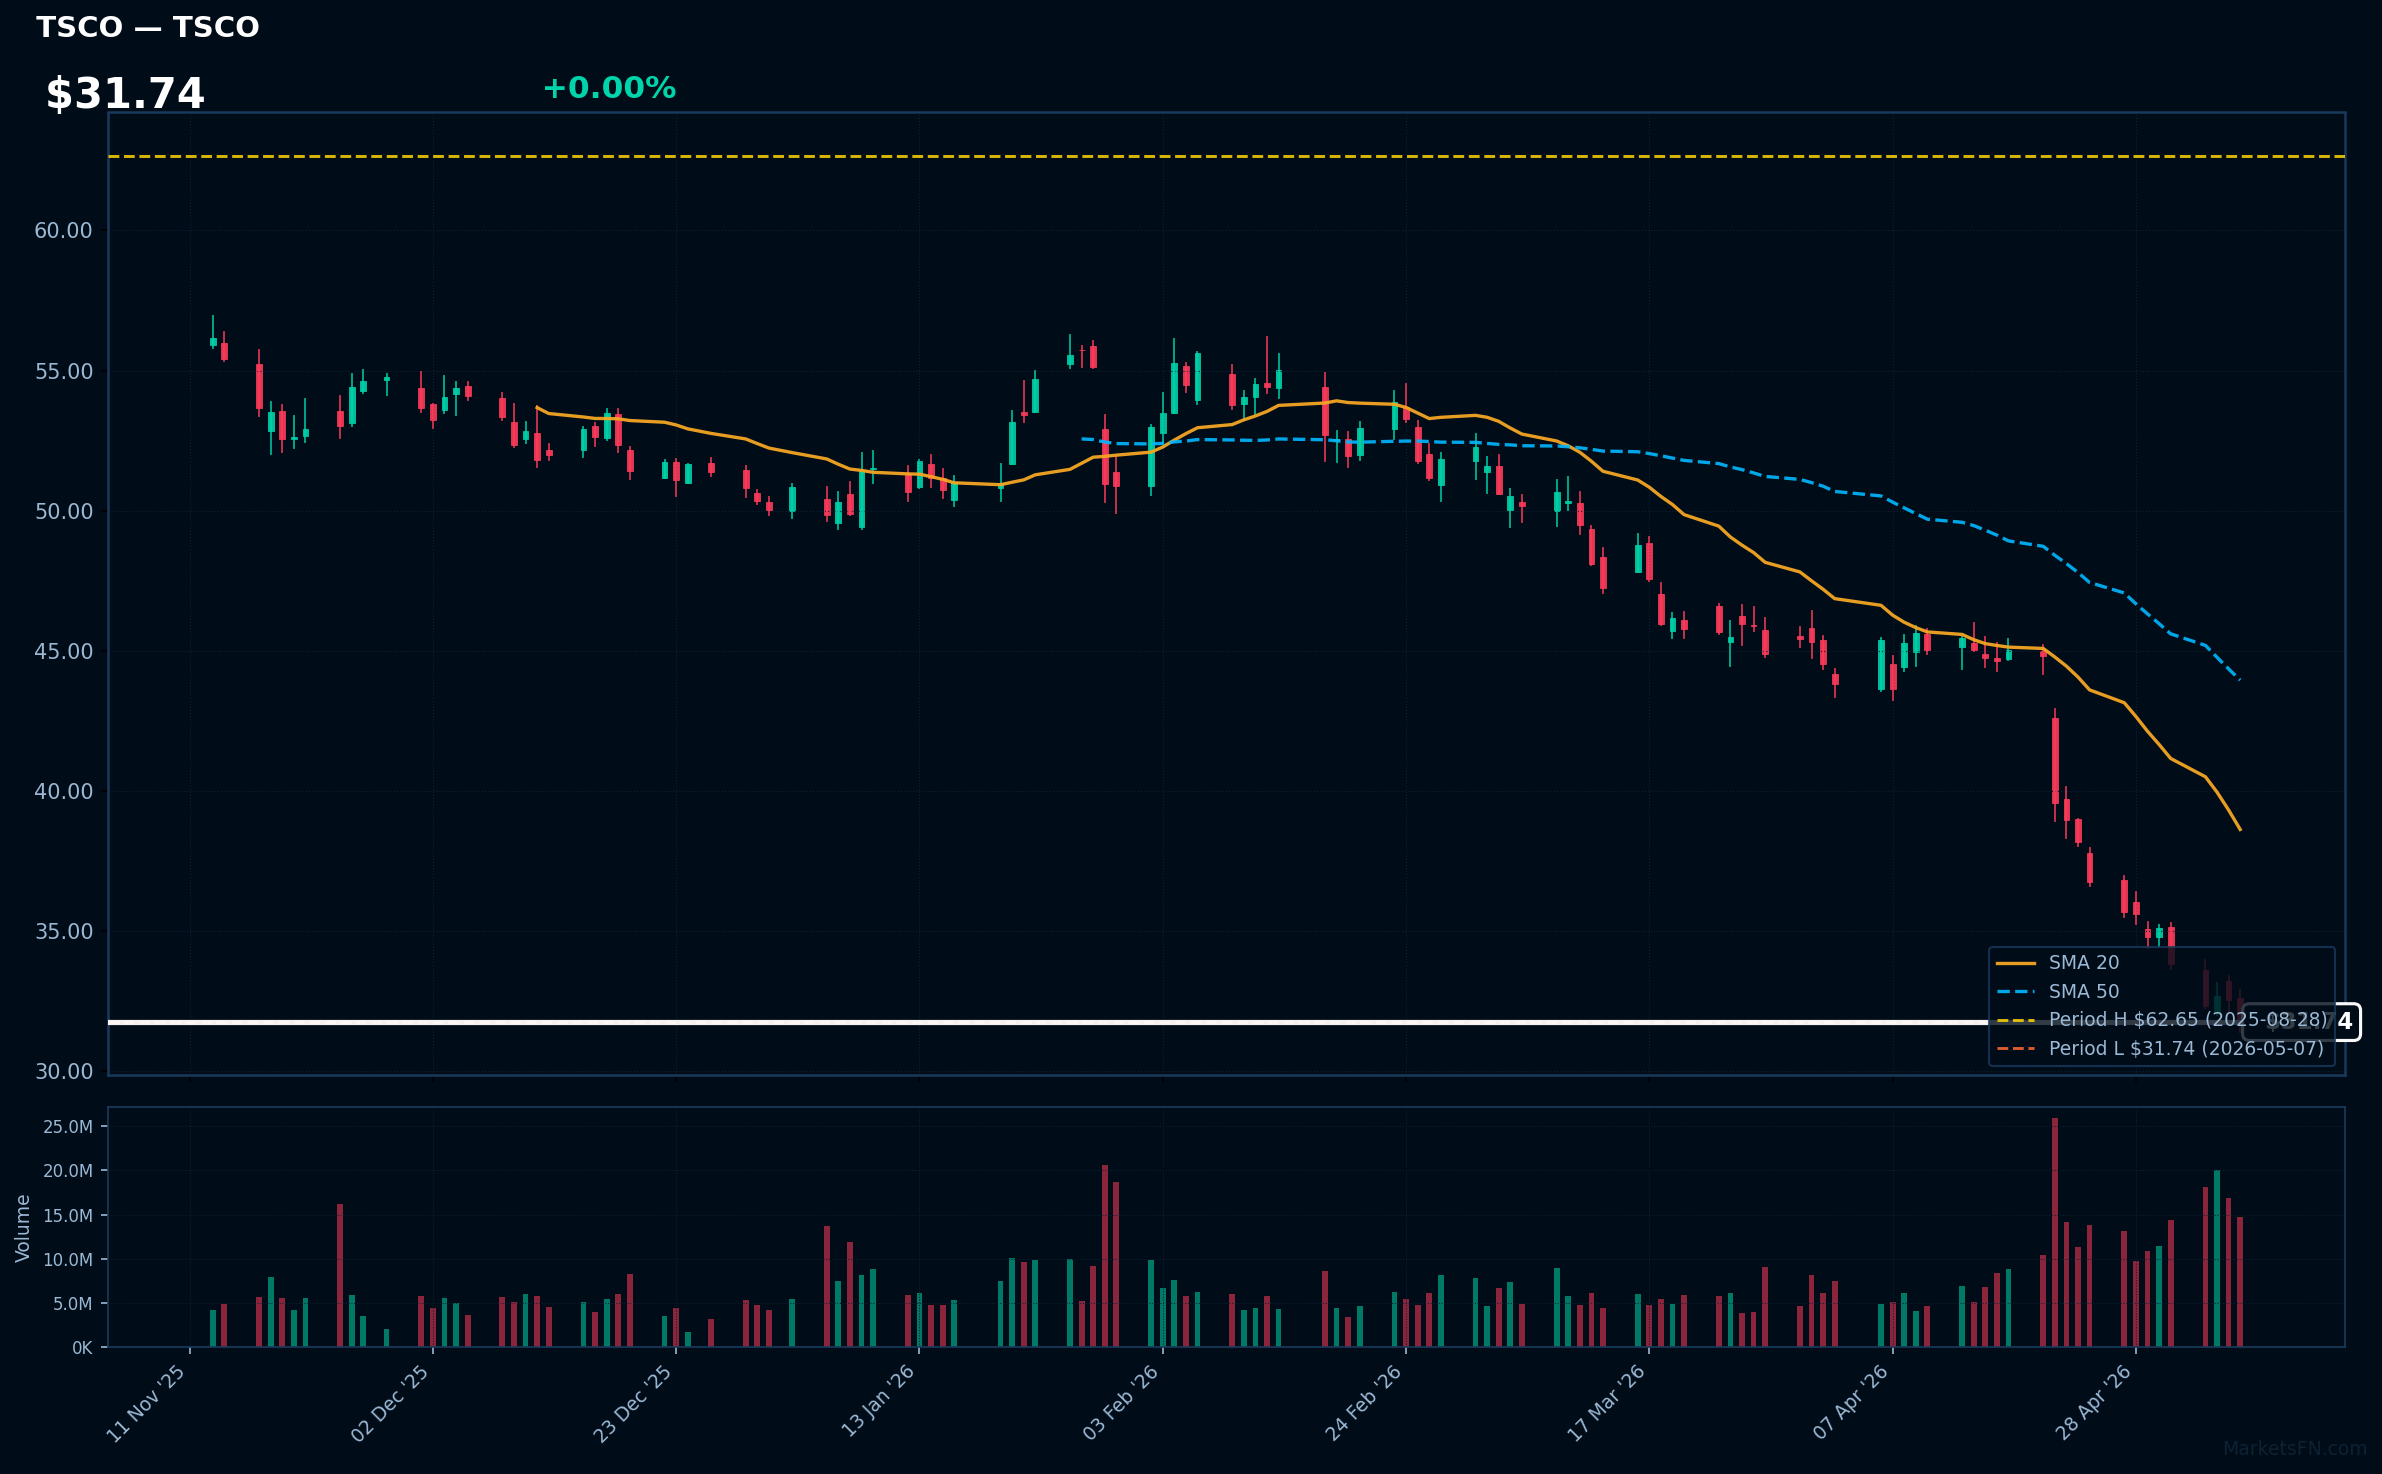
TSCO | Tractor Supply Co | Consumer Cyclical | Price Last: $31.74 | % Realized: -38.27% | RSI: 16.6 | % above MA200: -39.6% | Trend: Below MA20, MA50, MA200
Tractor Supply Co operates over 2,000 stores selling farm supplies, tools, pet products, and outdoor gear for rural customers. Investors should care due to its market dominance, consistent demand for essentials, and growth potential in e-commerce, making it a resilient retail play amid economic shifts.
RSI at 16.6 signals oversold conditions, but bearish MA alignment (price < MA20 < MA50 < MA200) and being at its 52-week low indicate a sustained downtrend. The 38.3% yearly drop may warn of fundamental weaknesses rather than temporary momentum, advising caution.
Related headlines
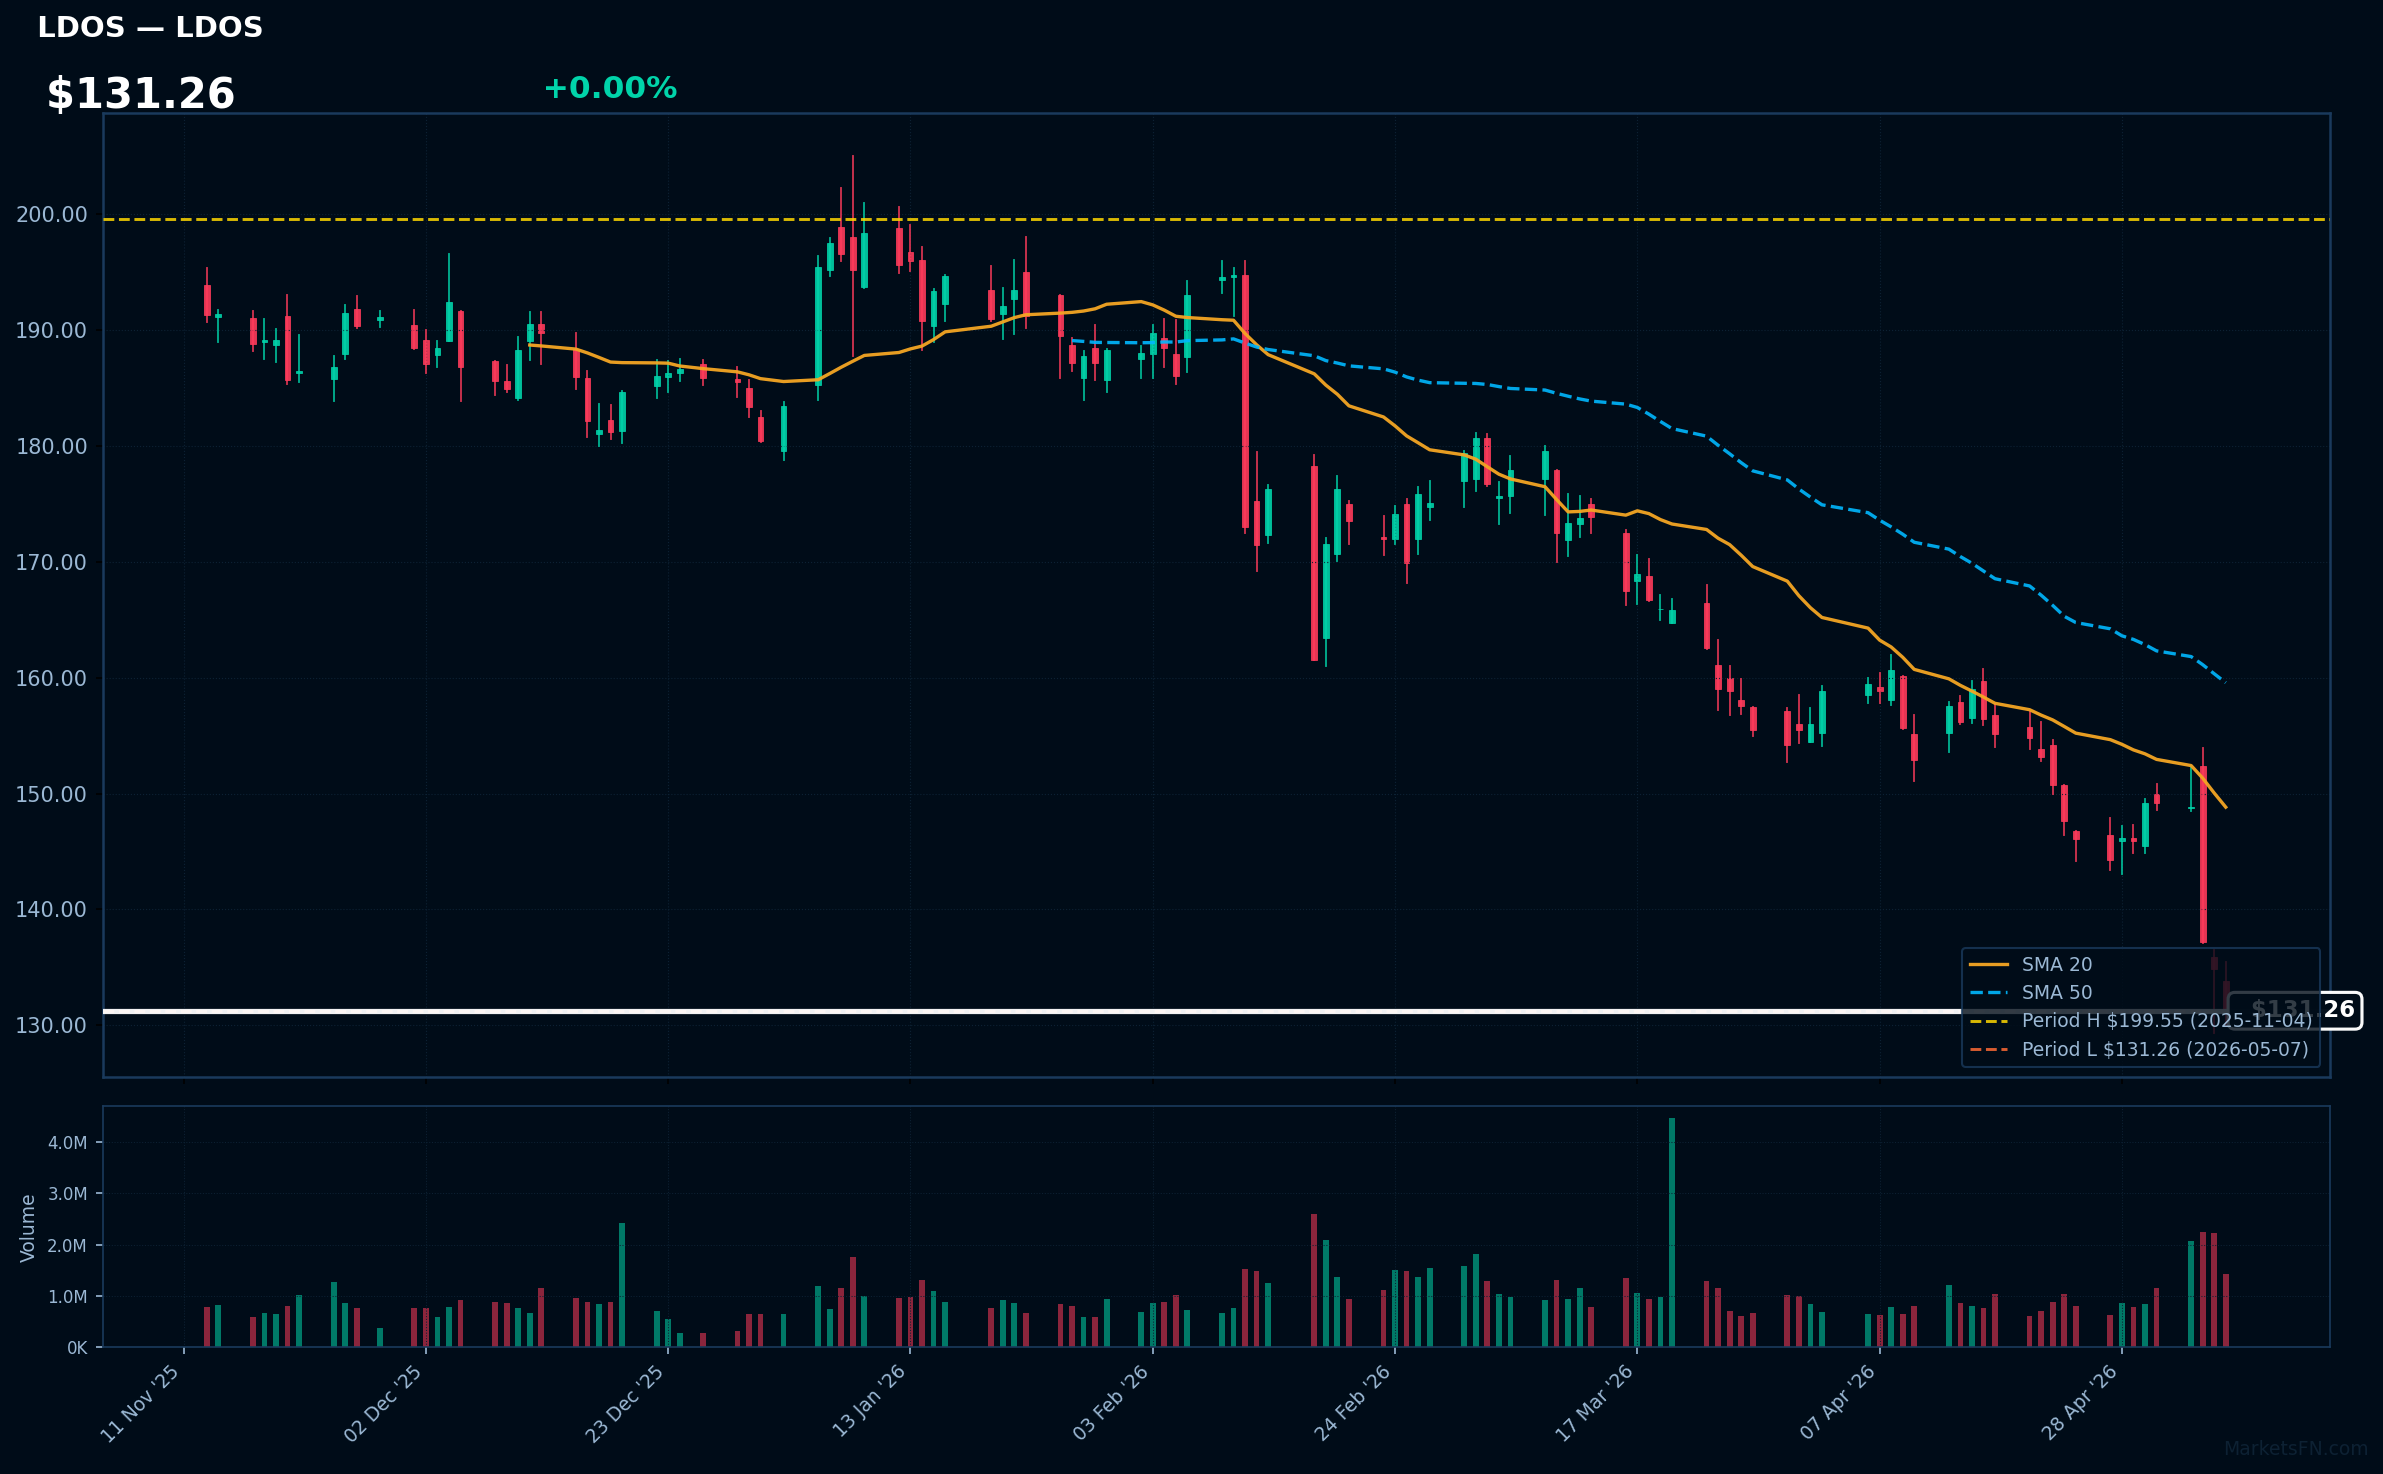
LDOS | Leidos Holdings Inc | Technology | Price Last: $131.26 | % Realized: -15.16% | RSI: 22.0 | % above MA200: -26.5% | Trend: Below MA20, MA50, MA200
Leidos Holdings Inc provides technology solutions for defense, health, and engineering, mainly through U.S. government contracts. Investors should care because its steady revenue from these deals offers stability in volatile markets, but it's vulnerable to policy shifts and budget cuts that could impact earnings.
LDOS, at $131.26, shows a sustained downtrend with RSI at 22.0 (oversold) and price below MA20, MA50, and MA200. At its 52-week low, with a -15.2% annual return, this could be a warning sign of further declines or a rebound if strong government contracts underpin fundamentals.
Related headlines
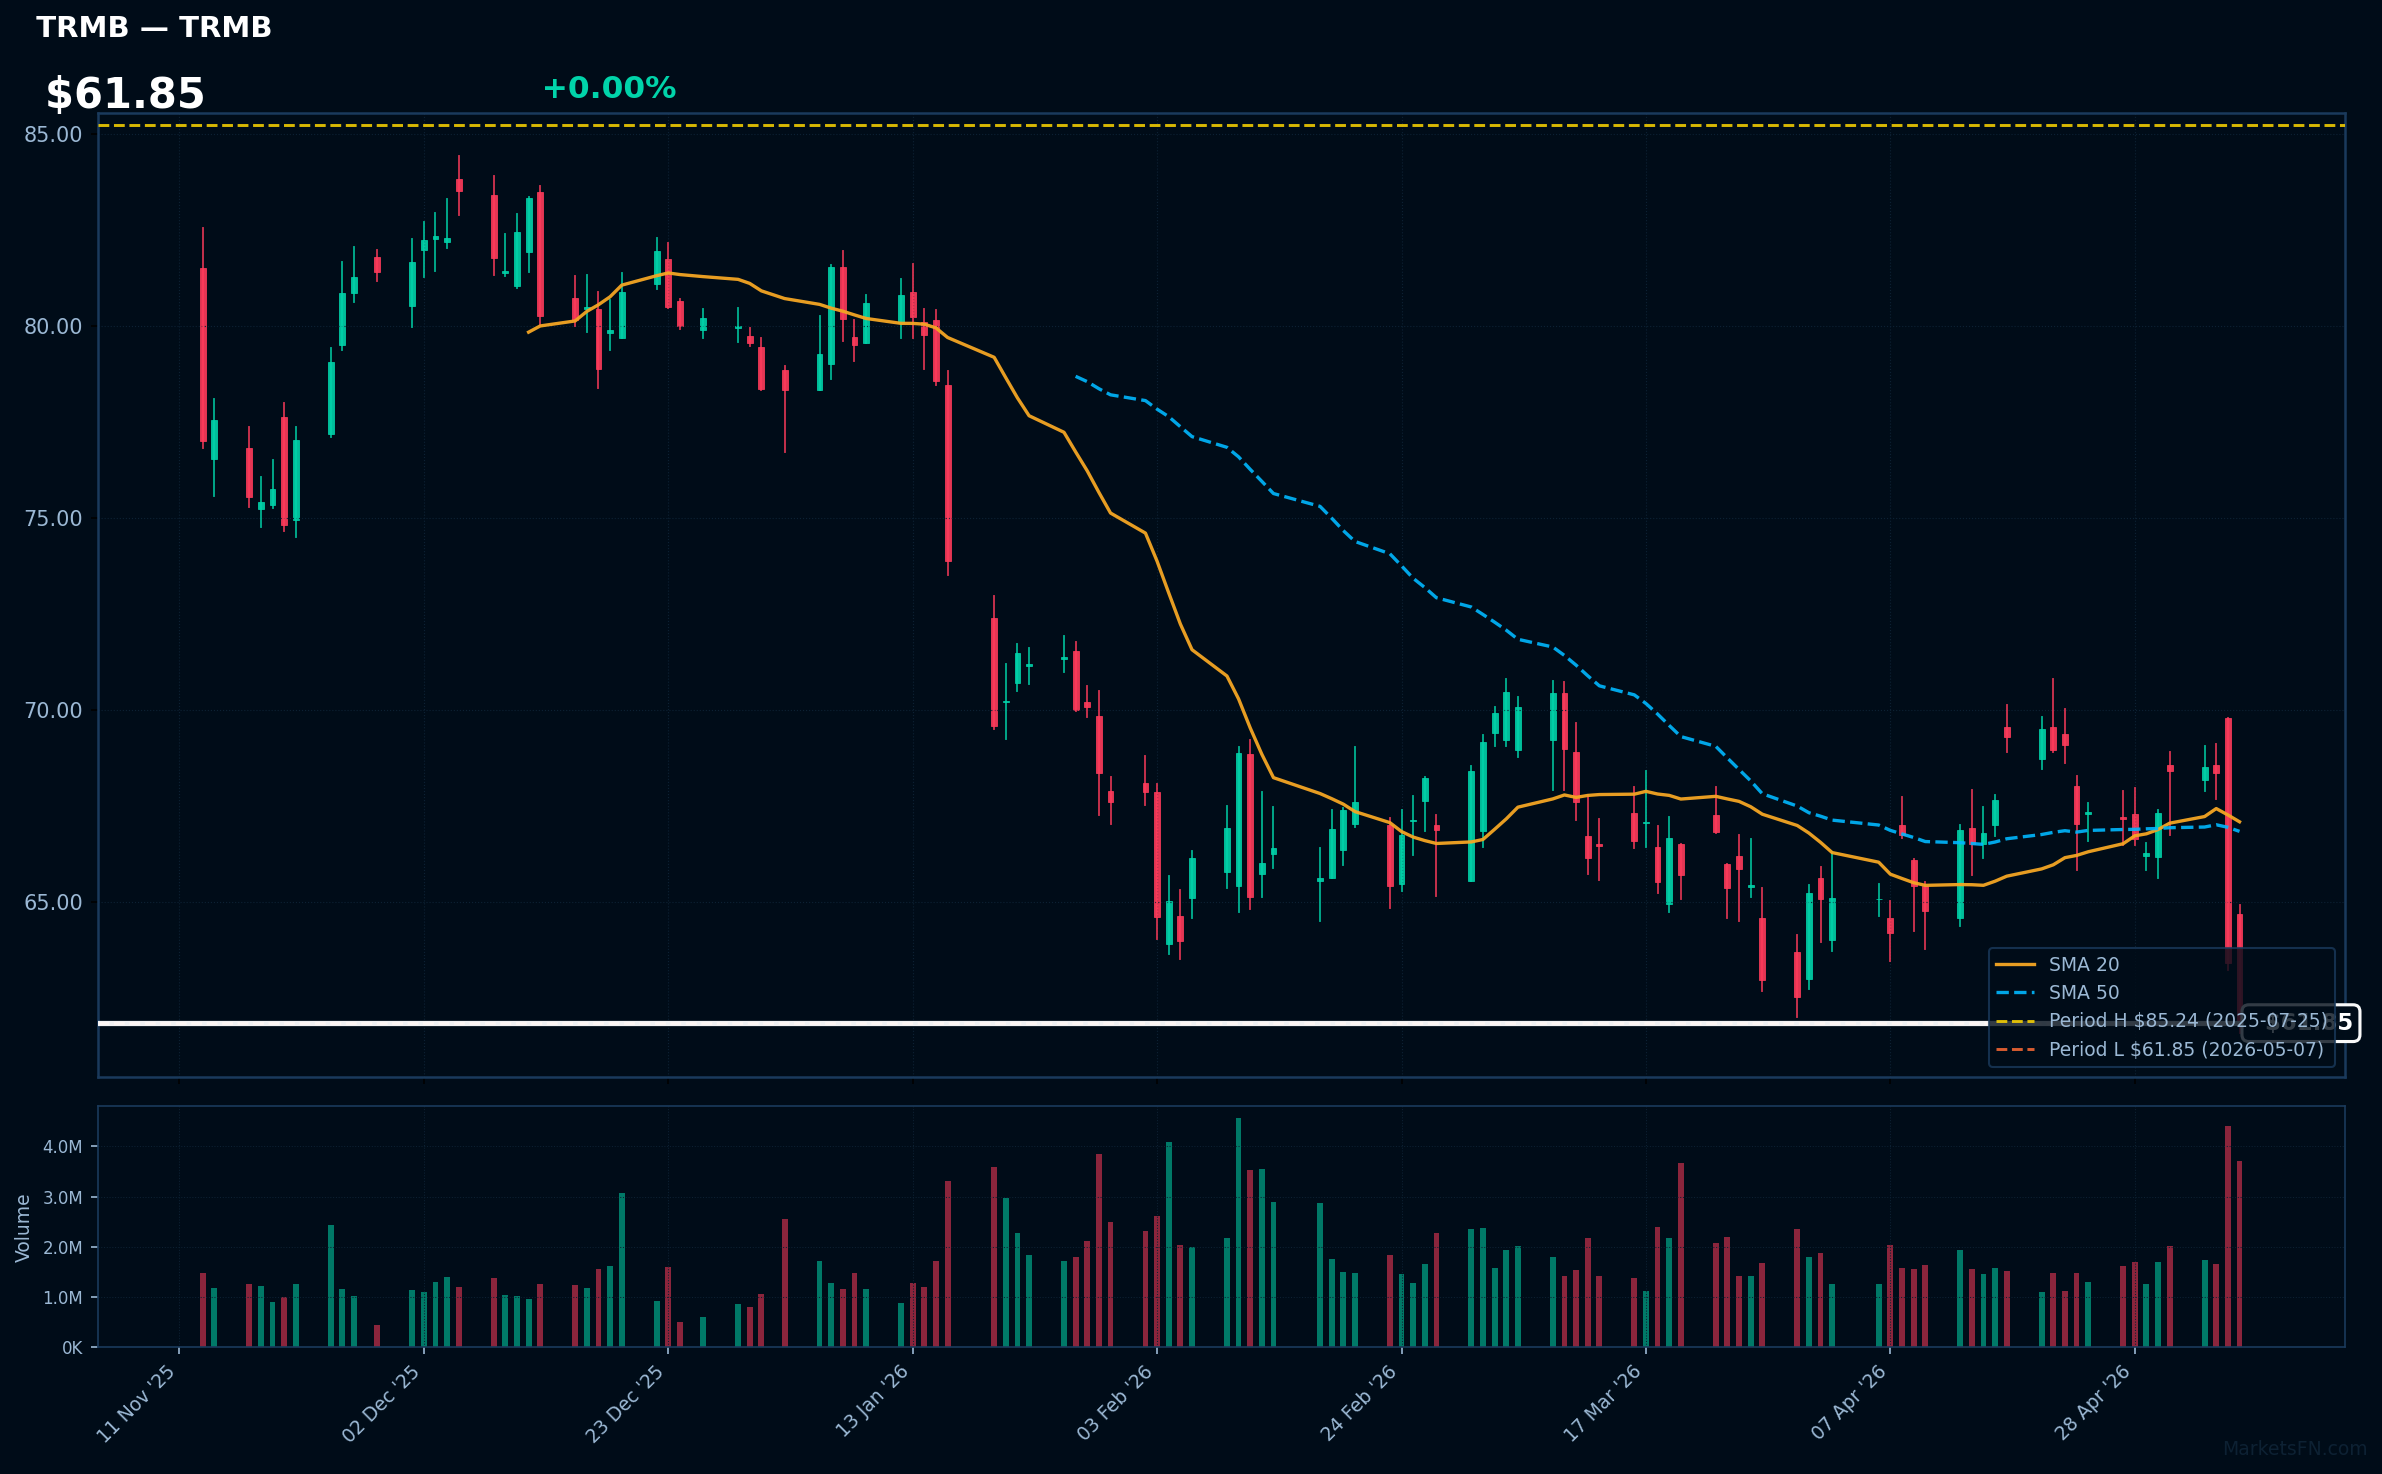
TRMB | Trimble Inc | Technology | Price Last: $61.85 | % Realized: -8.21% | RSI: 33.0 | % above MA200: -18.0% | Trend: Below MA20, MA50, MA200
Trimble Inc specializes in GPS and IoT technologies for construction, agriculture, and transportation, providing tools for precise positioning, data analytics, and fleet management. Investors should care because its solutions drive efficiency in growing sectors like smart farming and infrastructure, potentially yielding strong returns amid digital advancements.
Trimble's stock, at $61.85, is oversold (RSI 33.0) but below MA20/MA50/MA200, indicating a bearish trend. At its 52-week low with a -8.2% annual return, this appears more as a warning sign of weakness than momentum or fundamental strength, though oversold conditions suggest a possible rebound.
Related headlines
Market Commentary
The proximity of S&P 500 stocks like GOOG, QCOM, CVS, HWM, and GLW to their 52-week highs signals strong momentum in technology, semiconductors, healthcare, and industrials sectors, potentially driven by innovation, earnings growth, or favorable market conditions. Conversely, MCD, ZTS, TSCO, LDOS, and TRMB lingering near 52-week lows indicates sector-specific challenges, such as consumer spending pressures, regulatory hurdles, or economic slowdowns. This divergence may reflect broader market resilience in tech-driven areas amid consumer discretionary weaknesses.
Sector rotation appears evident, with tech stocks like GOOG and QCOM benefiting from AI advancements and chip demand, while healthcare (CVS) gains from recovery trends. Macro themes include persistent inflation impacting consumer stocks like MCD and TSCO, and geopolitical factors supporting aerospace (HWM). This suggests investors are favoring growth-oriented sectors over defensive ones, possibly in anticipation of rate cuts or economic stabilization.
Key levels to monitor include resistance above current highs for GOOG and QCOM, where breakouts could trigger rallies, and support below lows for MCD and ZTS, with potential rebounds if earnings beat expectations. Catalysts to watch are upcoming Q2 earnings, Federal Reserve decisions, and economic data releases, which could sway these stocks and influence broader market sentiment.
Methodology: All 503 S&P 500 constituents screened. 52-week high = highest daily close over the past 252 trading days (approx. 1 year). 52-week low = lowest daily close over the same period. Distance = (current price / extreme − 1) × 100. Technical indicators computed on up to 1 year of daily OHLCV data.
Disclaimer: For informational purposes only. Not investment advice. Past performance is not indicative of future results.