S&P 500 52-Week Highs & Lows Radar: NVIDIA (NVDA), Home Depot, (HD) and more
· market-analysis · MarketsFN Team
S&P 500 52-Week Highs & Lows Radar: NVIDIA (NVDA), Home Depot, (HD) and more
Screening all 503 S&P 500 constituents for stocks nearest to their 52-week high and their 52-week low. Data as of May 13, 2026. % Realized = 52-week total return.
Legend: RSI > 70 = overbought · RSI < 30 = oversold · Green % Realized = positive 52W return · Red = negative.
📈 Nearest to 52-Week High
Sectors represented: Technology (3), Healthcare (1), Basic Materials (1)
| Ticker | Company | Sector | Price Last | % Realized | 52-Week High Date | RSI | % above MA200 | Trend |
|---|---|---|---|---|---|---|---|---|
| NVDA | NVIDIA Corp | Technology | $223.44 | +71.97% | 2026-05-13 | 70.8 | +20.5% | Above MA20, MA50, MA200 |
| AAPL | Apple Inc | Technology | $295.52 | +38.79% | 2026-05-13 | 73.6 | +14.4% | Above MA20, MA50, MA200 |
| UNH | Unitedhealth Group Inc | Healthcare | $396.76 | +27.42% | 2026-05-13 | 84.7 | +24.3% | Above MA20, MA50, MA200 |
| CSCO | Cisco Systems, Inc | Technology | $100.23 | +62.24% | 2026-05-13 | 77.2 | +31.6% | Above MA20, MA50, MA200 |
| LIN | Linde Plc | Basic Materials | $512.94 | +13.82% | 2026-05-13 | 59.5 | +10.8% | Above MA20, MA50, MA200 |
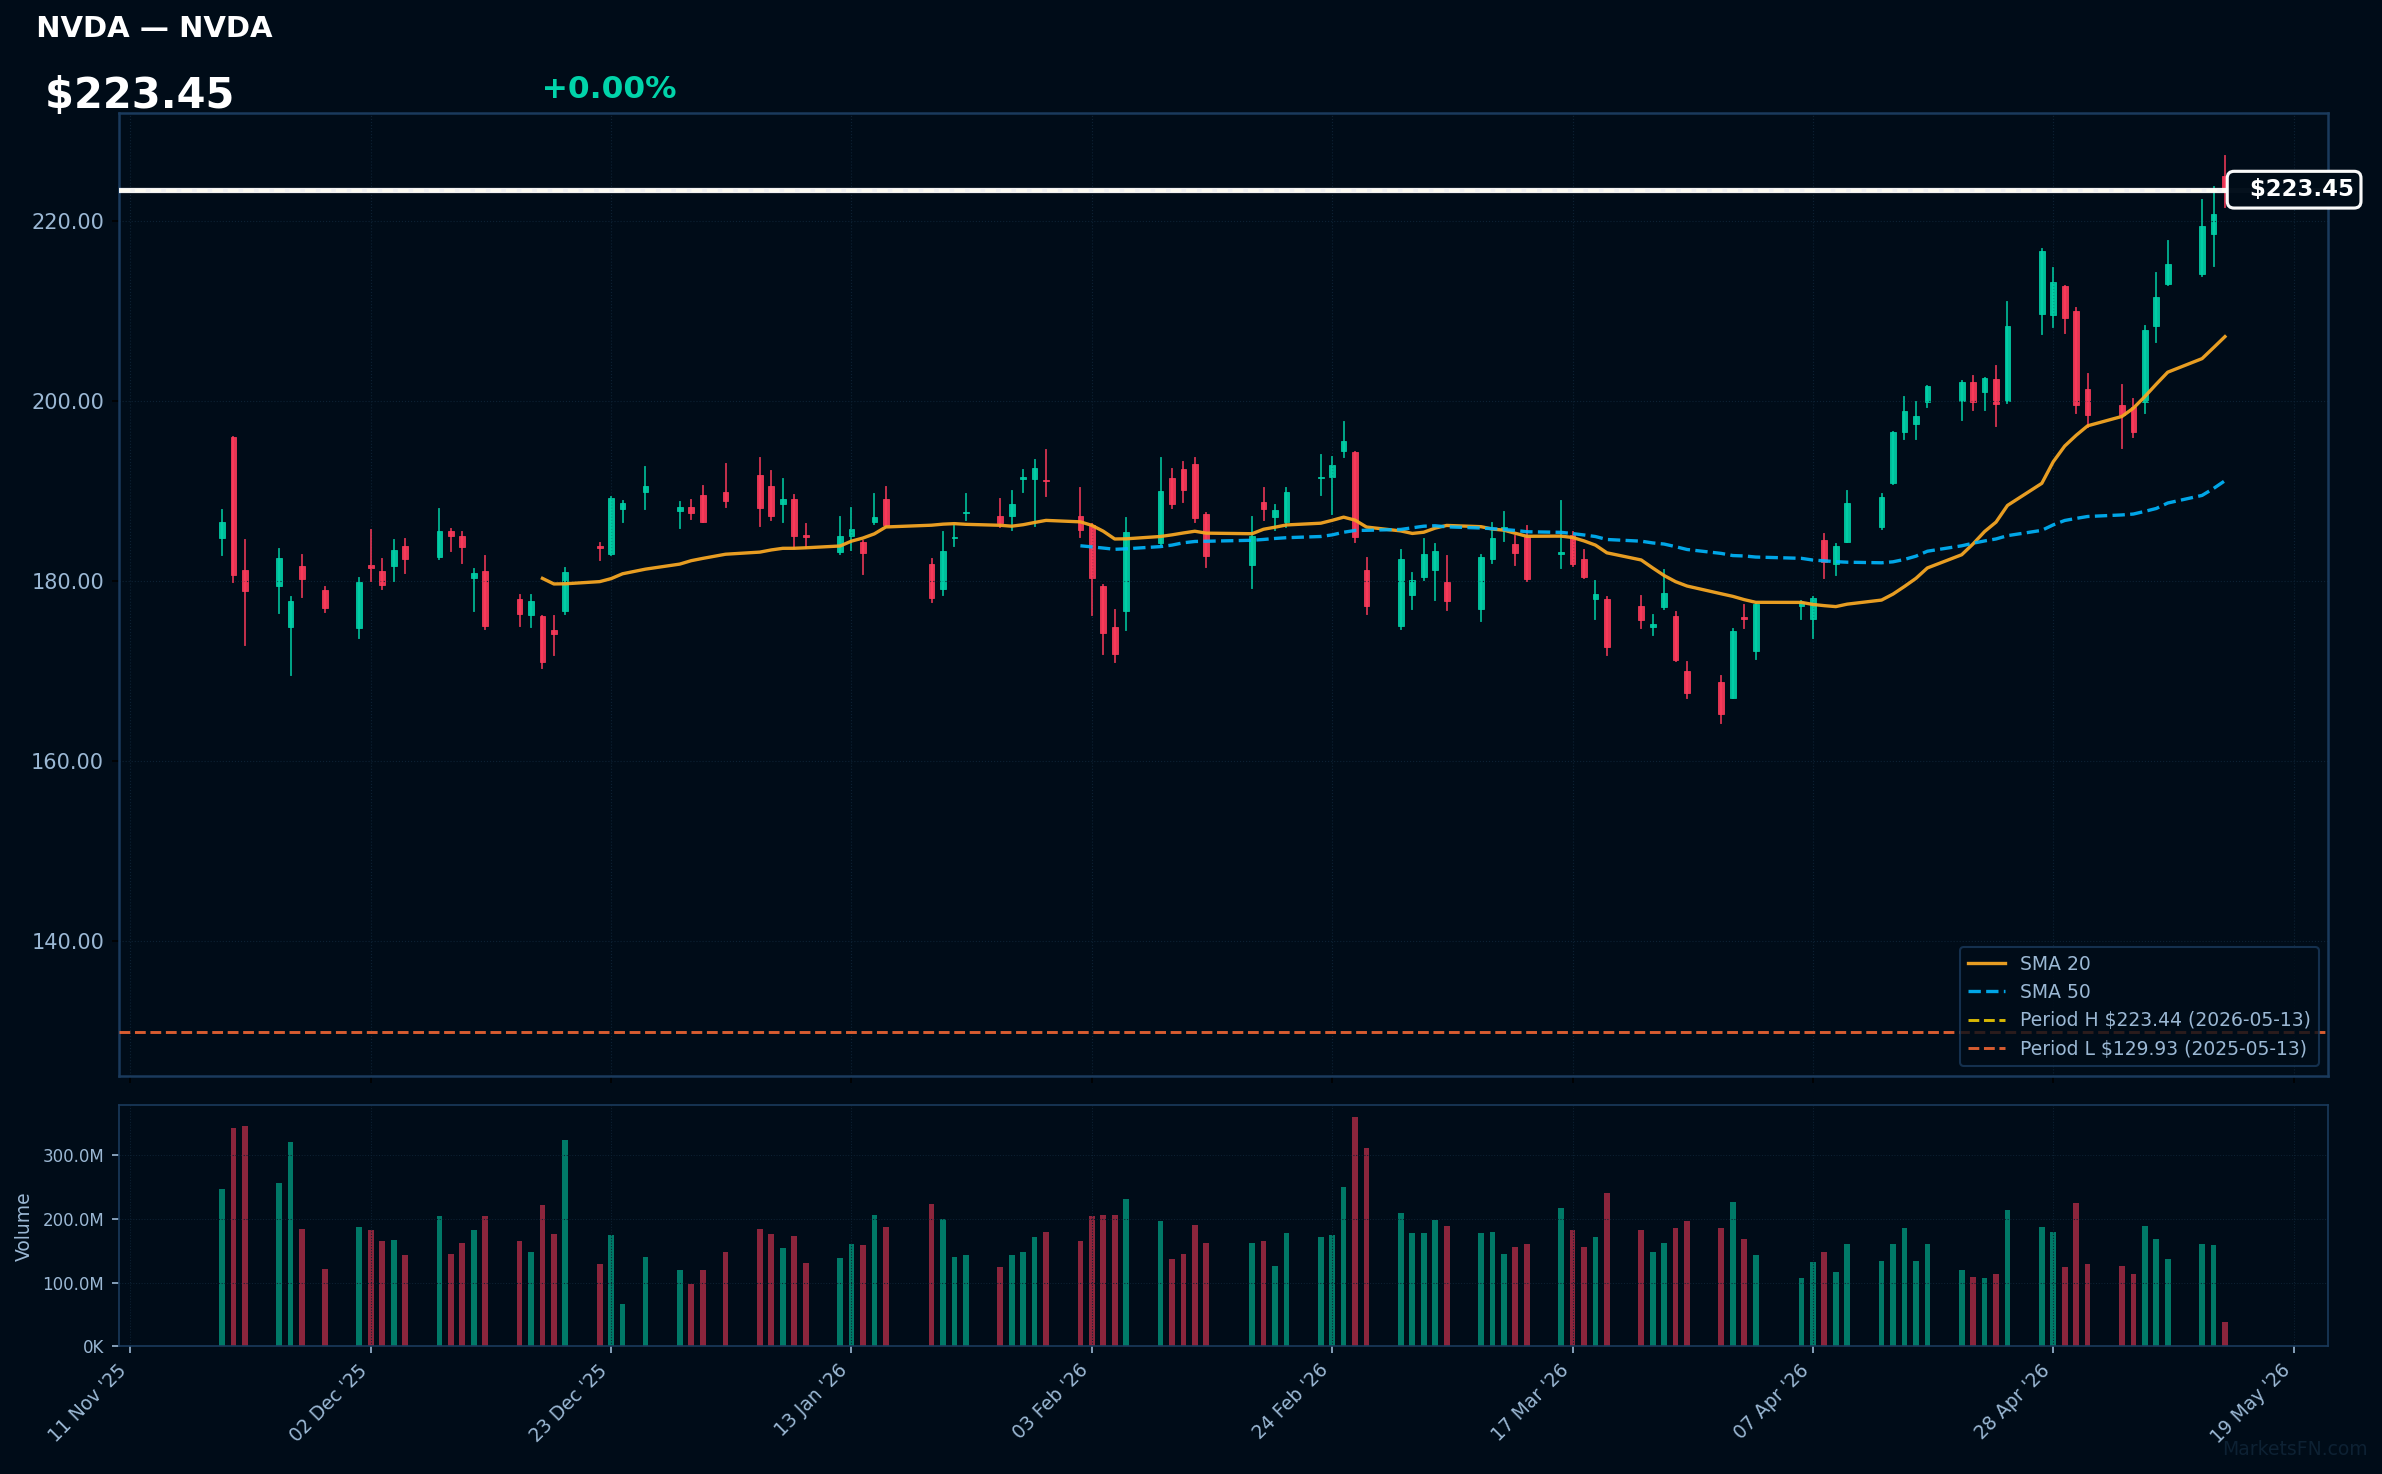
NVDA | NVIDIA Corp | Technology | Price Last: $223.44 | % Realized: +71.97% | RSI: 70.8 | % above MA200: +20.5% | Trend: Above MA20, MA50, MA200
NVIDIA designs and manufactures GPUs and AI accelerators crucial for gaming, data centers, autonomous vehicles, and AI applications. Investors should care due to its dominance in the AI chip market, driving explosive growth from high demand in tech sectors, leading to substantial revenue and stock surges.
RSI at 70.8 indicates overbought conditions amid a bullish MA alignment and 72.0% 52-week gain, with the stock at its 52-week high. This reflects strong momentum and fundamental strength from AI leadership, but could signal a warning for potential pullback.
Related headlines
- Stocks to Watch Wednesday: Nvidia, Walmart, Micron, Samsung
- Veteran Analyst Firm Resets Nvidia Stock Price Target Ahead of Earnings
- Stock Market Today: Dow Dips But Techs Rally As Trump-Xi Summit Looms; Nvidia, Micron, Intel Rise (Live Coverage)
- Trump lands in China for Xi summit with Nvidia CEO in tow
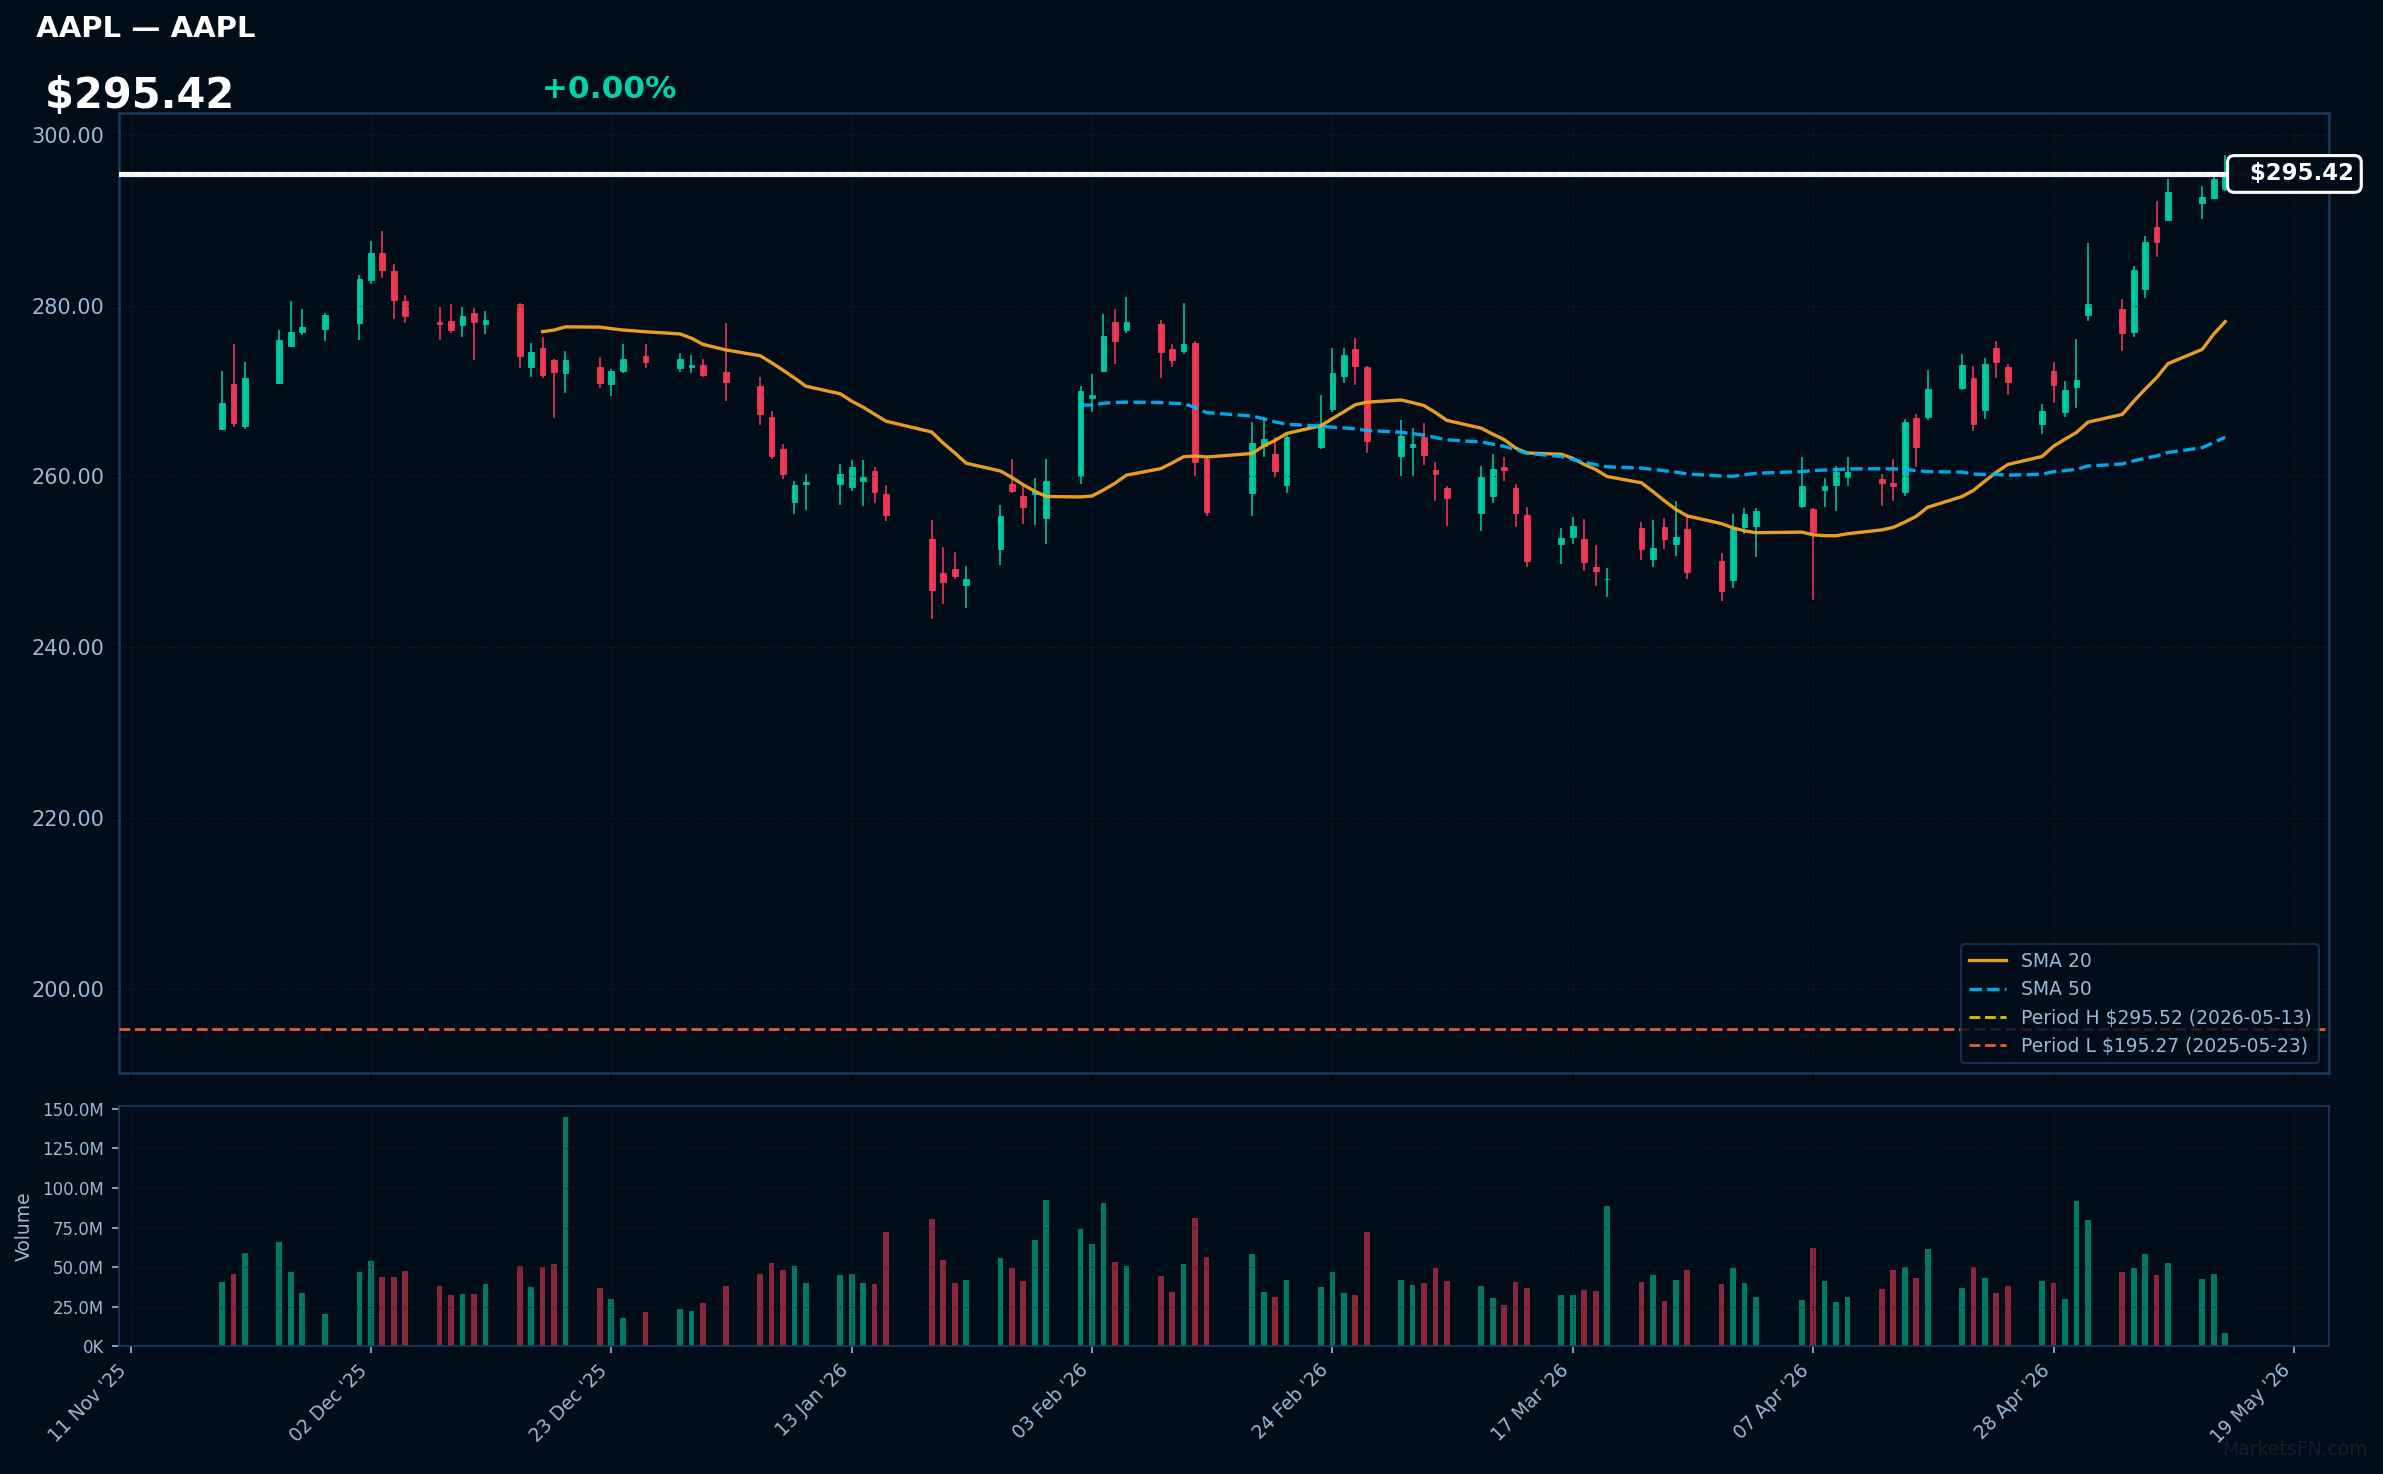
AAPL | Apple Inc | Technology | Price Last: $295.52 | % Realized: +38.79% | RSI: 73.6 | % above MA200: +14.4% | Trend: Above MA20, MA50, MA200
Apple designs and manufactures hardware like iPhones and iPads, and provides services such as the App Store and iCloud, fostering a massive ecosystem. Investors should care because this drives recurring revenue, high profits from innovation, and strong cash flows for dividends and buybacks, making it a resilient tech leader.
With RSI at 73.6 indicating overbought conditions, and bullish MA alignment (price > MA20 > MA50 > MA200), Apple's stock is at its 52-week high after a 38.8% return. This reflects momentum and fundamental strength, but the overbought RSI warns of potential pullback despite record levels.
Related headlines
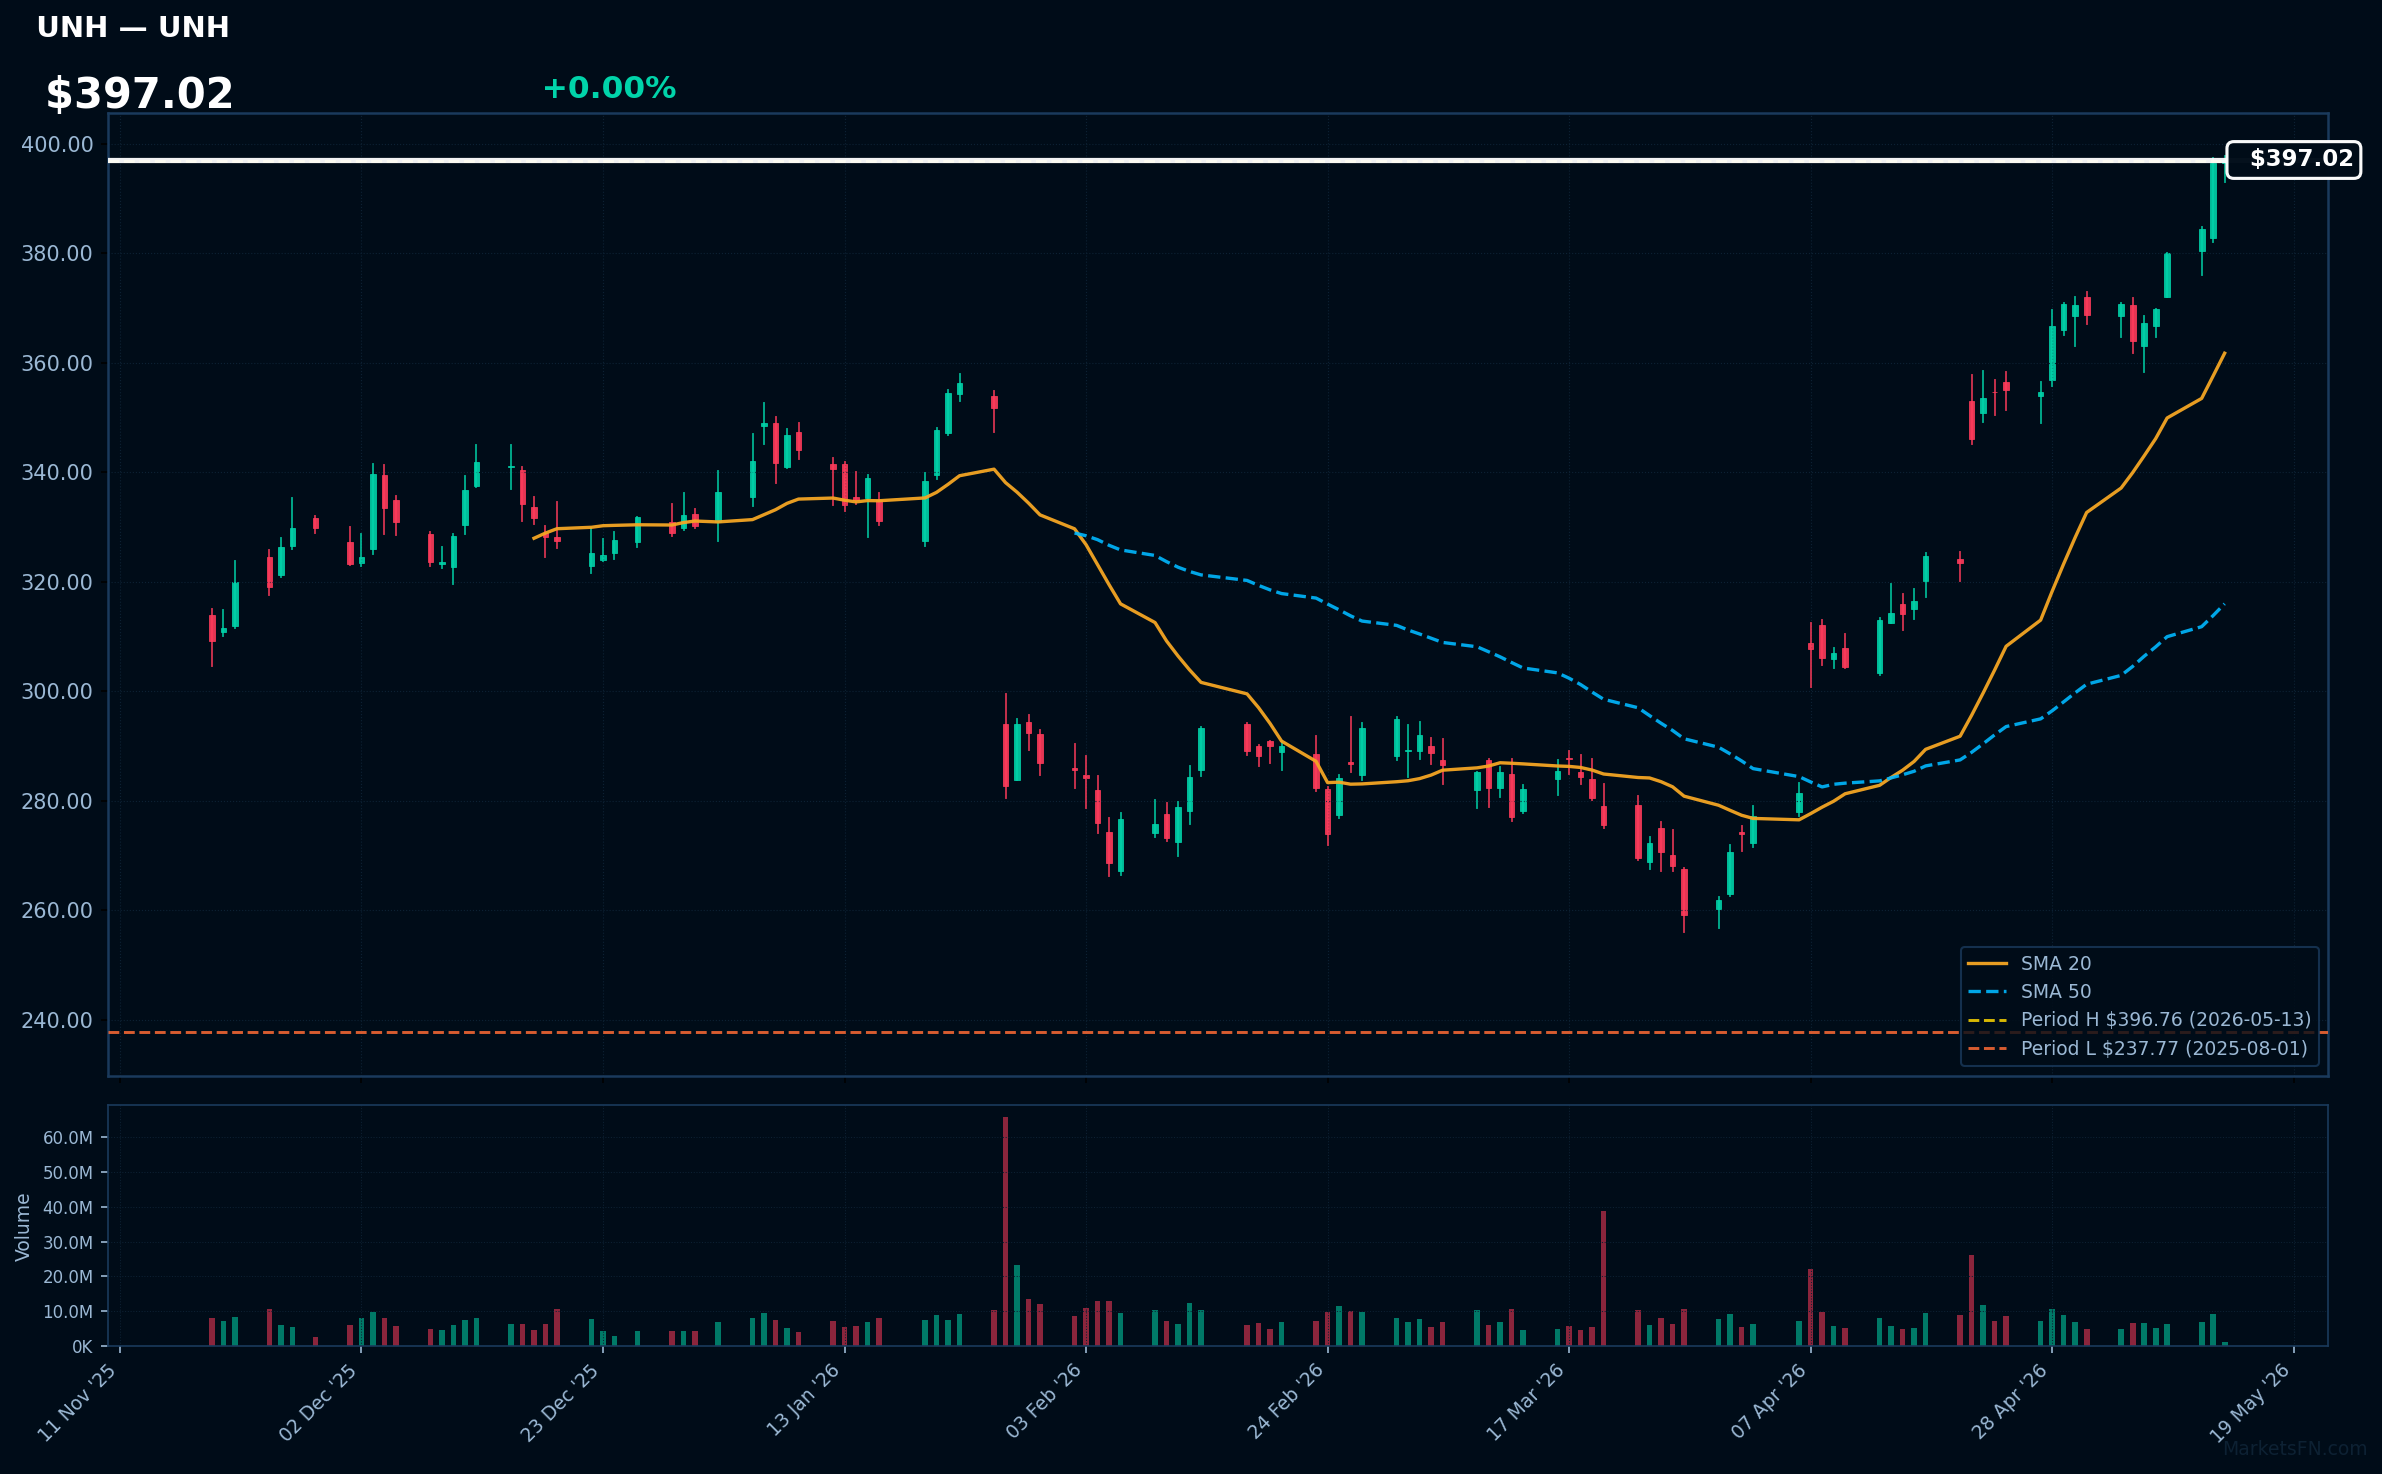
UNH | Unitedhealth Group Inc | Healthcare | Price Last: $396.76 | % Realized: +27.42% | RSI: 84.7 | % above MA200: +24.3% | Trend: Above MA20, MA50, MA200
UnitedHealth Group Inc operates UnitedHealthcare for health insurance and Optum for services like pharmacy benefits and health data analytics. Investors should care due to its exposure to growing healthcare demands from aging populations, consistent revenue streams, and strong financial performance driving shareholder returns.
UNH's RSI at 84.7 indicates overbought conditions, suggesting potential pullback, while price above MA20/50/200 shows bullish momentum. At 0.0% below its 52-week high, near record levels, and with 27.4% annual return, this could signal fundamental strength or a warning of overextension amid mixed signals.
Related headlines
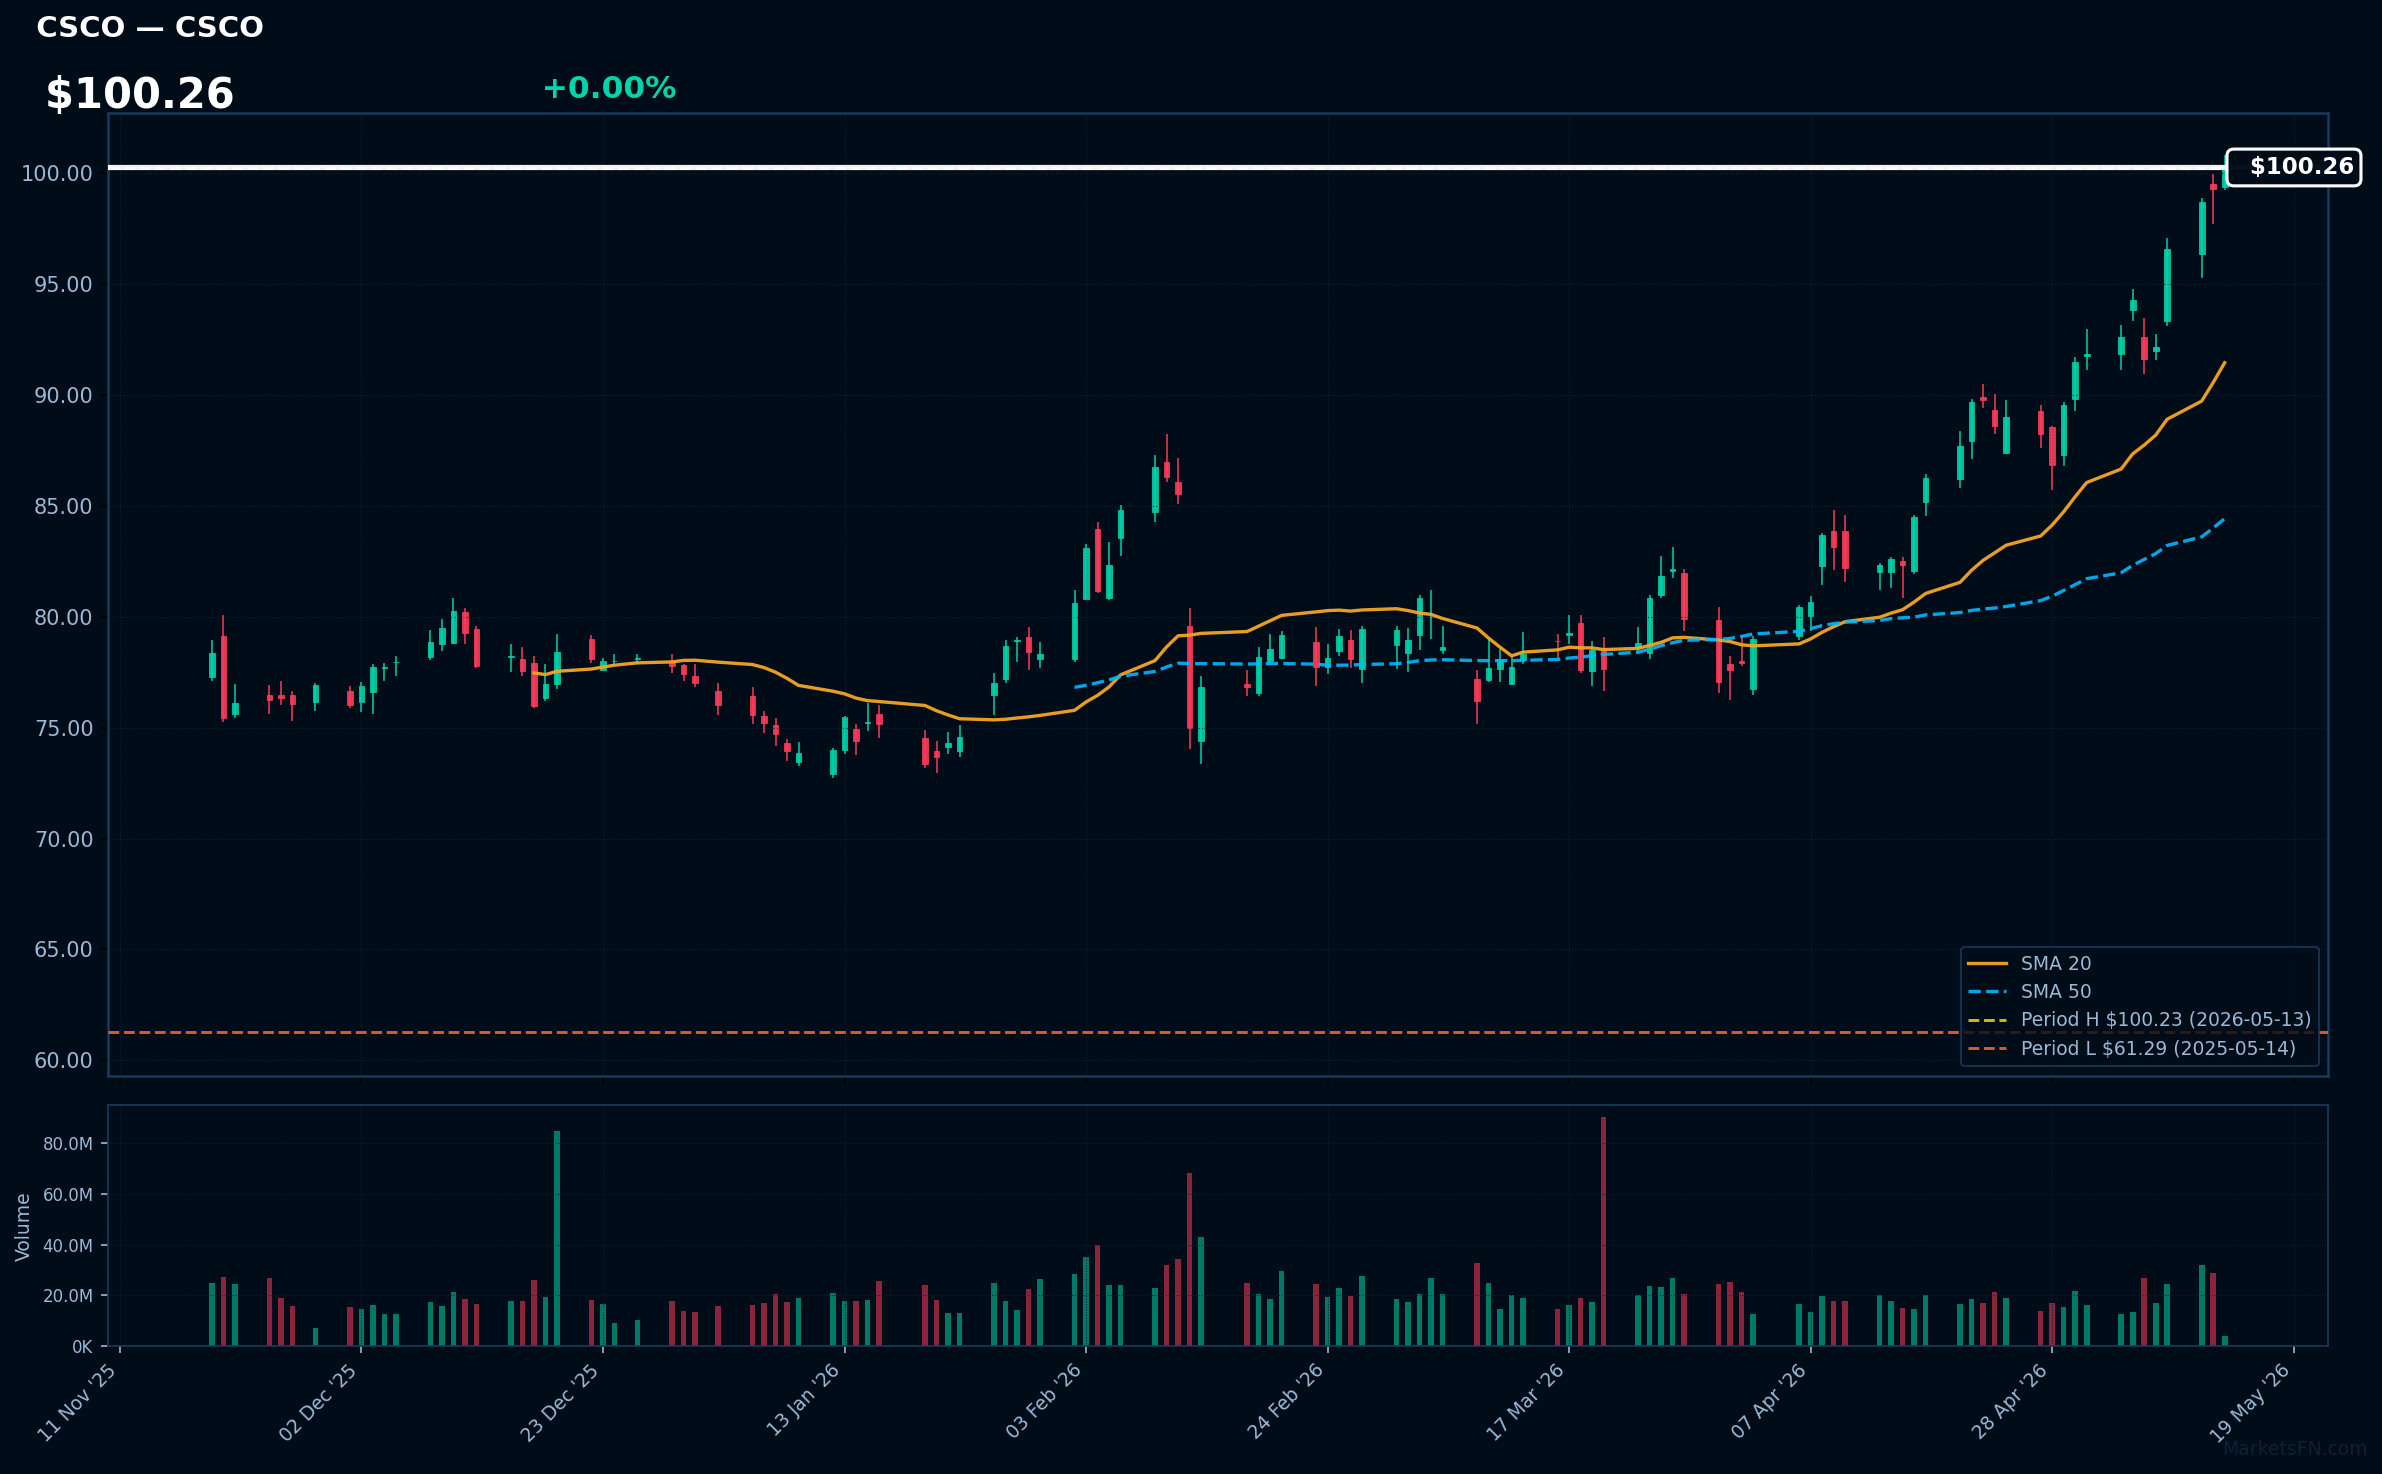
CSCO | Cisco Systems, Inc | Technology | Price Last: $100.23 | % Realized: +62.24% | RSI: 77.2 | % above MA200: +31.6% | Trend: Above MA20, MA50, MA200
Cisco Systems designs and sells networking hardware, software, and services that enable internet connectivity, data security, and cloud operations for businesses worldwide. Investors should care due to its leadership in cybersecurity and IoT, providing reliable dividends and growth from digital infrastructure demands.
RSI at 77.2 indicates overbought conditions, while bullish MA alignment and 62.2% 52-week return show strong momentum near the record high. This likely reflects fundamental strength in networking, but could warn of a potential pullback if overextended.
Related headlines
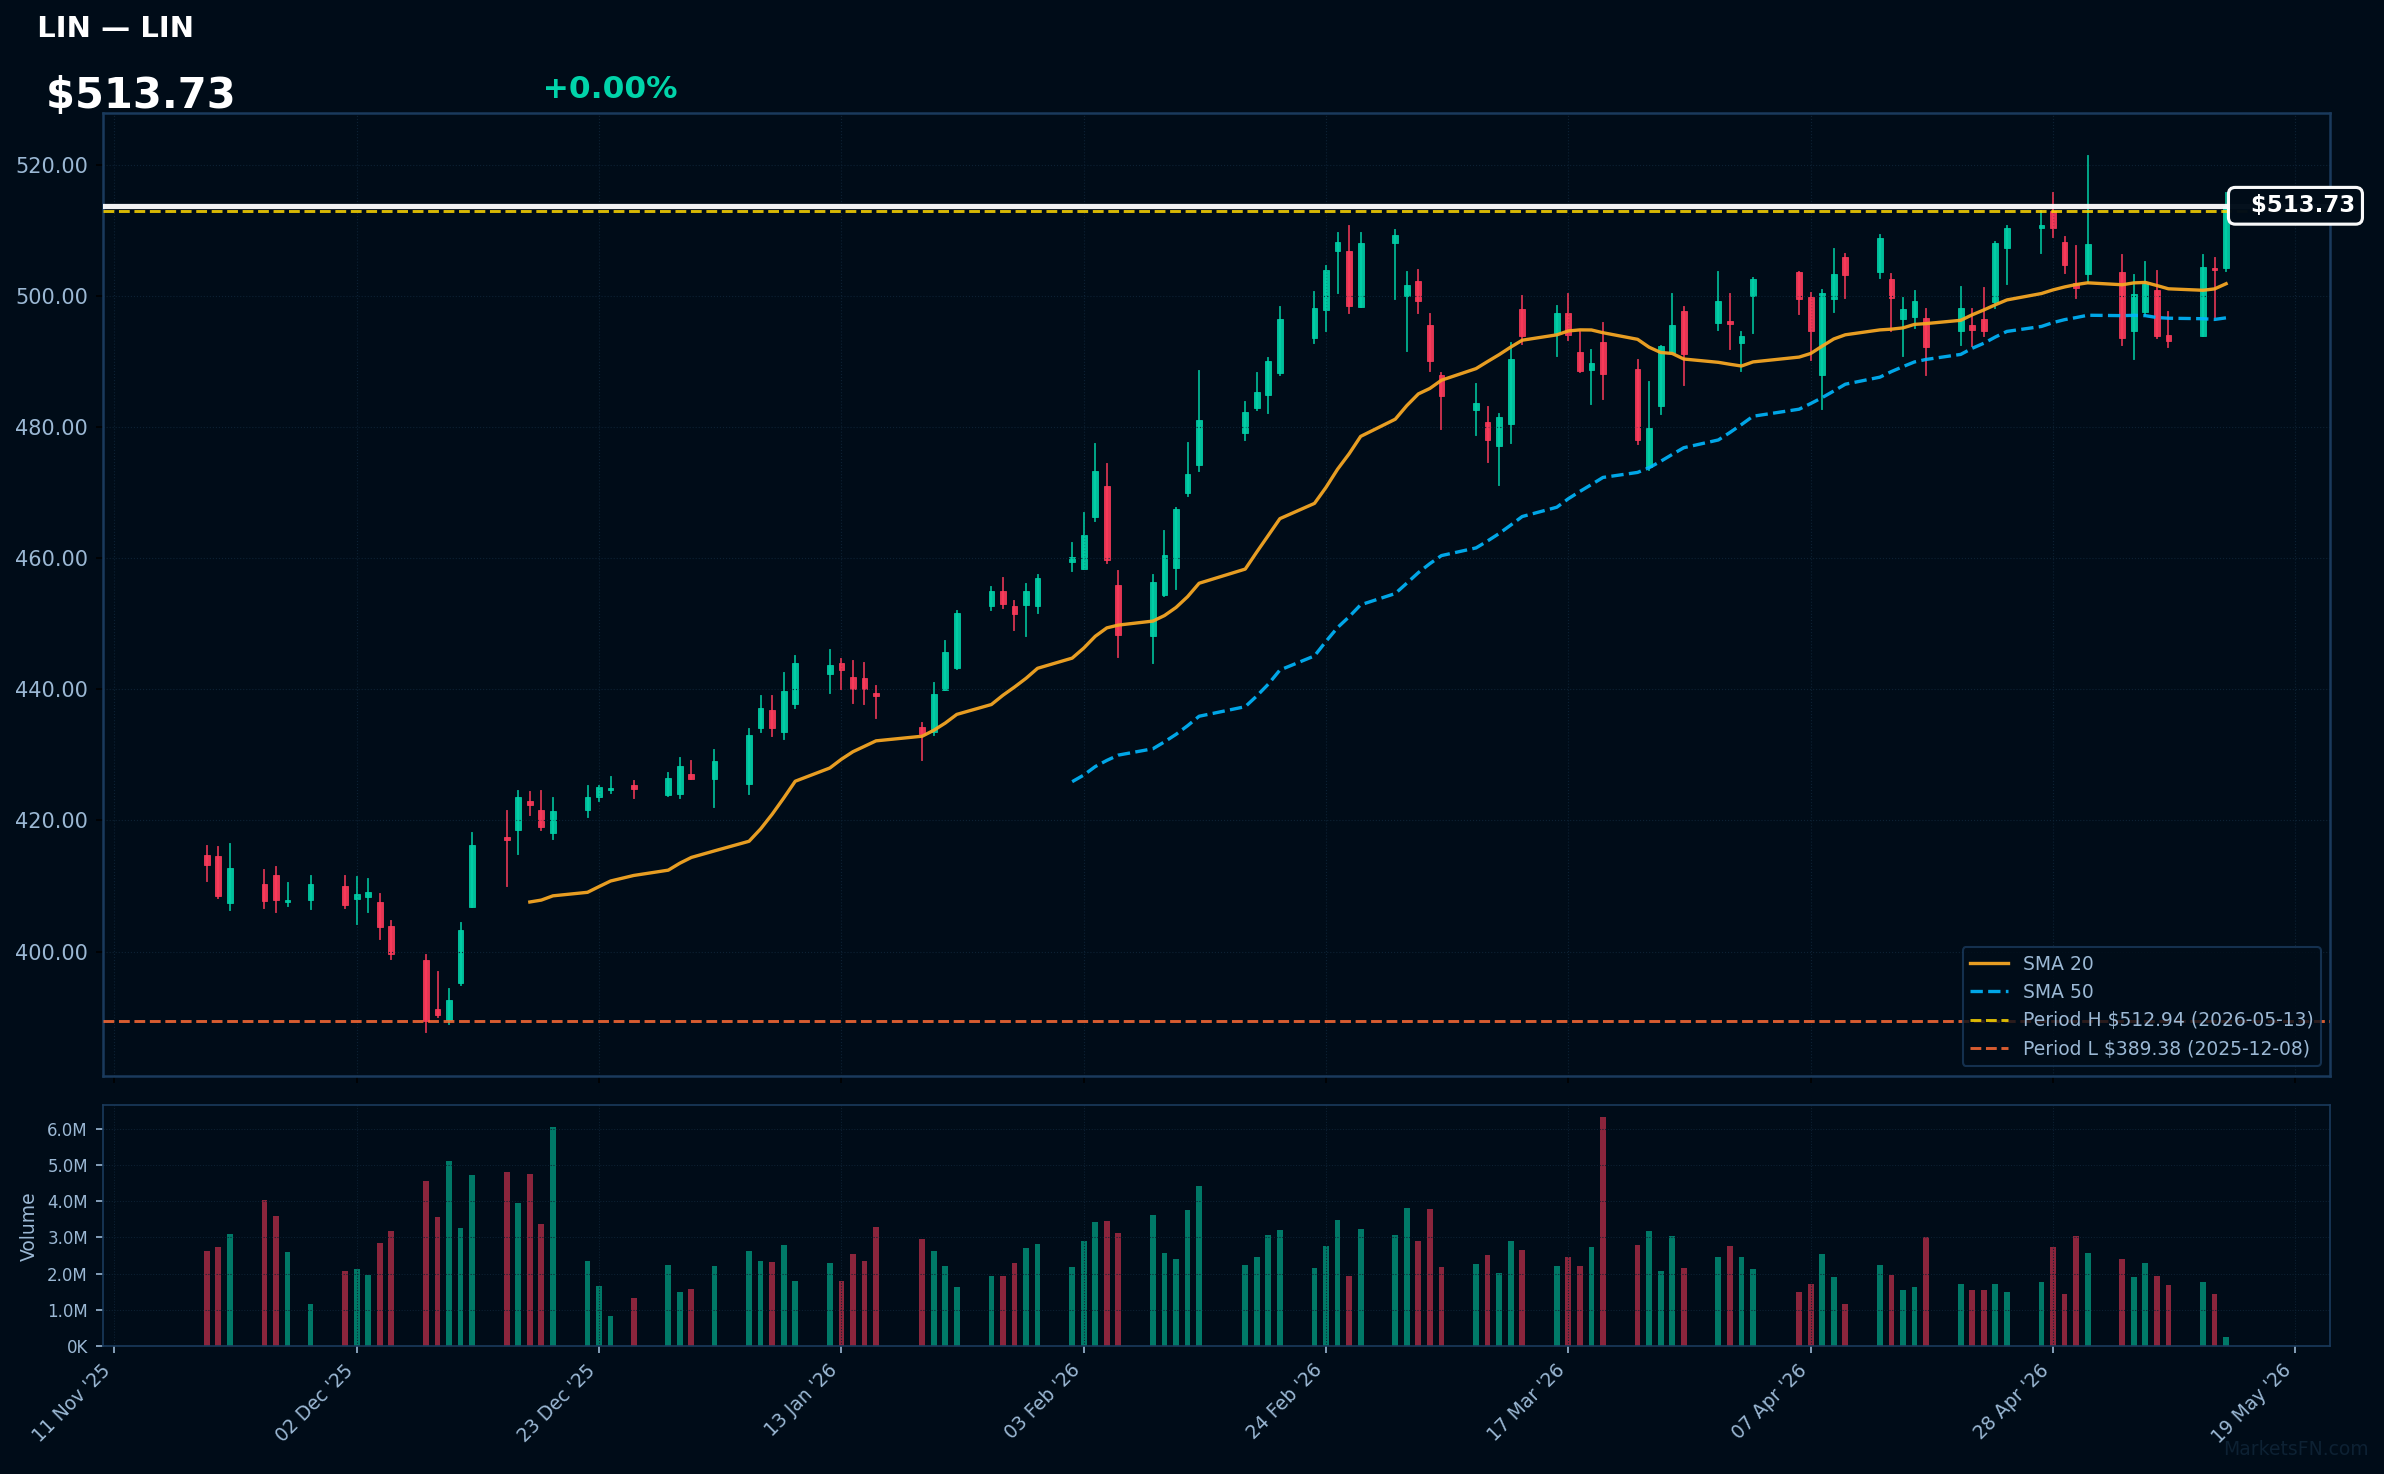
LIN | Linde Plc | Basic Materials | Price Last: $512.94 | % Realized: +13.82% | RSI: 59.5 | % above MA200: +10.8% | Trend: Above MA20, MA50, MA200
Linde Plc is a leading industrial gases supplier, producing oxygen, nitrogen, hydrogen, and more for sectors like healthcare, manufacturing, and electronics. Investors should care due to its dominant market position, stable demand from essential industries, and growth in clean energy solutions like hydrogen, offering reliable revenue and innovation potential.
With RSI at 59.5 and bullish MA alignment (price > MA20 > MA50 > MA200), Linde's stock is in a sustained uptrend, 0.0% below its 52-week high after a 13.8% annual return. This indicates momentum and possible fundamental strength from industrial demand, but near record levels could signal overbought risks.
Related headlines
📉 Nearest to 52-Week Low
Sectors represented: Consumer Cyclical (2), Technology (2), Healthcare (1)
| Ticker | Company | Sector | Price Last | % Realized | 52-Week Low Date | RSI | % above MA200 | Trend |
|---|---|---|---|---|---|---|---|---|
| HD | Home Depot, Inc | Consumer Cyclical | $304.82 | -18.41% | 2026-05-13 | 32.9 | -17.3% | Below MA20, MA50, MA200 |
| IBM | International Business Machines Corp | Technology | $214.32 | -17.12% | 2026-05-13 | 32.4 | -20.9% | Below MA20, MA50, MA200 |
| ACN | Accenture plc | Technology | $163.05 | -49.45% | 2026-05-13 | 28.7 | -31.0% | Below MA20, MA50, MA200 |
| DHR | Danaher Corp | Healthcare | $166.12 | -15.51% | 2026-05-13 | 25.6 | -20.0% | Below MA20, MA50, MA200 |
| NKE | Nike, Inc | Consumer Cyclical | $41.96 | -32.75% | 2026-05-13 | 30.7 | -33.1% | Below MA20, MA50, MA200 |
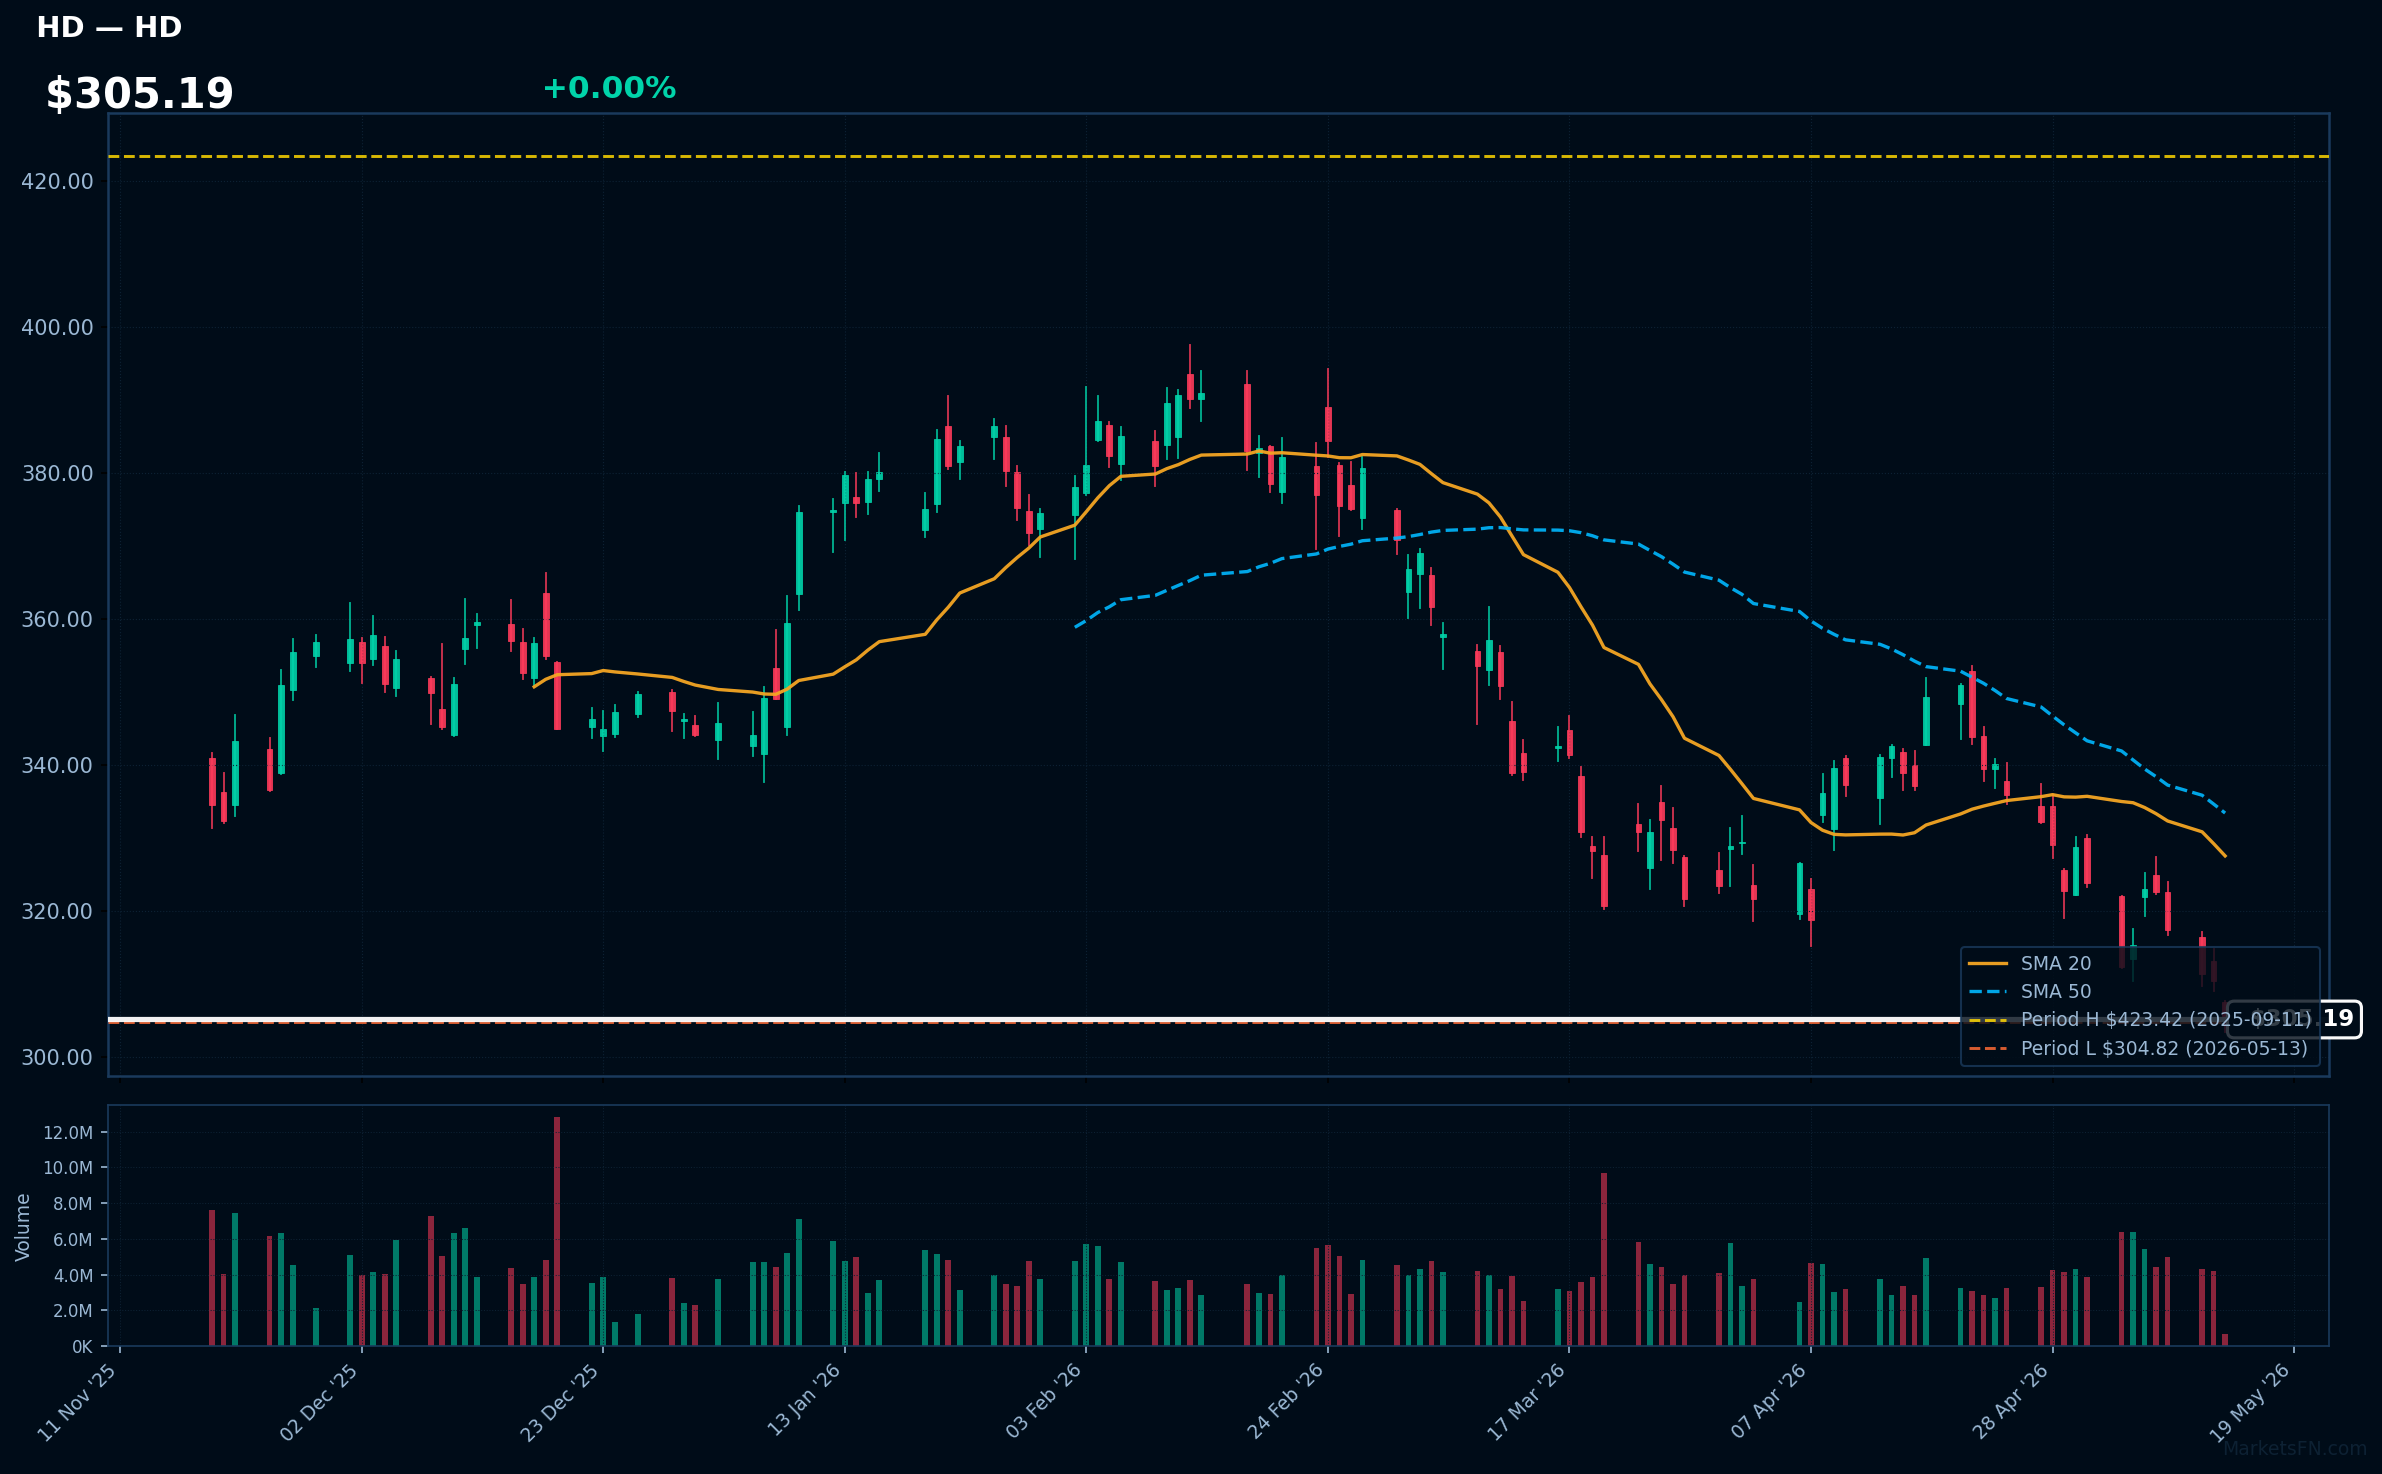
HD | Home Depot, Inc | Consumer Cyclical | Price Last: $304.82 | % Realized: -18.41% | RSI: 32.9 | % above MA200: -17.3% | Trend: Below MA20, MA50, MA200
Home Depot is the largest US home improvement retailer, selling tools, building materials, and services for DIY and professional use. Investors should care due to its dominant market share, consistent dividend payouts, and sensitivity to housing trends, offering growth potential in a recovering economy.
HD at $305.19 shows RSI 32.9 (oversold) and bearish MA alignment (price < MA20 < MA50 < MA200), indicating a sustained downtrend. At its 52-week low with -18.4% return, this could be a warning sign of weakness rather than fundamental strength, despite solid operations.
Related headlines
- Cash-strapped homeowners may soon have no choice but to repair their aging houses
- How Home Depot is crafting content on the road to the World Cup
- Home Improvement Spend Is, Well, Improving. Lowe's Stock Looks Cheap.
- Inside Home Depots marketing playbook: weather signals, influencers, and an app to drive bigger baskets
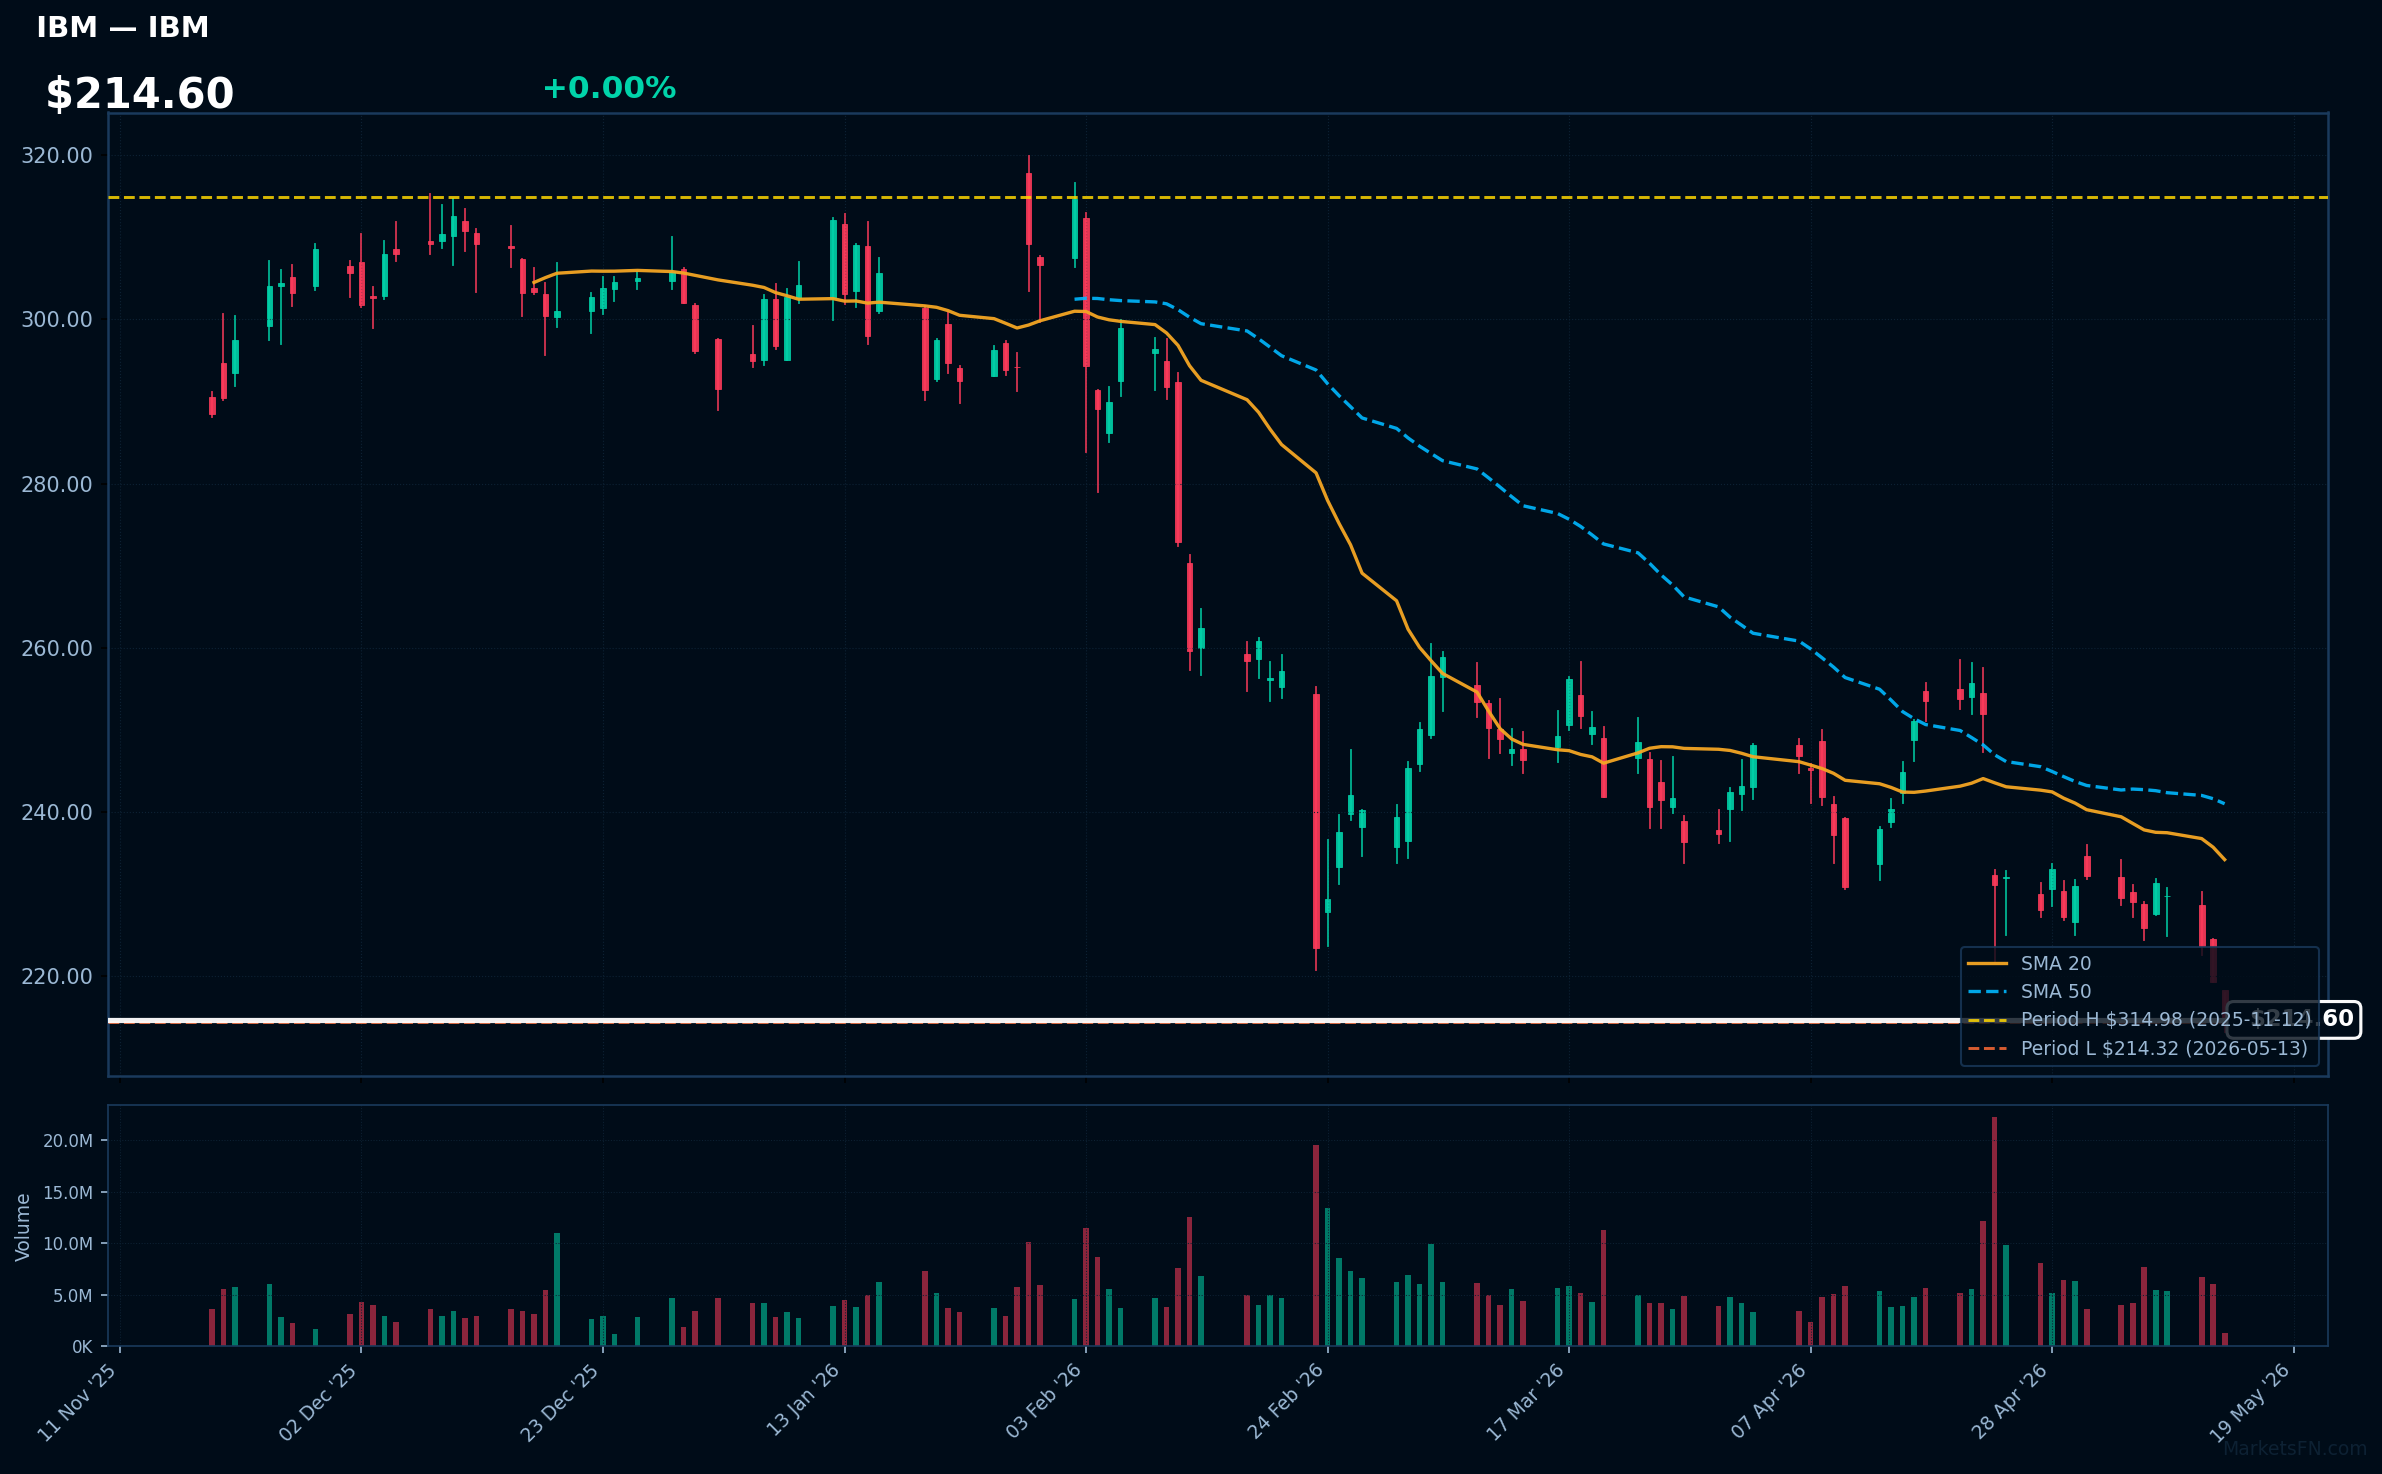
IBM | International Business Machines Corp | Technology | Price Last: $214.32 | % Realized: -17.12% | RSI: 32.4 | % above MA200: -20.9% | Trend: Below MA20, MA50, MA200
IBM develops and sells hardware, software, and services focused on AI (e.g., Watson), cloud computing, quantum technology, and cybersecurity. Investors should care due to its steady dividends, large enterprise contracts, and innovation in high-growth areas like AI, offering stability and potential upside amid tech shifts.
IBM's RSI at 32.4 signals oversold conditions, but bearish MA alignment (price < MA20 < MA50 < MA200) confirms a downtrend. At its 52-week low with -17.1% return, this is likely a warning sign of fundamental concerns rather than short-term momentum or strength.
Related headlines
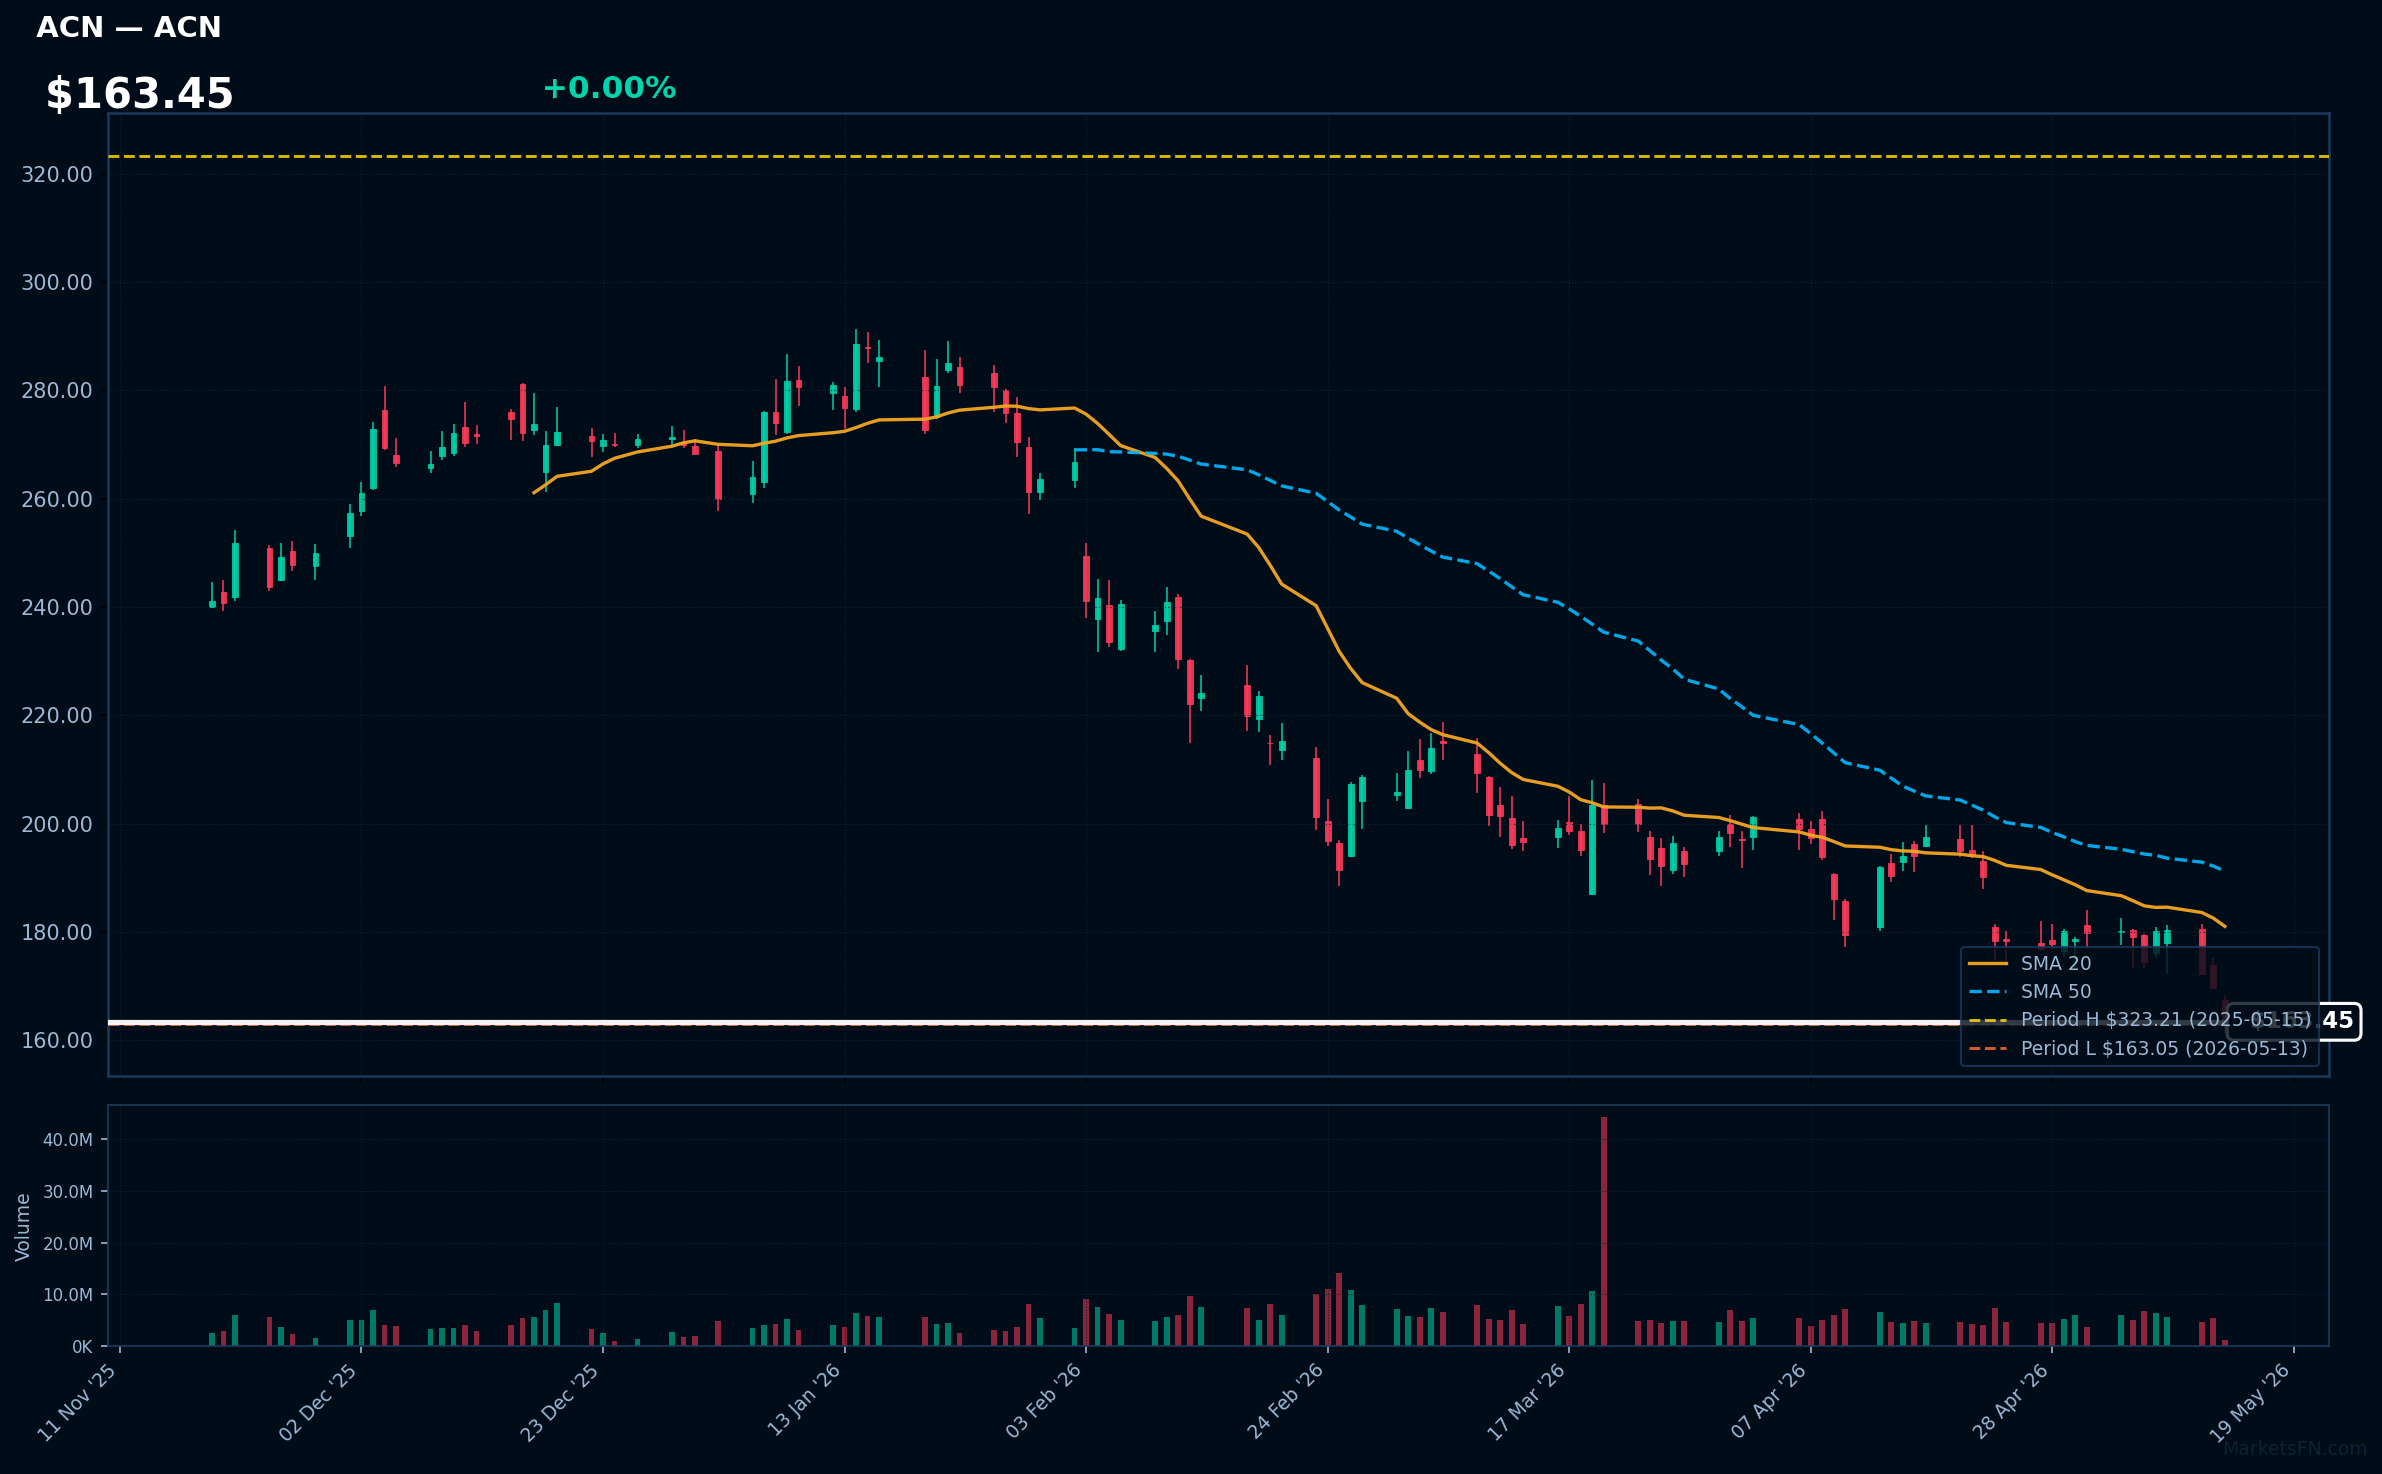
ACN | Accenture plc | Technology | Price Last: $163.05 | % Realized: -49.45% | RSI: 28.7 | % above MA200: -31.0% | Trend: Below MA20, MA50, MA200
Accenture plc provides consulting, technology, and outsourcing services to help companies innovate in digital, cloud, and AI areas. Investors should care due to its role in driving business transformations, consistent revenue from a global client base, and resilience in tech-driven economies, offering growth potential amid market volatility.
Accenture's stock, at $163.45, shows a sustained downtrend with RSI at 28.7 (oversold) and price below MA20, MA50, and MA200. At its 52-week low with a -49.4% annual return, this could indicate fundamental weaknesses or an oversold rebound opportunity, serving as a warning sign for investors.
Related headlines
- ServiceNow, Accenture partner to deliver agentic AI at enterprise scale
- Accenture Partners with the WTA to Help Build the Future of Womens Tennis
- ServiceNow and Accenture launch forward deployed engineering program to scale agentic AI across the enterprise
- Accenture Invests in Netomi to Accelerate Enterprise Adoption of Agentic AI for Customer Experience
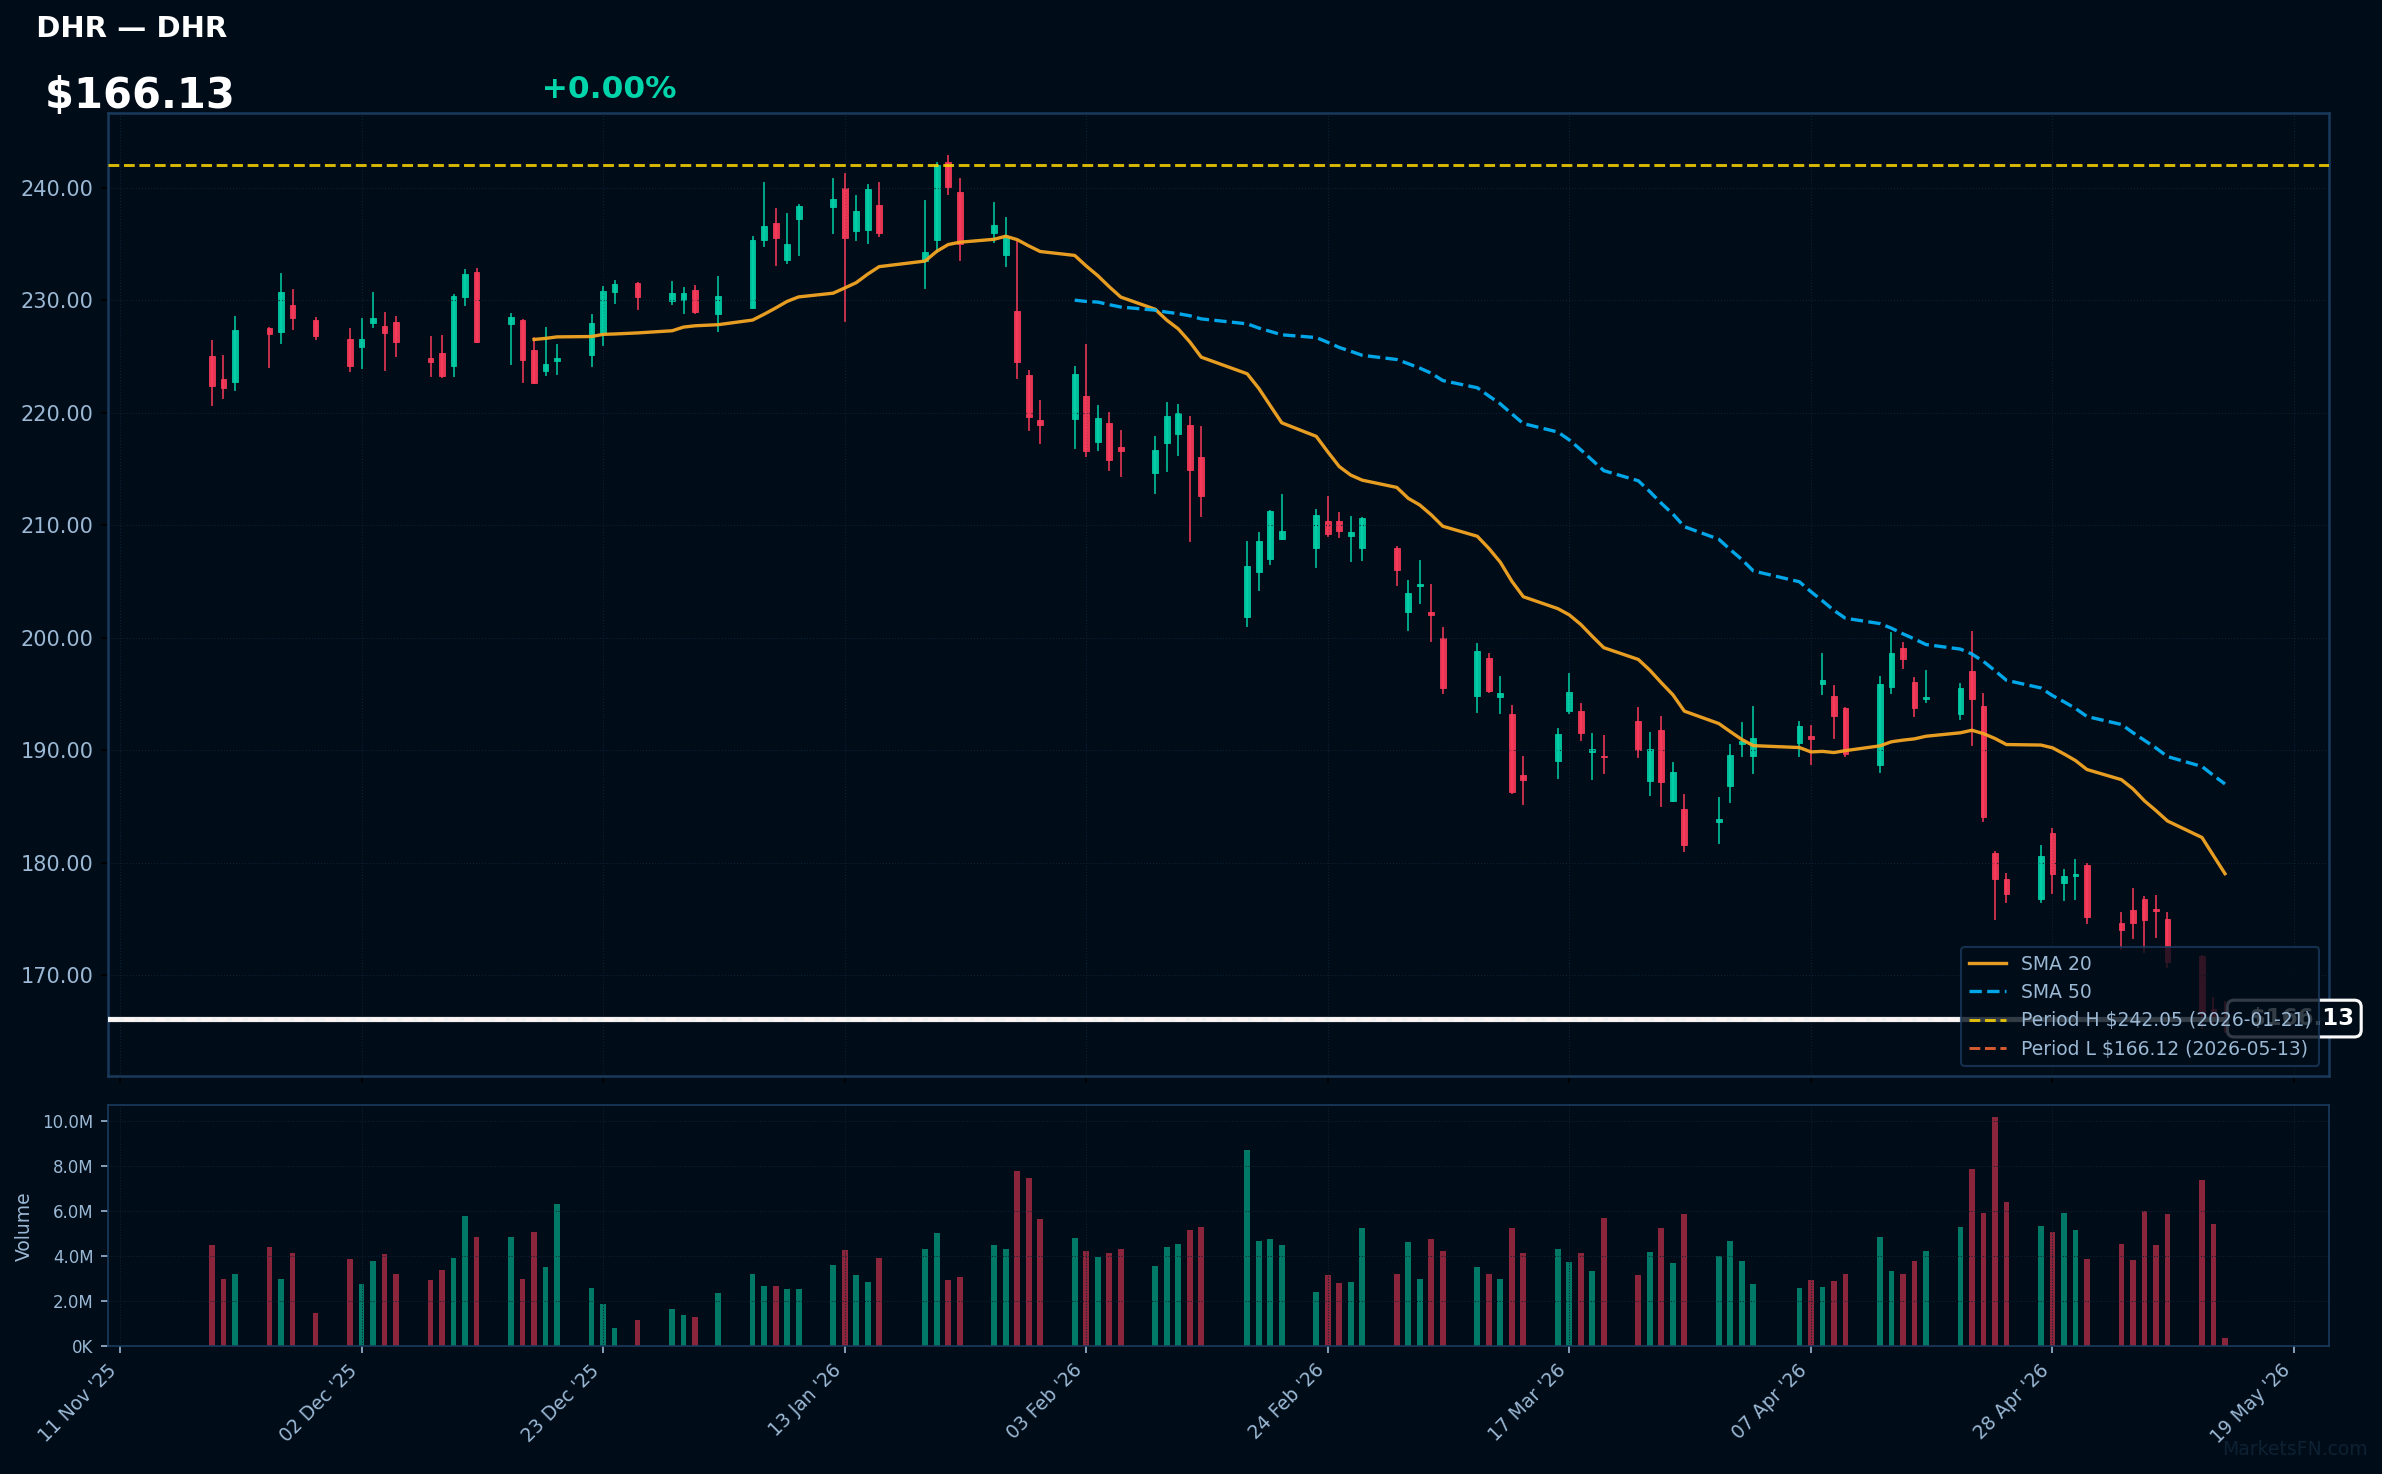
DHR | Danaher Corp | Healthcare | Price Last: $166.12 | % Realized: -15.51% | RSI: 25.6 | % above MA200: -20.0% | Trend: Below MA20, MA50, MA200
Danaher Corp designs, manufactures, and markets scientific instruments, diagnostics, and life sciences tools, including biotech consumables and environmental solutions. Investors should care due to its Danaher Business System for operational excellence, consistent acquisitions driving growth, and essential products in healthcare that provide recession-resistant revenue streams.
With RSI at 25.6 signaling oversold conditions and bearish MA alignment (price below MA20, MA50, and MA200), DHR is at its 52-week low, down 15.5% annually, indicating a sustained downtrend. This appears more a warning sign of momentum weakness than fundamental strength, suggesting potential risks despite possible rebound opportunities.
Related headlines
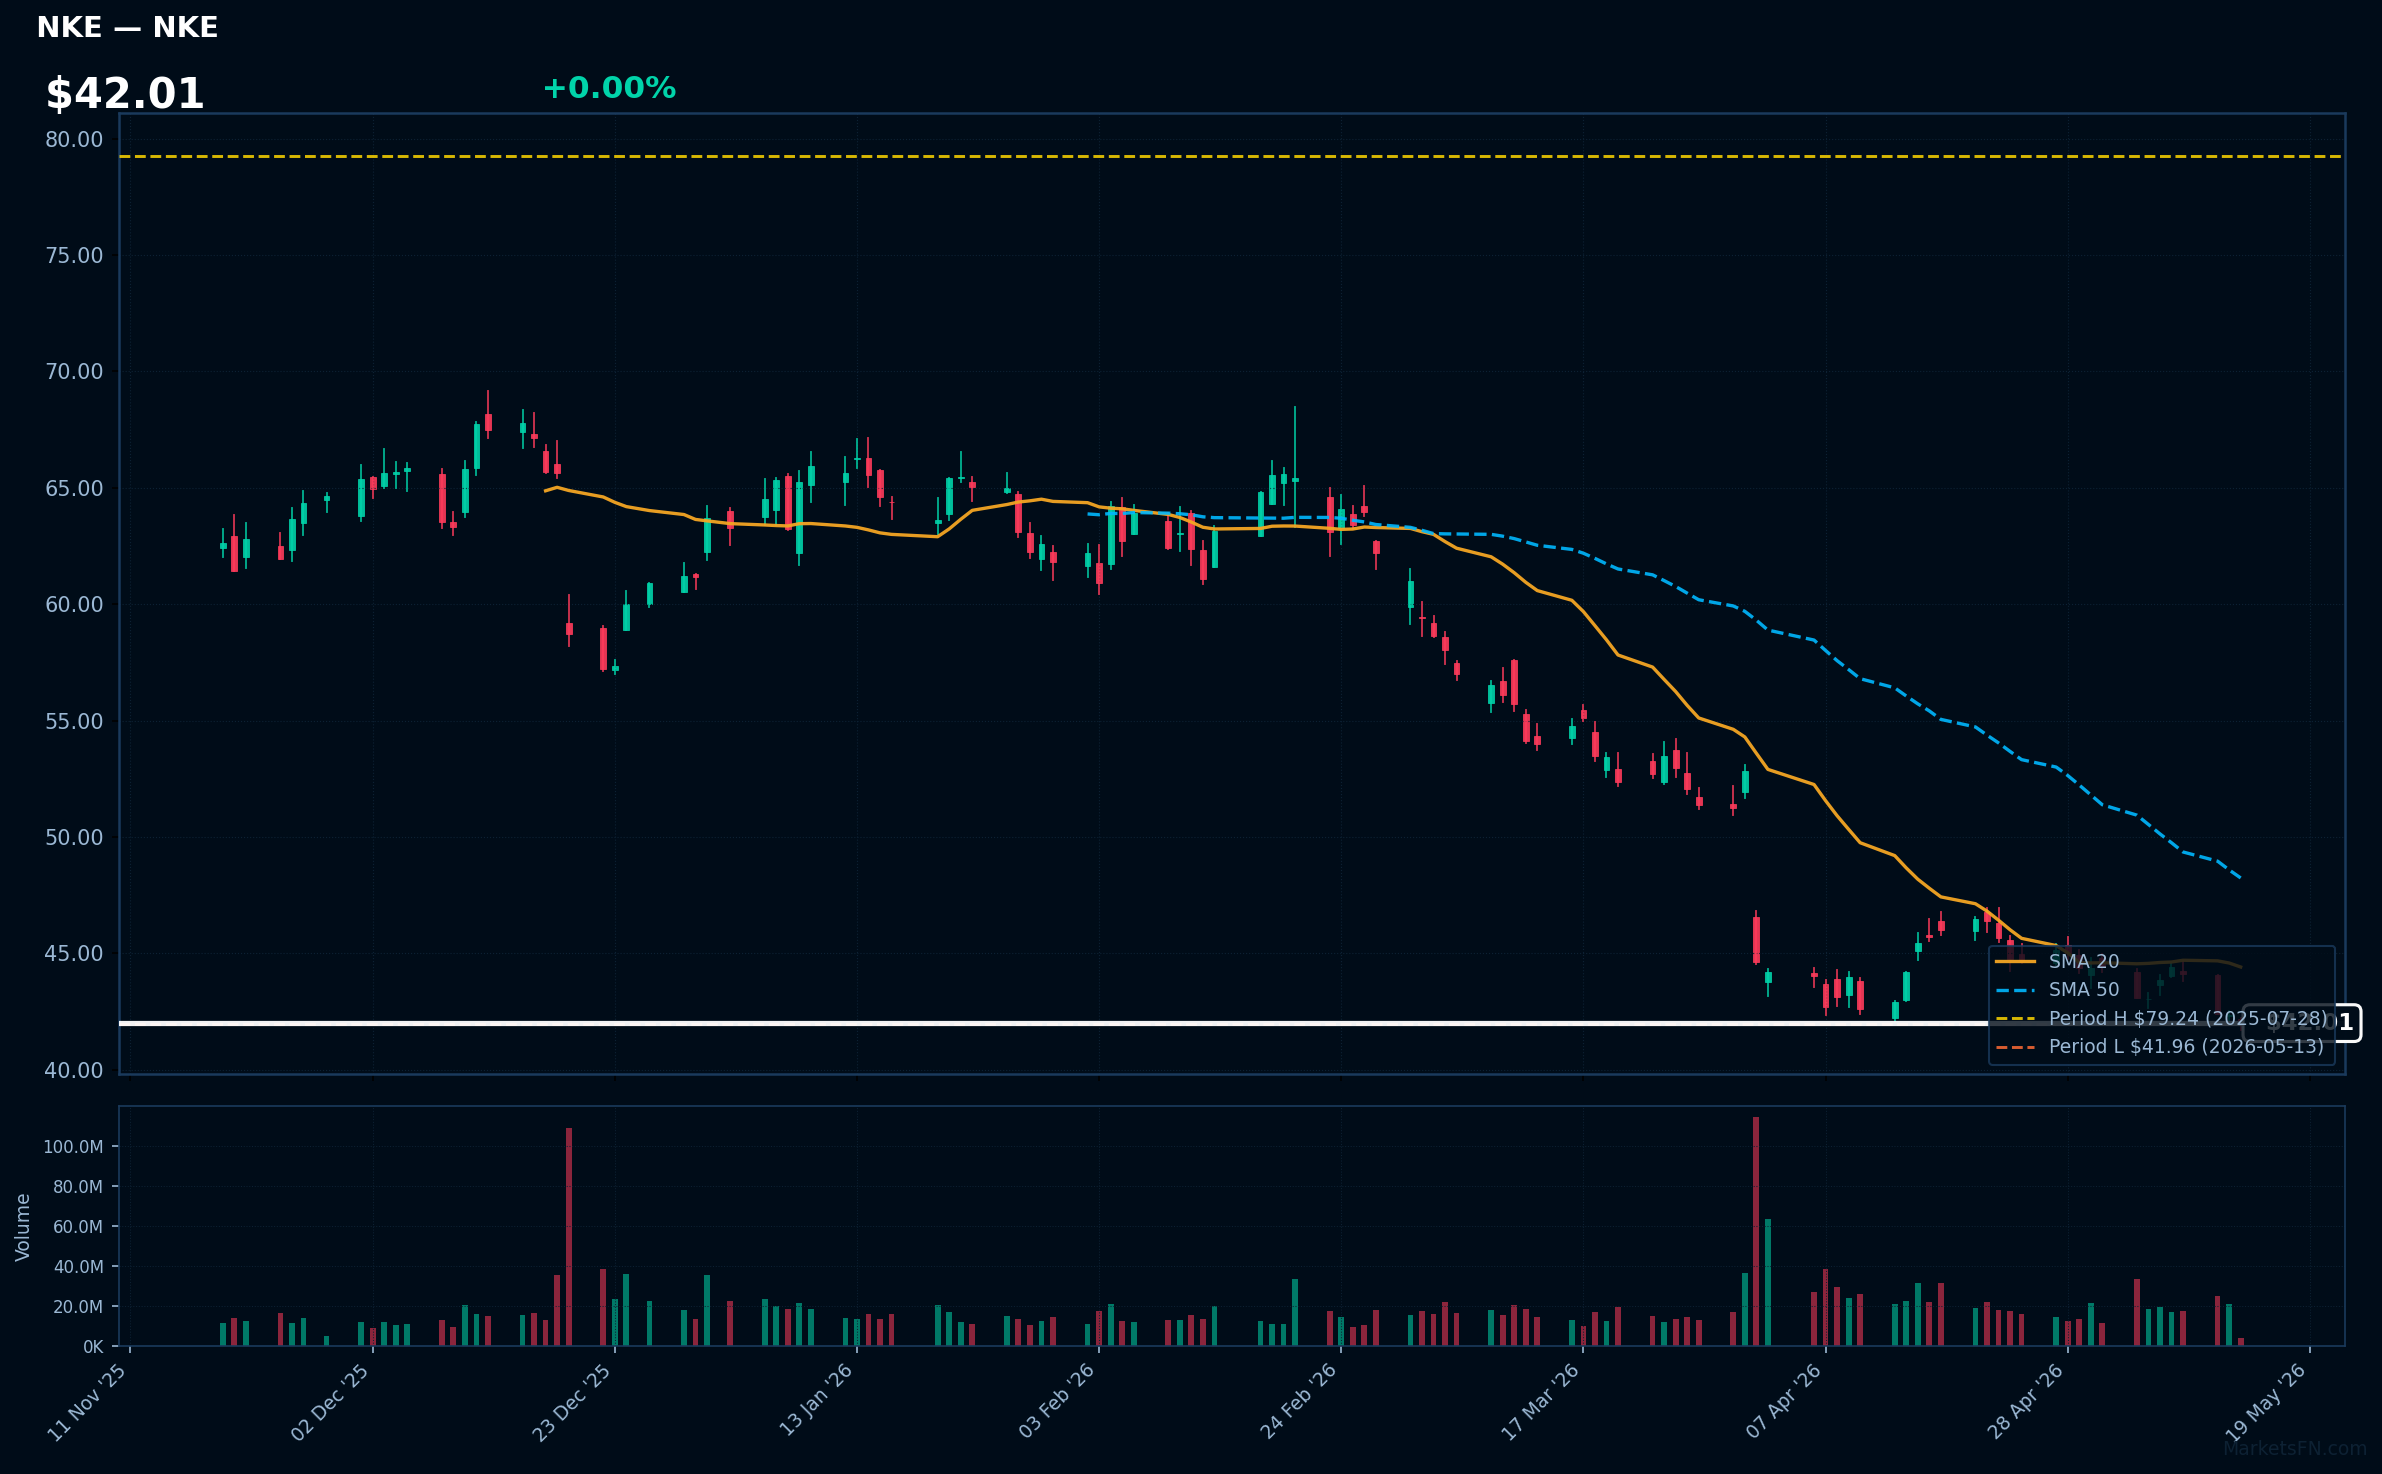
NKE | Nike, Inc | Consumer Cyclical | Price Last: $41.96 | % Realized: -32.75% | RSI: 30.7 | % above MA200: -33.1% | Trend: Below MA20, MA50, MA200
Nike designs, manufactures, and markets athletic footwear, apparel, and equipment globally, emphasizing innovation and branding. Investors should care due to its market dominance, high profitability from enduring demand in sports and fashion, and opportunities for growth in emerging markets via strong e-commerce and partnerships.
Nike's stock at $42.01 shows bearish signals: RSI 30.7 (oversold), price below key MAs, and at 52-week low with -32.7% return. This may warn of further declines, overriding fundamental strength, as negative momentum persists despite oversold conditions.
Related headlines
Market Commentary
As S&P 500 stocks like NVDA, AAPL, UNH, CSCO, and LIN hover at their 52-week highs, it signals robust sector momentum, particularly in technology and healthcare, reflecting investor confidence in AI innovation, stable demand, and operational efficiencies. Conversely, stocks such as HD, IBM, ACN, DHR, and NKE near their 52-week lows indicate potential vulnerabilities in consumer cyclical and traditional tech sectors, possibly due to economic slowdowns, inflation pressures, or shifting consumer preferences, highlighting areas of market weakness.
Sector rotation appears driven by macro themes like the AI and tech surge boosting NVDA and AAPL, while healthcare's UNH and CSCO benefit from steady growth amid post-pandemic recovery. In contrast, consumer discretionary stocks like HD and NKE face headwinds from higher interest rates and reduced spending, with IBM and ACN reflecting broader IT services challenges in a cautious economic environment, underscoring a shift towards defensive and growth-oriented sectors.
Key levels to monitor include resistance at current highs for NVDA and AAPL, where a breakout could signal further rallies, and support near lows for HD and NKE, with potential rebounds if economic data improves. Catalysts to watch are upcoming earnings reports, Fed decisions on rates, and inflation figures, which could trigger volatility and dictate short-term price movements in these stocks.
Methodology: All 503 S&P 500 constituents screened. 52-week high = highest daily close over the past 252 trading days (approx. 1 year). 52-week low = lowest daily close over the same period. Distance = (current price / extreme − 1) × 100. Technical indicators computed on up to 1 year of daily OHLCV data.
Disclaimer: For informational purposes only. Not investment advice. Past performance is not indicative of future results.