S&P 500 52-Week Highs & Lows Radar: Apple (AAPL), Mastercardorporated (MA) and more
· Stocks · MarketsFN Team
S&P 500 52-Week Highs & Lows Radar: Apple (AAPL), Mastercardorporated (MA) and more
Screening all 503 S&P 500 constituents for stocks nearest to their 52-week high and their 52-week low. Data as of June 03, 2026. % Realized = 52-week total return.
Legend: RSI > 70 = overbought · RSI < 30 = oversold · Green % Realized = positive 52W return · Red = negative.
📈 Nearest to 52-Week High
Sectors represented: Technology (5)
| Ticker | Company | Sector | Price Last | % Realized | 52-Week High Date | RSI | % above MA200 | Trend |
|---|---|---|---|---|---|---|---|---|
| AAPL | Apple Inc | Technology | $315.20 | +55.06% | 2026-06-02 | 73.7 | +19.2% | Above MA20, MA50, MA200 |
| AMD | Advanced Micro Devices Inc | Technology | $534.13 | +355.31% | 2026-06-03 | 76.8 | +120.1% | Above MA20, MA50, MA200 |
| AMAT | Applied Materials Inc | Technology | $493.30 | +205.00% | 2026-06-03 | 72.6 | +66.1% | Above MA20, MA50, MA200 |
| LRCX | Lam Research Corp | Technology | $335.94 | +301.55% | 2026-06-03 | 71.6 | +71.2% | Above MA20, MA50, MA200 |
| KLAC | KLA Corp | Technology | $2052.64 | +164.59% | 2026-06-03 | 66.0 | +50.3% | Above MA20, MA50, MA200 |
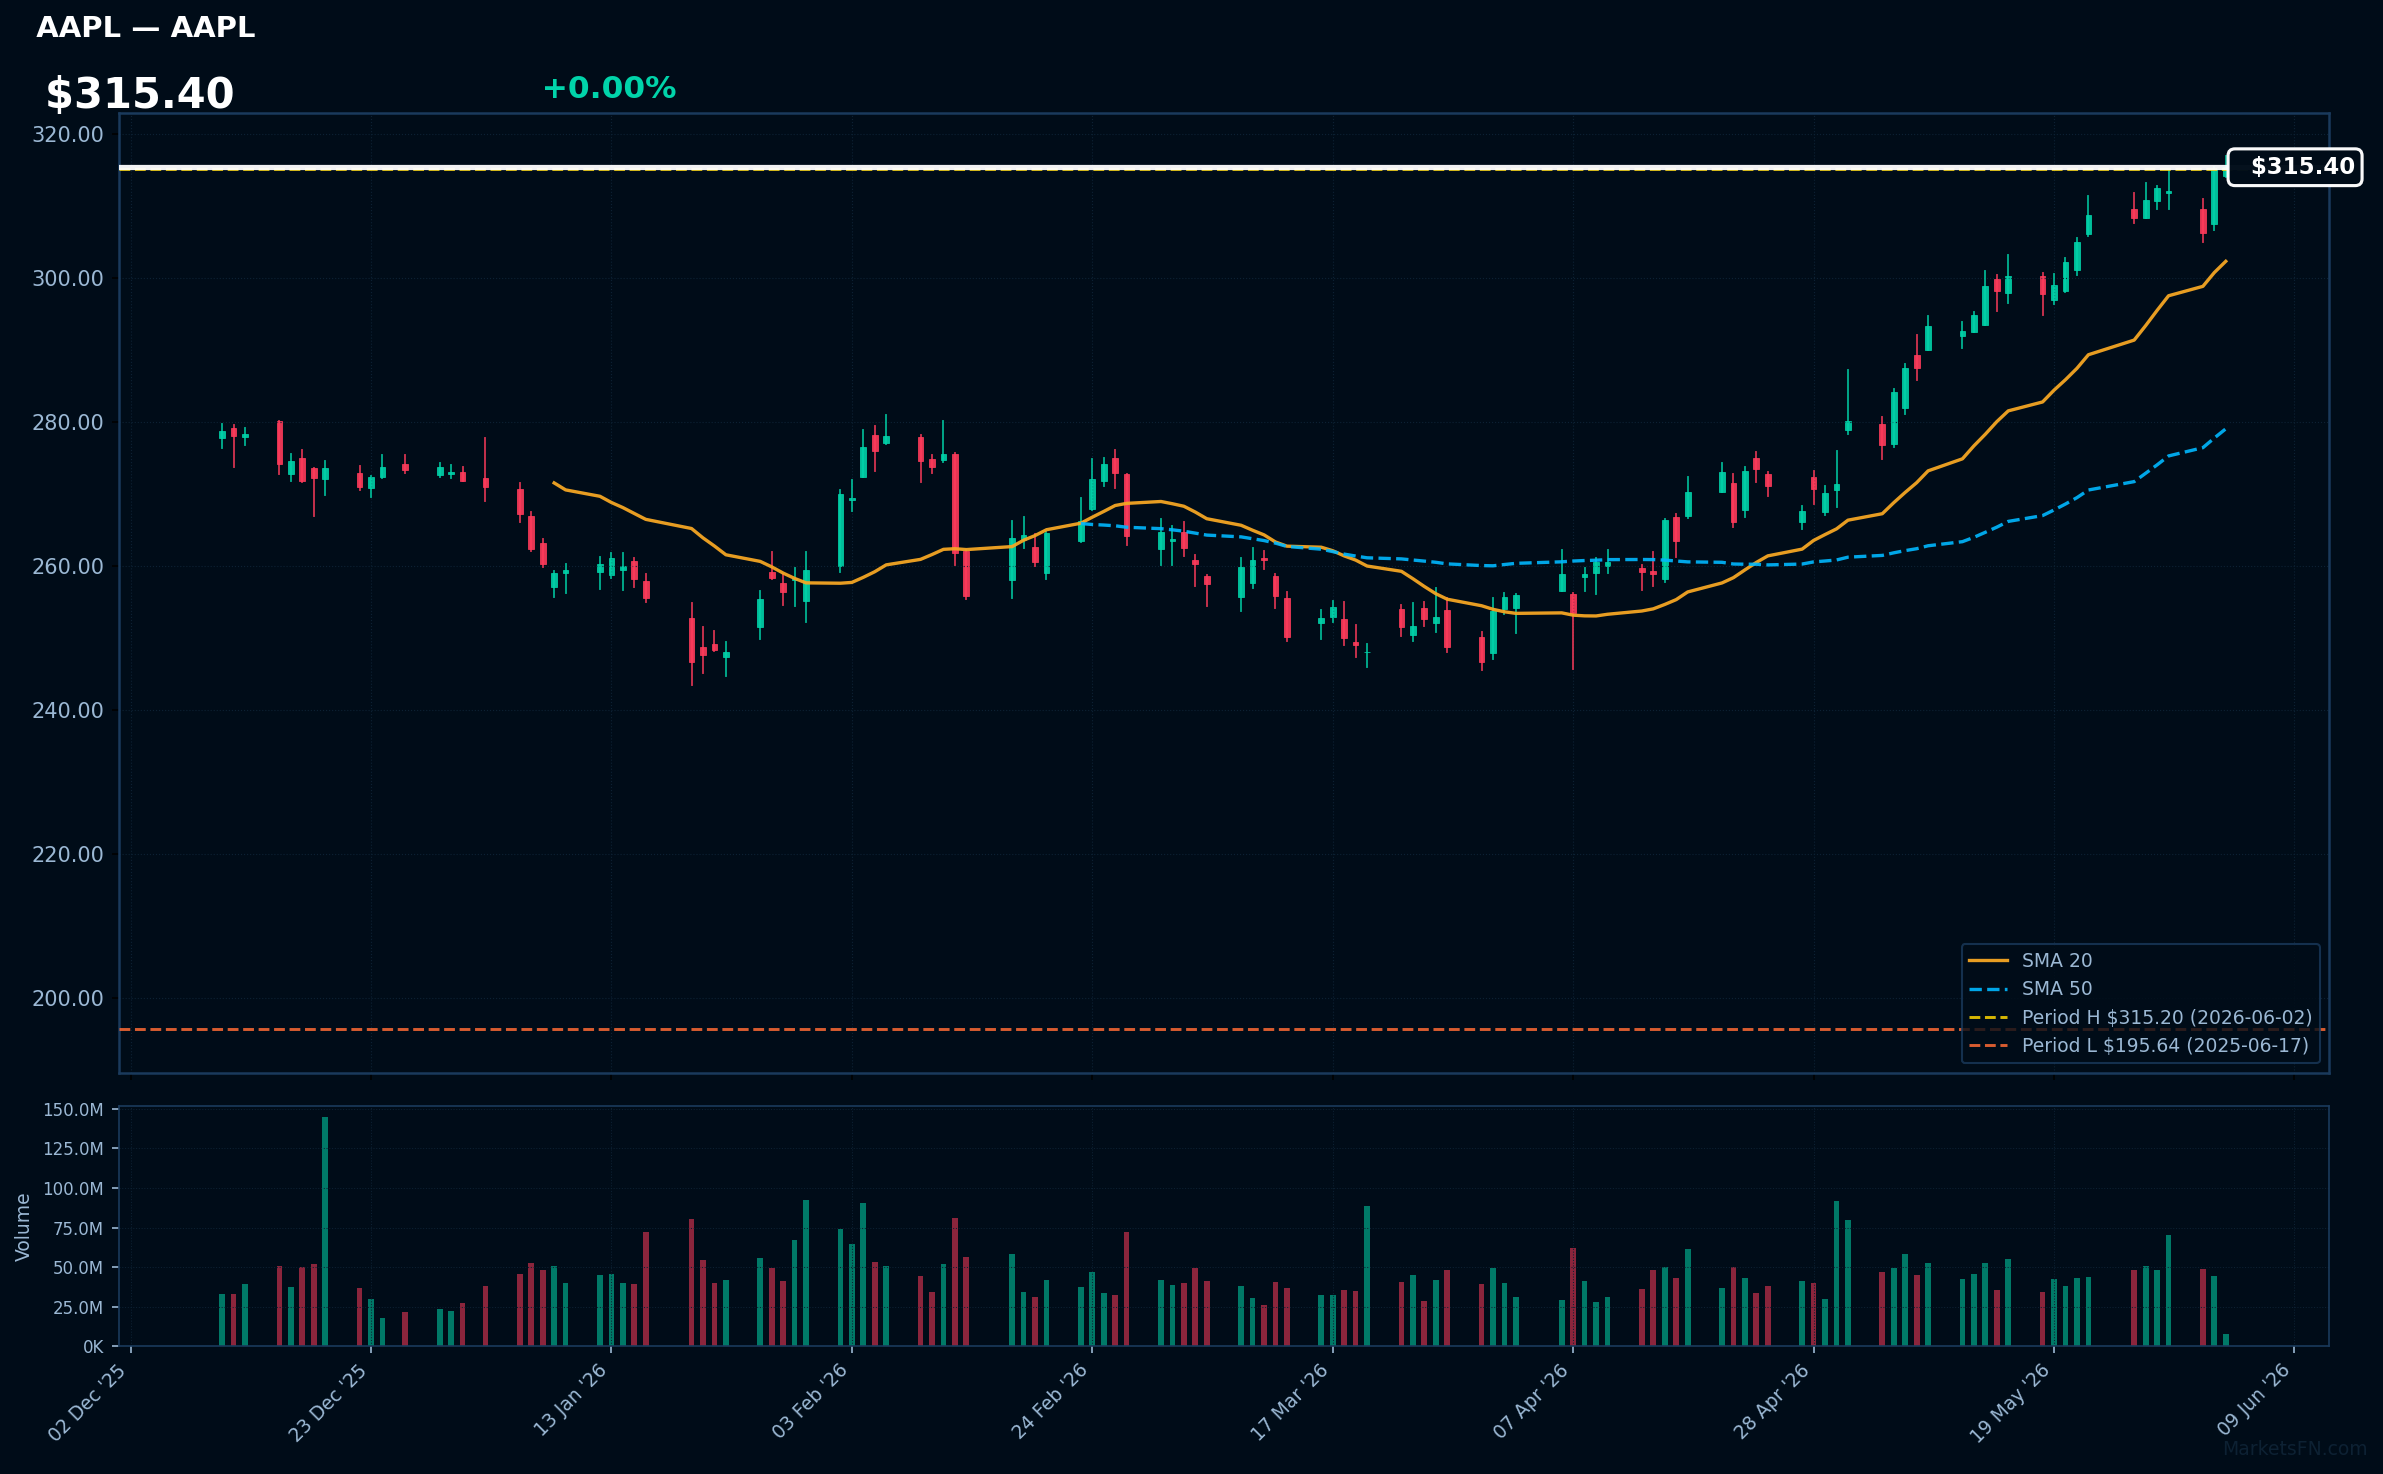
AAPL | Apple Inc | Technology | Price Last: $315.20 | % Realized: +55.06% | RSI: 73.7 | % above MA200: +19.2% | Trend: Above MA20, MA50, MA200
Apple Inc designs, manufactures, and markets consumer electronics, software, and services, generating revenue primarily from iPhone sales and services like Apple Music. Investors care due to its brand loyalty, ecosystem stickiness, and growing services segment.
AAPL's RSI(14) is 73.7, indicating strong momentum. The MA alignment (price > MA20 > MA50 > MA200) confirms a sustained uptrend. With the stock 0.0% below its 52-Week high, it nears a potential breakout level, having returned 55.1% over the 52-Week period.
Related headlines
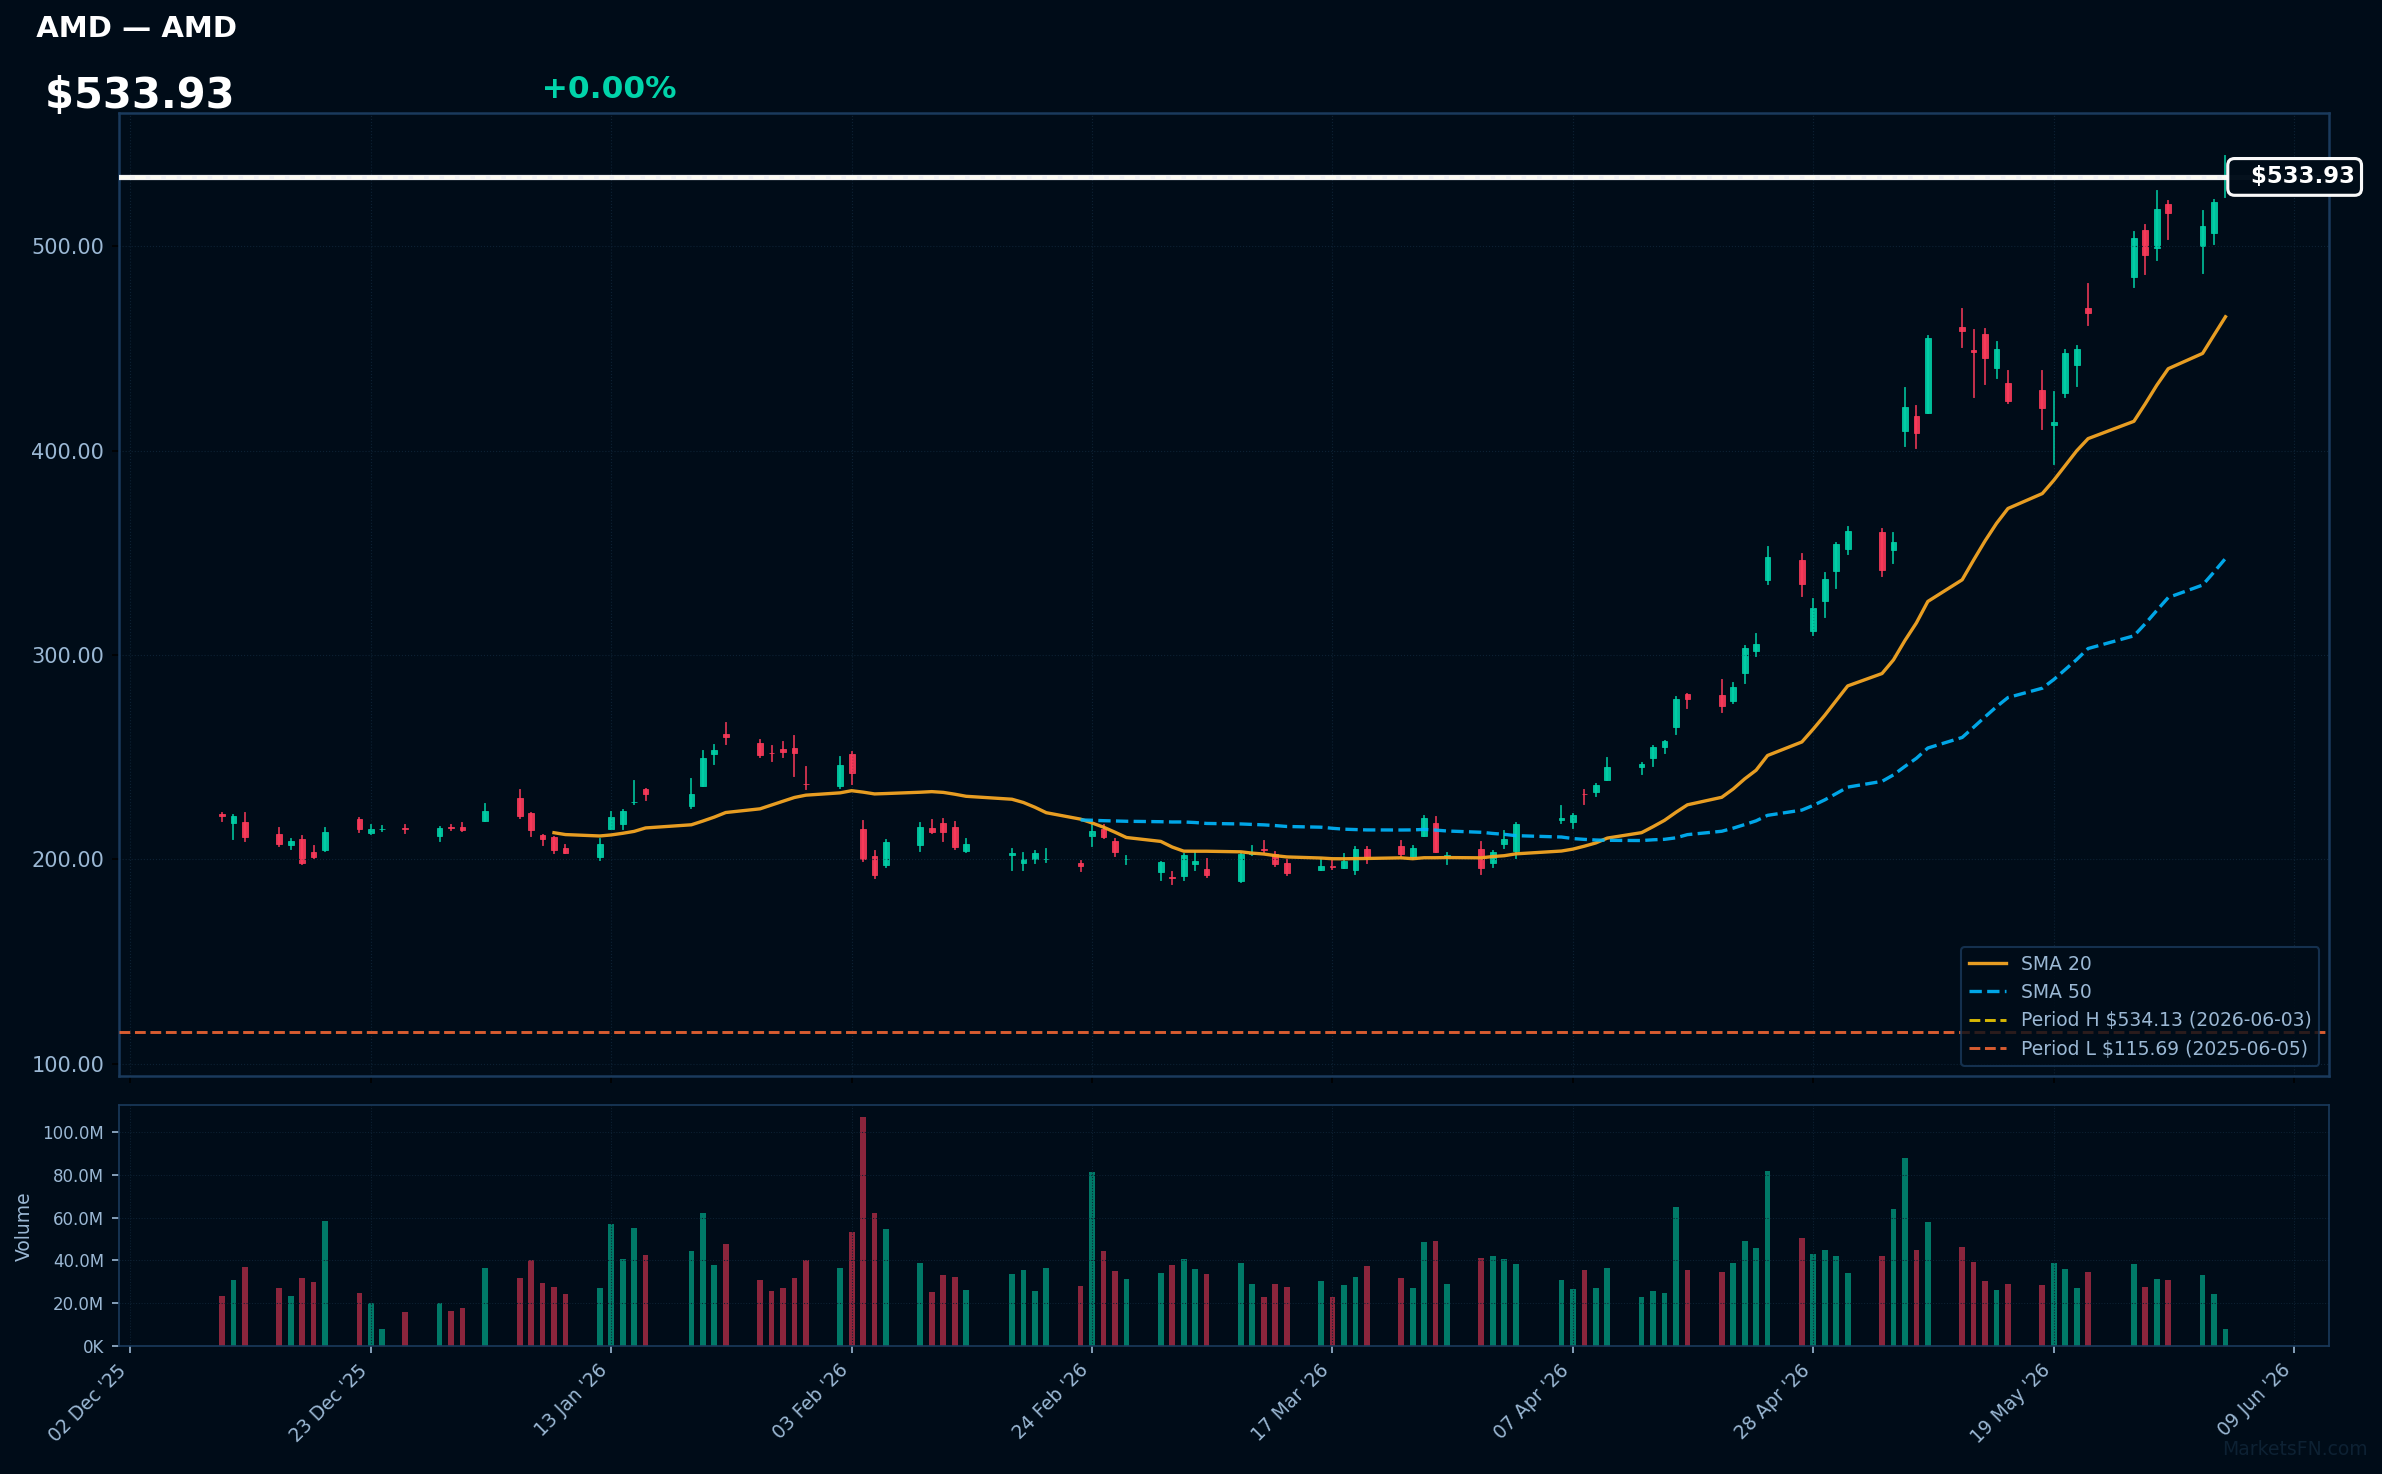
AMD | Advanced Micro Devices Inc | Technology | Price Last: $534.13 | % Realized: +355.31% | RSI: 76.8 | % above MA200: +120.1% | Trend: Above MA20, MA50, MA200
Advanced Micro Devices Inc designs and manufactures high-performance CPUs, GPUs, and semi-custom SoCs for gaming consoles, PCs, and data centers, driving growth in gaming, cloud computing, and AI, making it a key player in the semiconductor industry.
AMD's current technical situation indicates strong momentum: RSI(14) is 76.8, and the stock is in a bullish MA alignment (price > MA20 > MA50 > MA200), with the price 0.0% below its 52-Week high, suggesting a potential breakout.
Related headlines
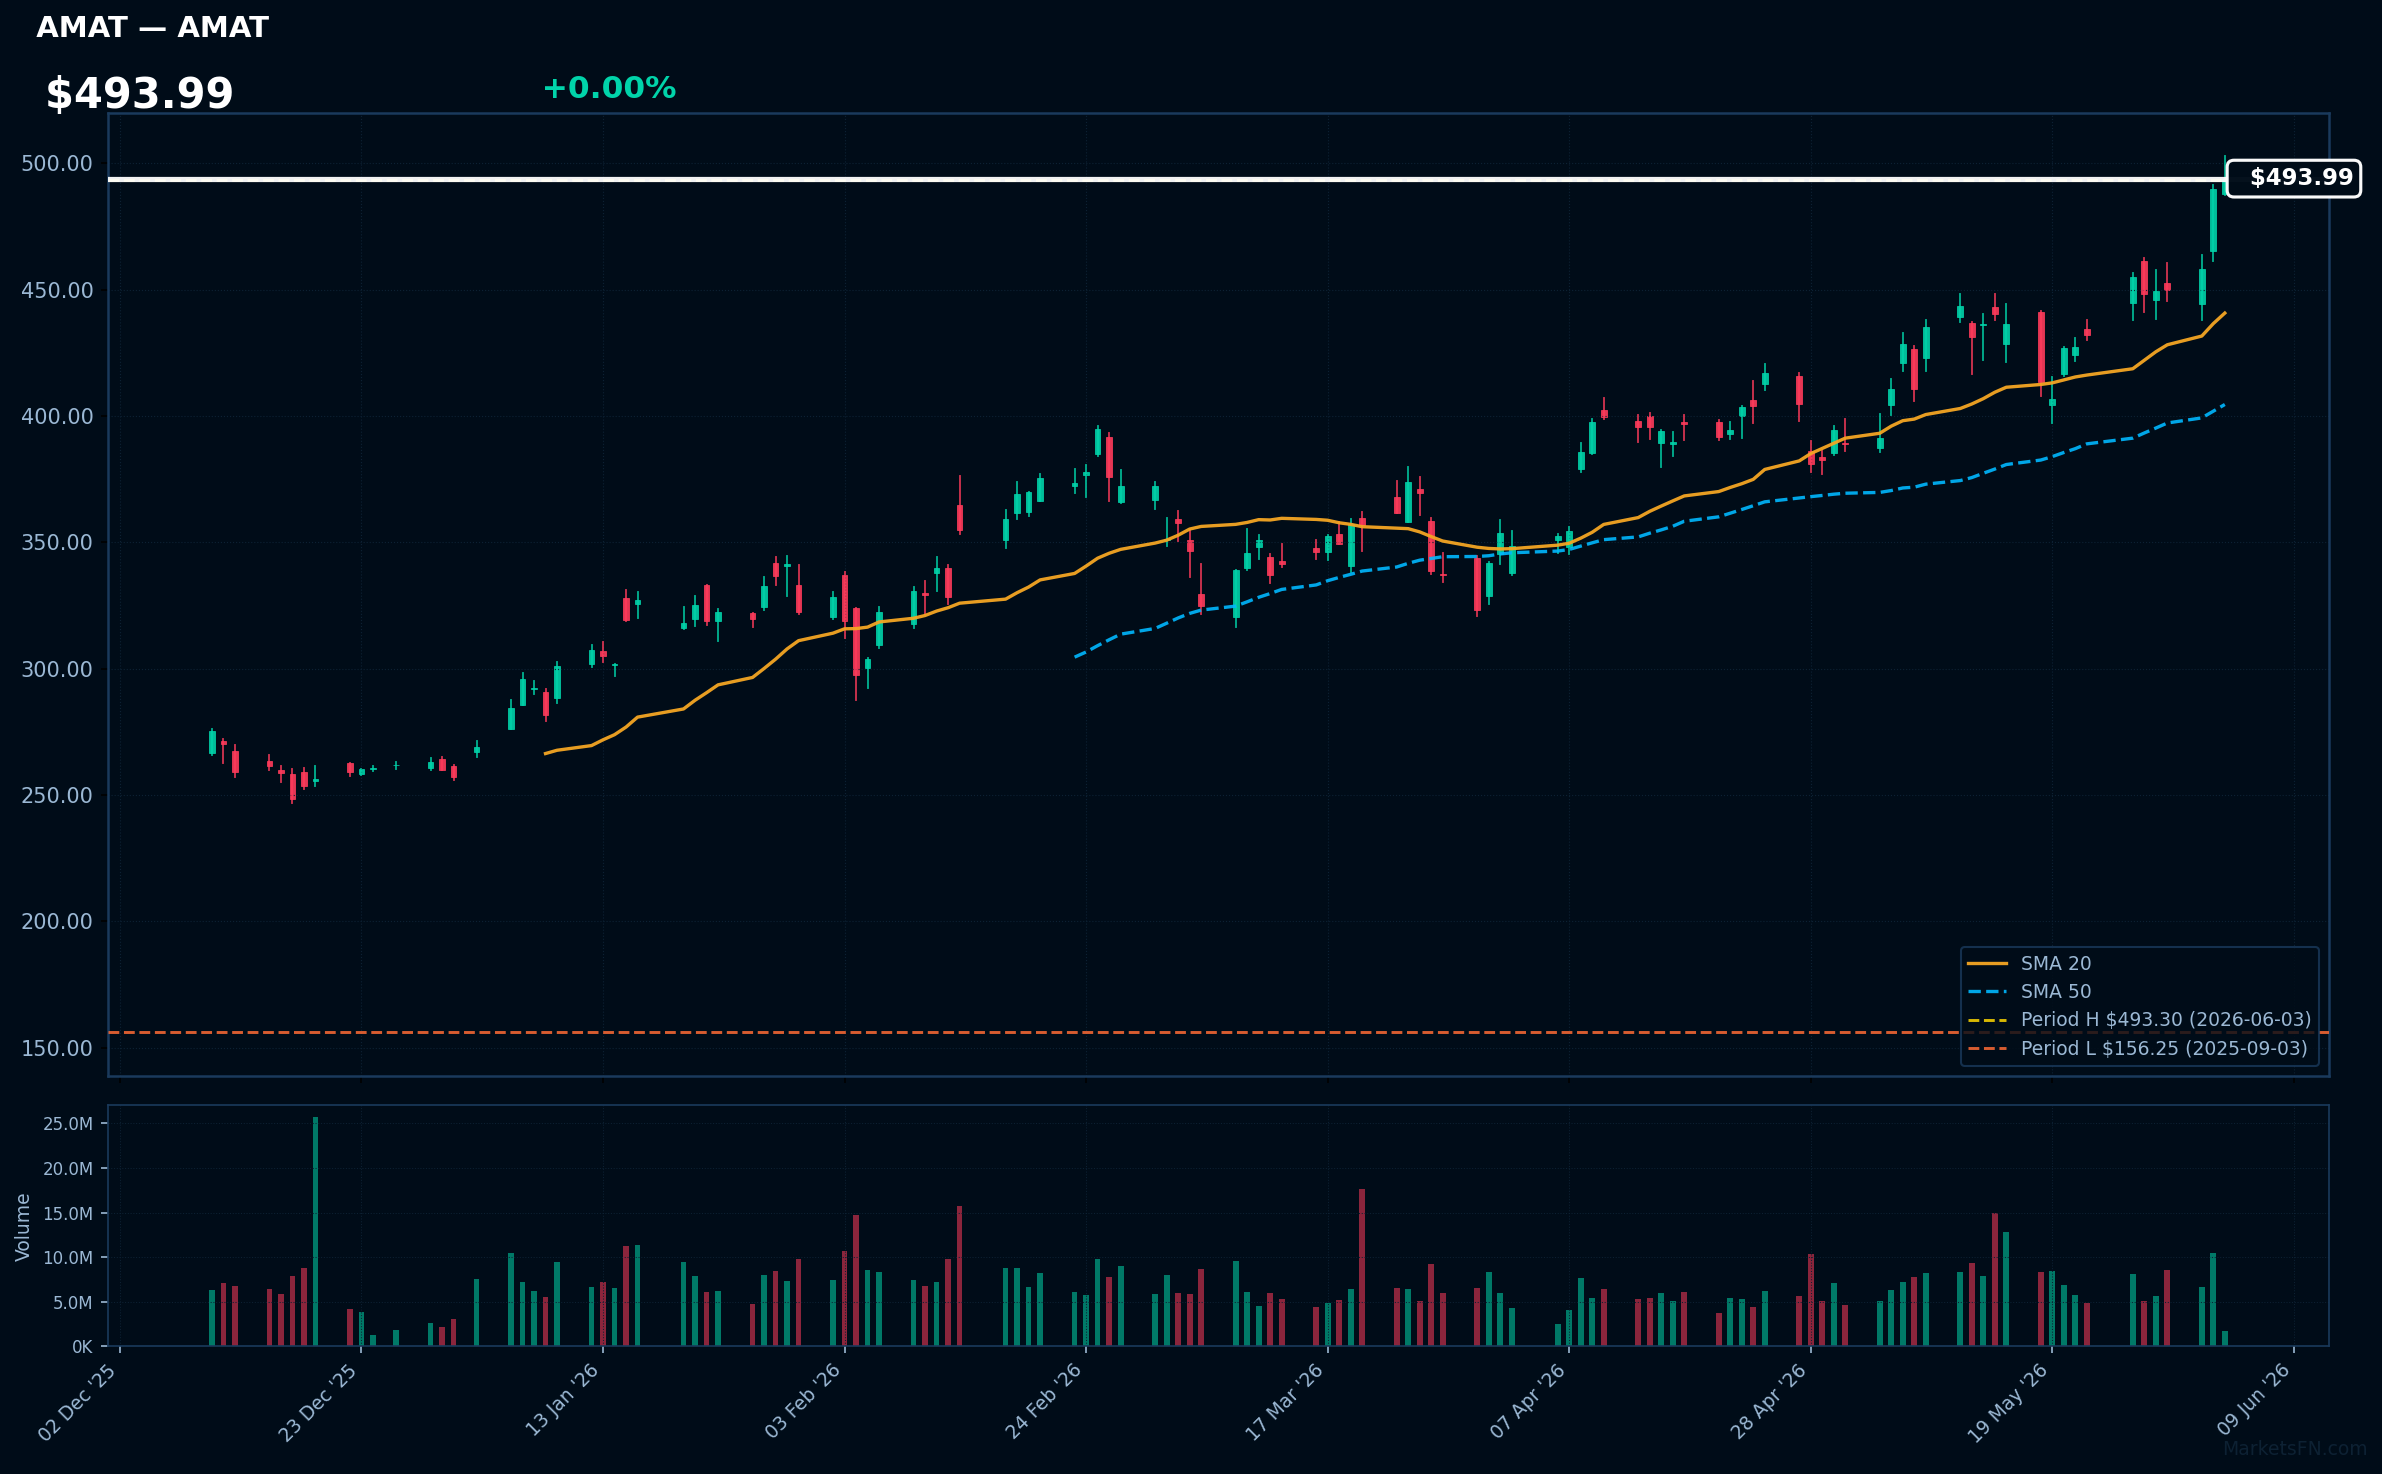
AMAT | Applied Materials Inc | Technology | Price Last: $493.30 | % Realized: +205.00% | RSI: 72.6 | % above MA200: +66.1% | Trend: Above MA20, MA50, MA200
Applied Materials Inc is a leading semiconductor equipment manufacturer, providing critical tools for chip fabrication. Investors should care because its technology enables advancements in AI, 5G, and other emerging fields, driving growth in the semiconductor industry.
The stock exhibits strong bullish momentum with RSI(14) at 72.6, indicating overbought conditions. MA alignment is bullish (price > MA20 > MA50 > MA200), and the stock is 0.0% below its 52-Week high, suggesting a potential breakout.
Related headlines
- Applied Materials Inc. stock outperforms competitors on strong trading day
- Applied Materials: The AI Stock That Wins No Matter Which Chip Wins
- Applied Materials Partners with SCREEN To Bring Advanced Wafer Cleaning Technologies to EPIC Center
- Applied Materials Announces Broadcom as EPIC Innovation Partner
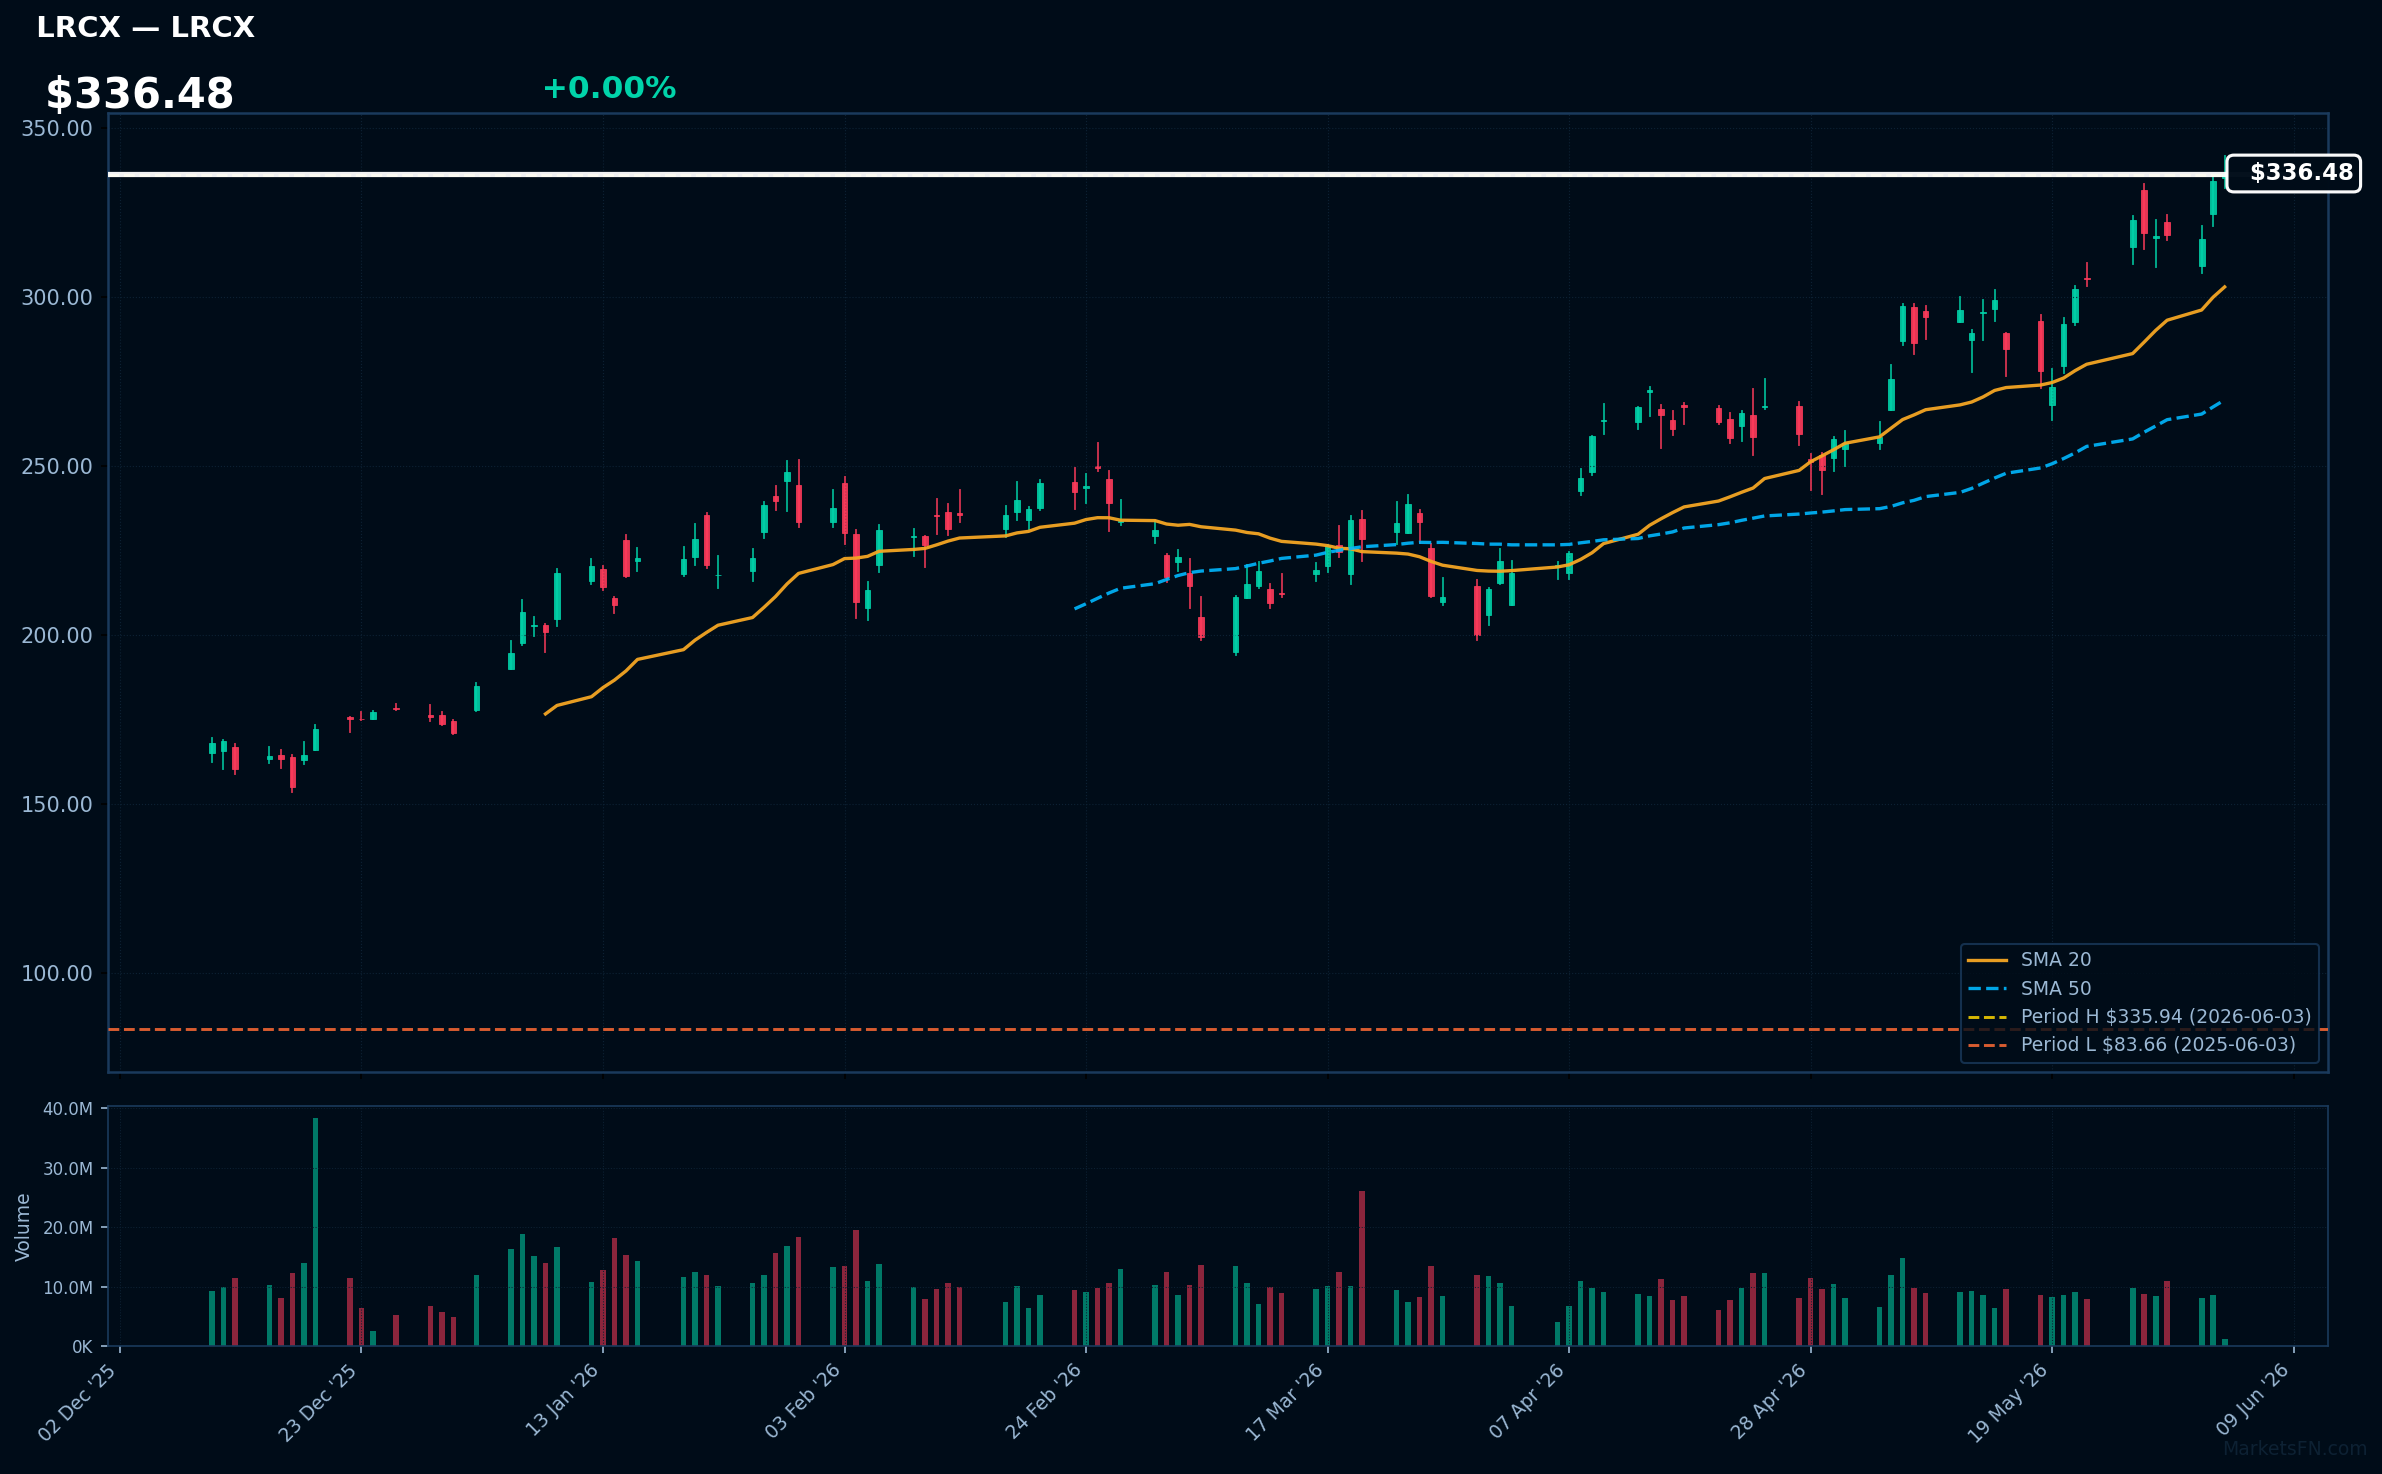
LRCX | Lam Research Corp | Technology | Price Last: $335.94 | % Realized: +301.55% | RSI: 71.6 | % above MA200: +71.2% | Trend: Above MA20, MA50, MA200
Lam Research Corp is a leading supplier of wafer fabrication equipment and services to the semiconductor industry. Investors should care because its products are crucial for chip manufacturing, driving revenue growth tied to the semiconductor cycle.
LRCX is in a sustained uptrend with price > MA20 > MA50 > MA200, RSI(14) at 71.6, near its 52-Week high. This indicates strong momentum, potentially overbought, with a 301.6% 52-Week return, suggesting continued technical strength but also potential for a pullback.
Related headlines
- Lam Research Corp. stock underperforms Tuesday when compared to competitors despite daily gains
- Lam Research's Salzburg PLP center signals push toward panel production, but hurdles remain for large-scale adoption
- Lam Research focused on adding AI to chipmaking tools as it eyes US expansion, CEO says
- Lam Research Corporation Declares Quarterly Dividend
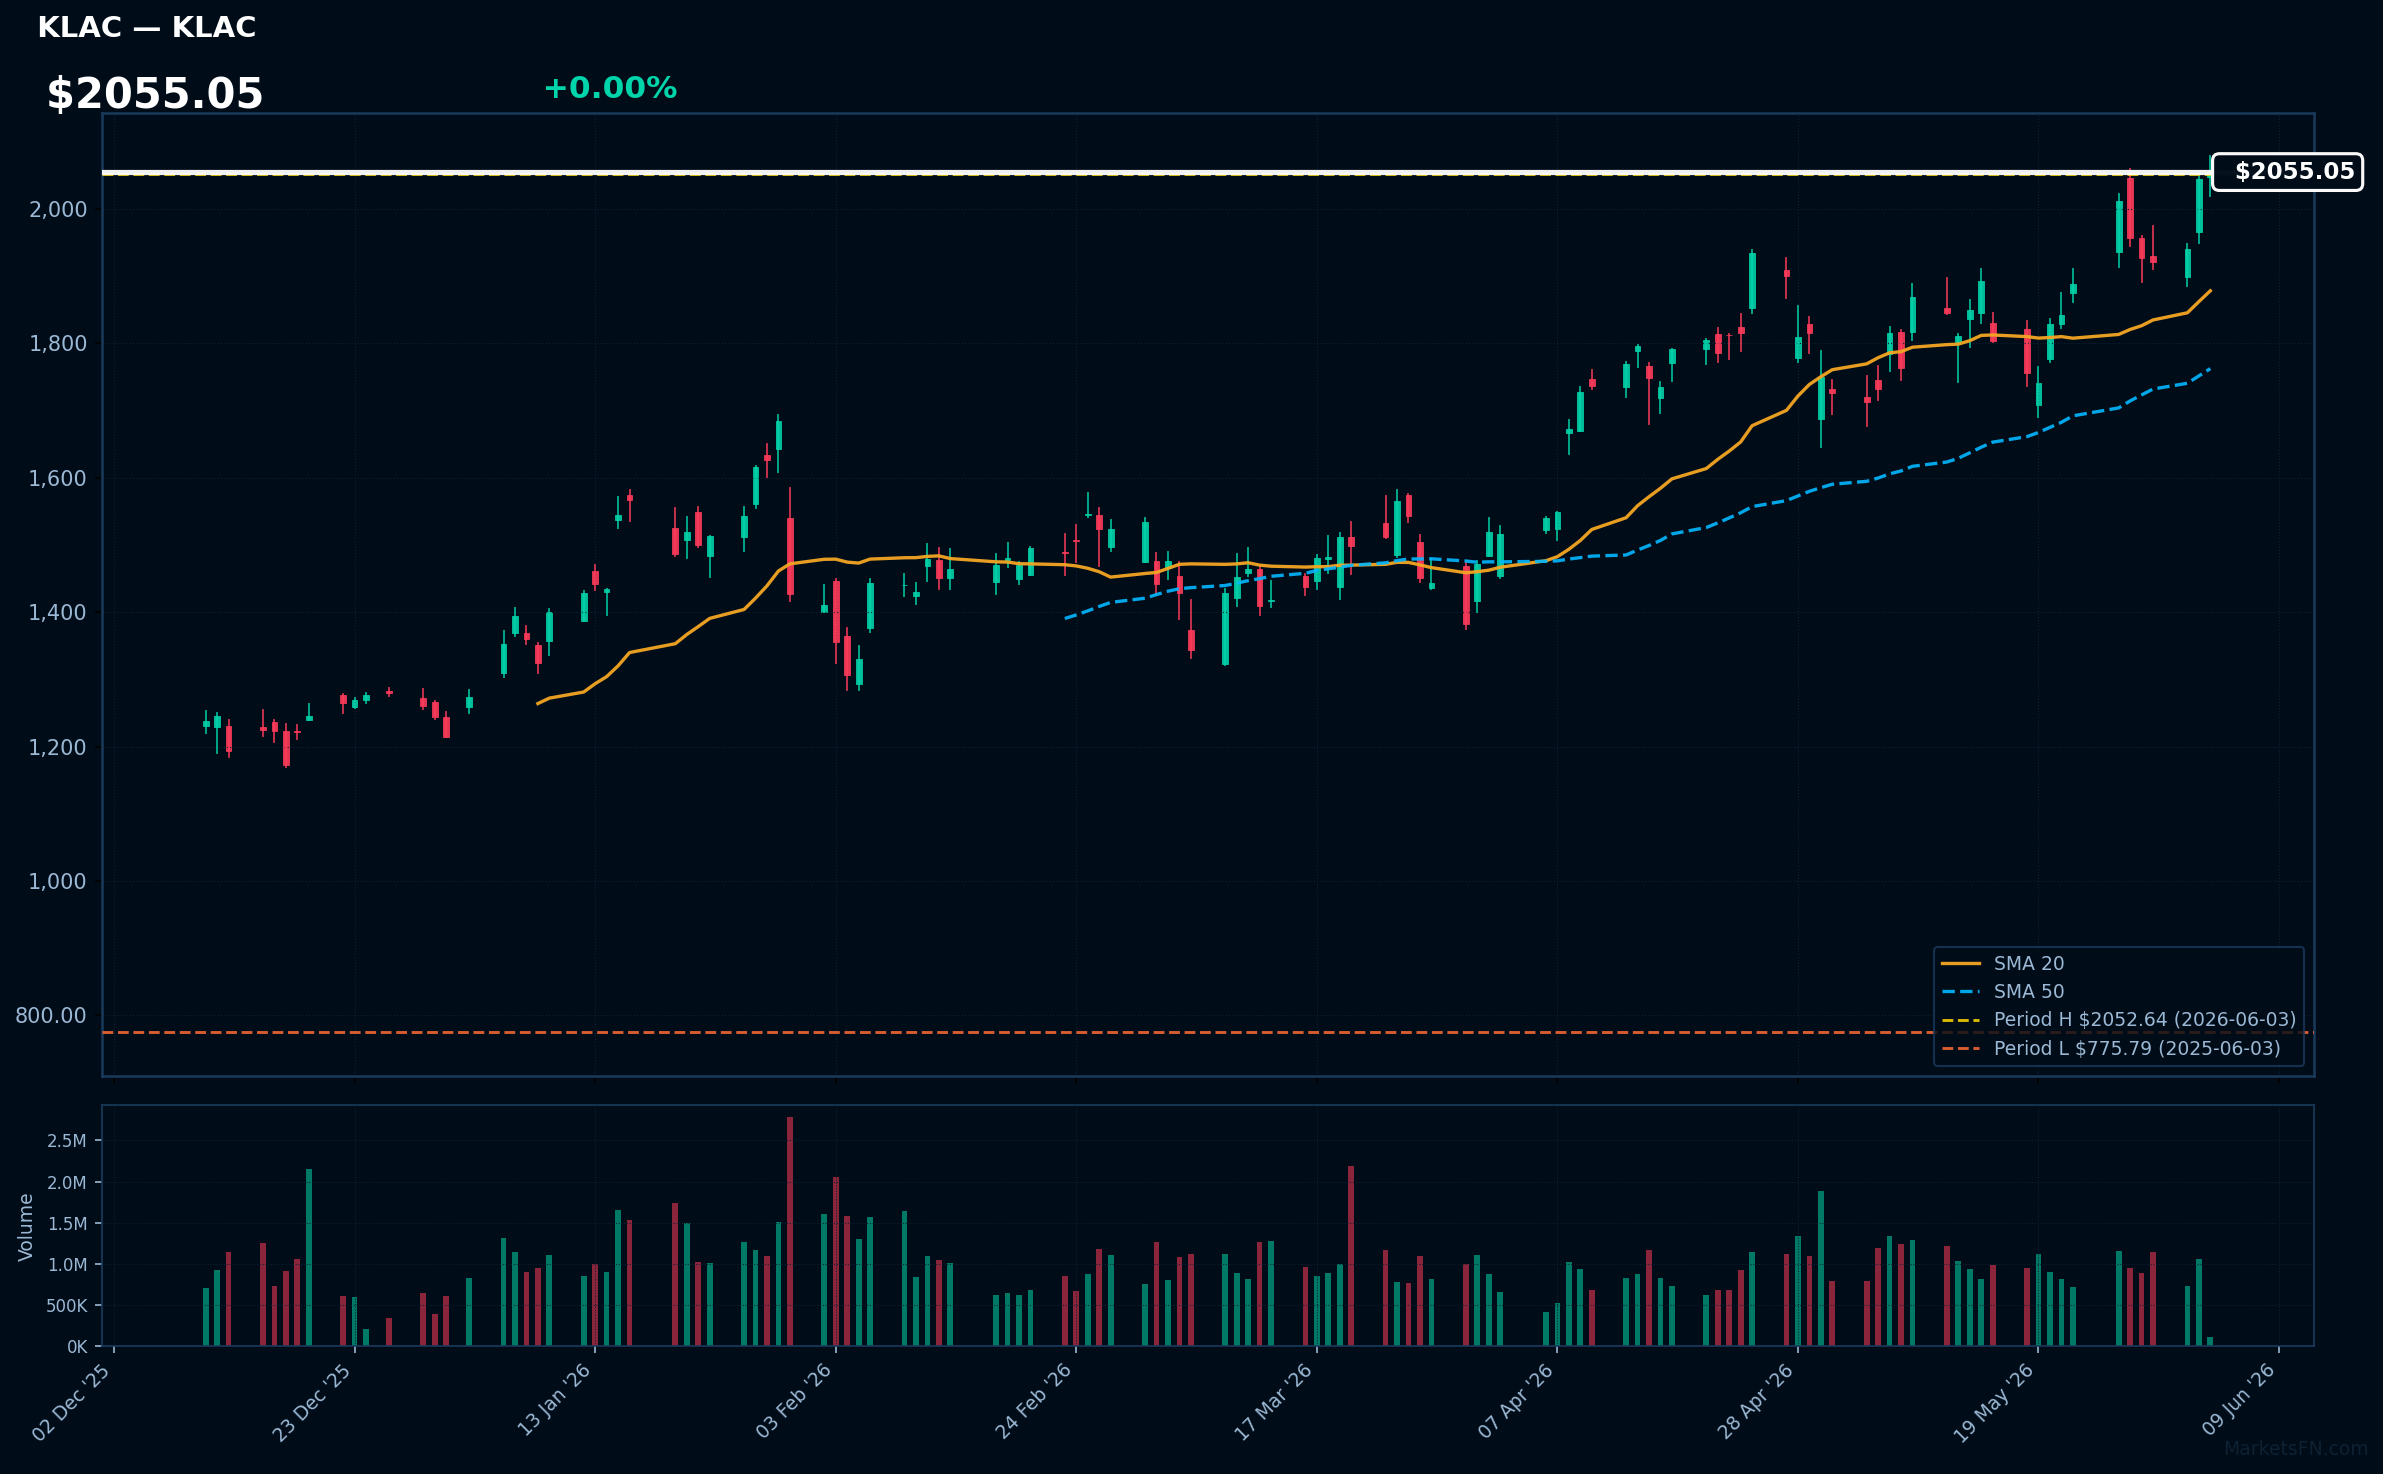
KLAC | KLA Corp | Technology | Price Last: $2052.64 | % Realized: +164.59% | RSI: 66.0 | % above MA200: +50.3% | Trend: Above MA20, MA50, MA200
KLA Corp is a process control and yield management solutions provider for the semiconductor industry. Investors should care because its technology enables chipmakers to improve manufacturing efficiency and yield, directly impacting their profitability.
KLA Corp's technicals indicate sustained uptrend with price at $2055.05, RSI(14) at 66.0, and bullish MA alignment (price > MA20 > MA50 > MA200). The stock is near its 52-Week high, 0.0% below, suggesting potential breakout momentum.
Related headlines
📉 Nearest to 52-Week Low
Sectors represented: Financial (2), Healthcare (1), Consumer Cyclical (1), Communication Services (1)
| Ticker | Company | Sector | Price Last | % Realized | 52-Week Low Date | RSI | % above MA200 | Trend |
|---|---|---|---|---|---|---|---|---|
| MA | Mastercard Incorporated | Financial | $469.70 | -19.29% | 2026-06-03 | 31.8 | -13.1% | Below MA20, MA50, MA200 |
| ISRG | Intuitive Surgical Inc | Healthcare | $401.30 | -27.28% | 2026-06-03 | 31.5 | -18.8% | Below MA20, MA50, MA200 |
| LOW | Lowe's Cos., Inc | Consumer Cyclical | $206.06 | -9.94% | 2026-06-03 | 30.9 | -16.8% | Below MA20, MA50, MA200 |
| CMCSA | Comcast Corp | Communication Services | $24.51 | -24.53% | 2026-06-03 | 33.0 | -13.6% | Below MA20, MA50, MA200 |
| ICE | Intercontinental Exchange Inc | Financial | $140.98 | -21.39% | 2026-06-03 | 24.5 | -12.6% | Below MA20, MA50, MA200 |
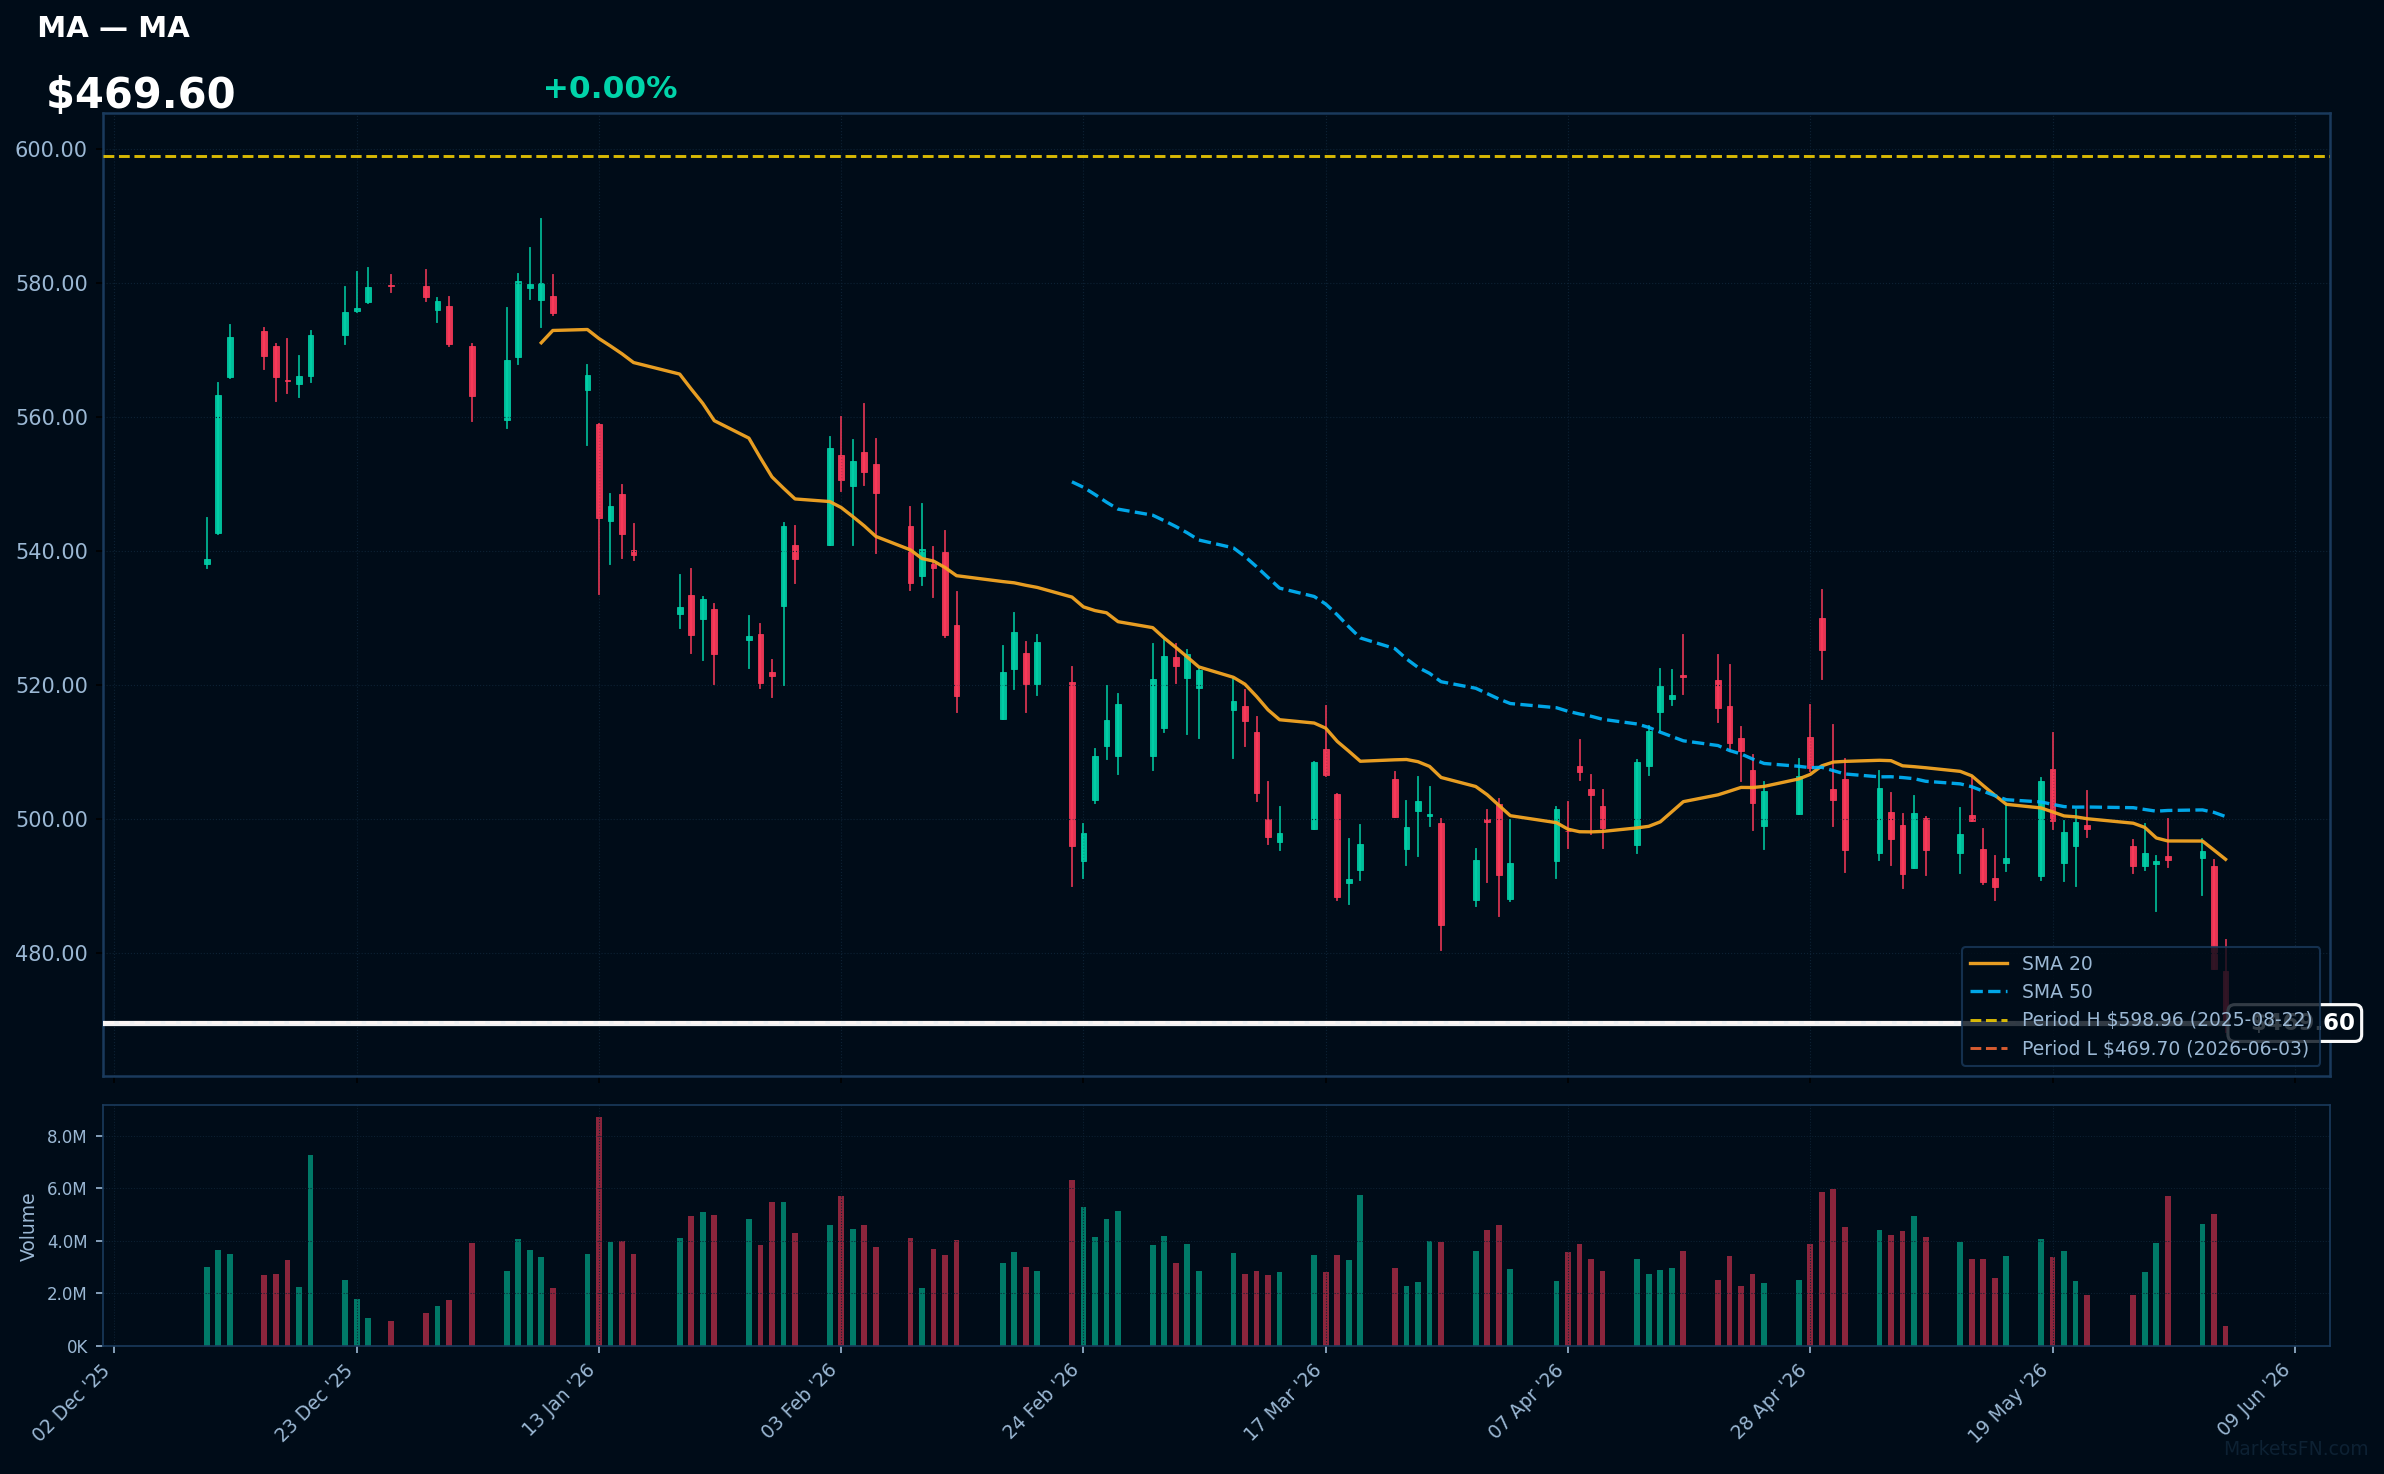
MA | Mastercard Incorporated | Financial | Price Last: $469.70 | % Realized: -19.29% | RSI: 31.8 | % above MA200: -13.1% | Trend: Below MA20, MA50, MA200
Mastercard Incorporated operates a payment processing network, facilitating transactions between consumers, merchants, and financial institutions, generating revenue through transaction fees and other services, making it a key player in the global digital payments industry.
Mastercard's current technical situation is bearish, with an RSI(14) of 31.8 indicating oversold conditions, and a sustained downtrend as price ($469.60) remains below MA20, MA50, and MA200, with the stock testing major support at its 52-Week low.
Related headlines
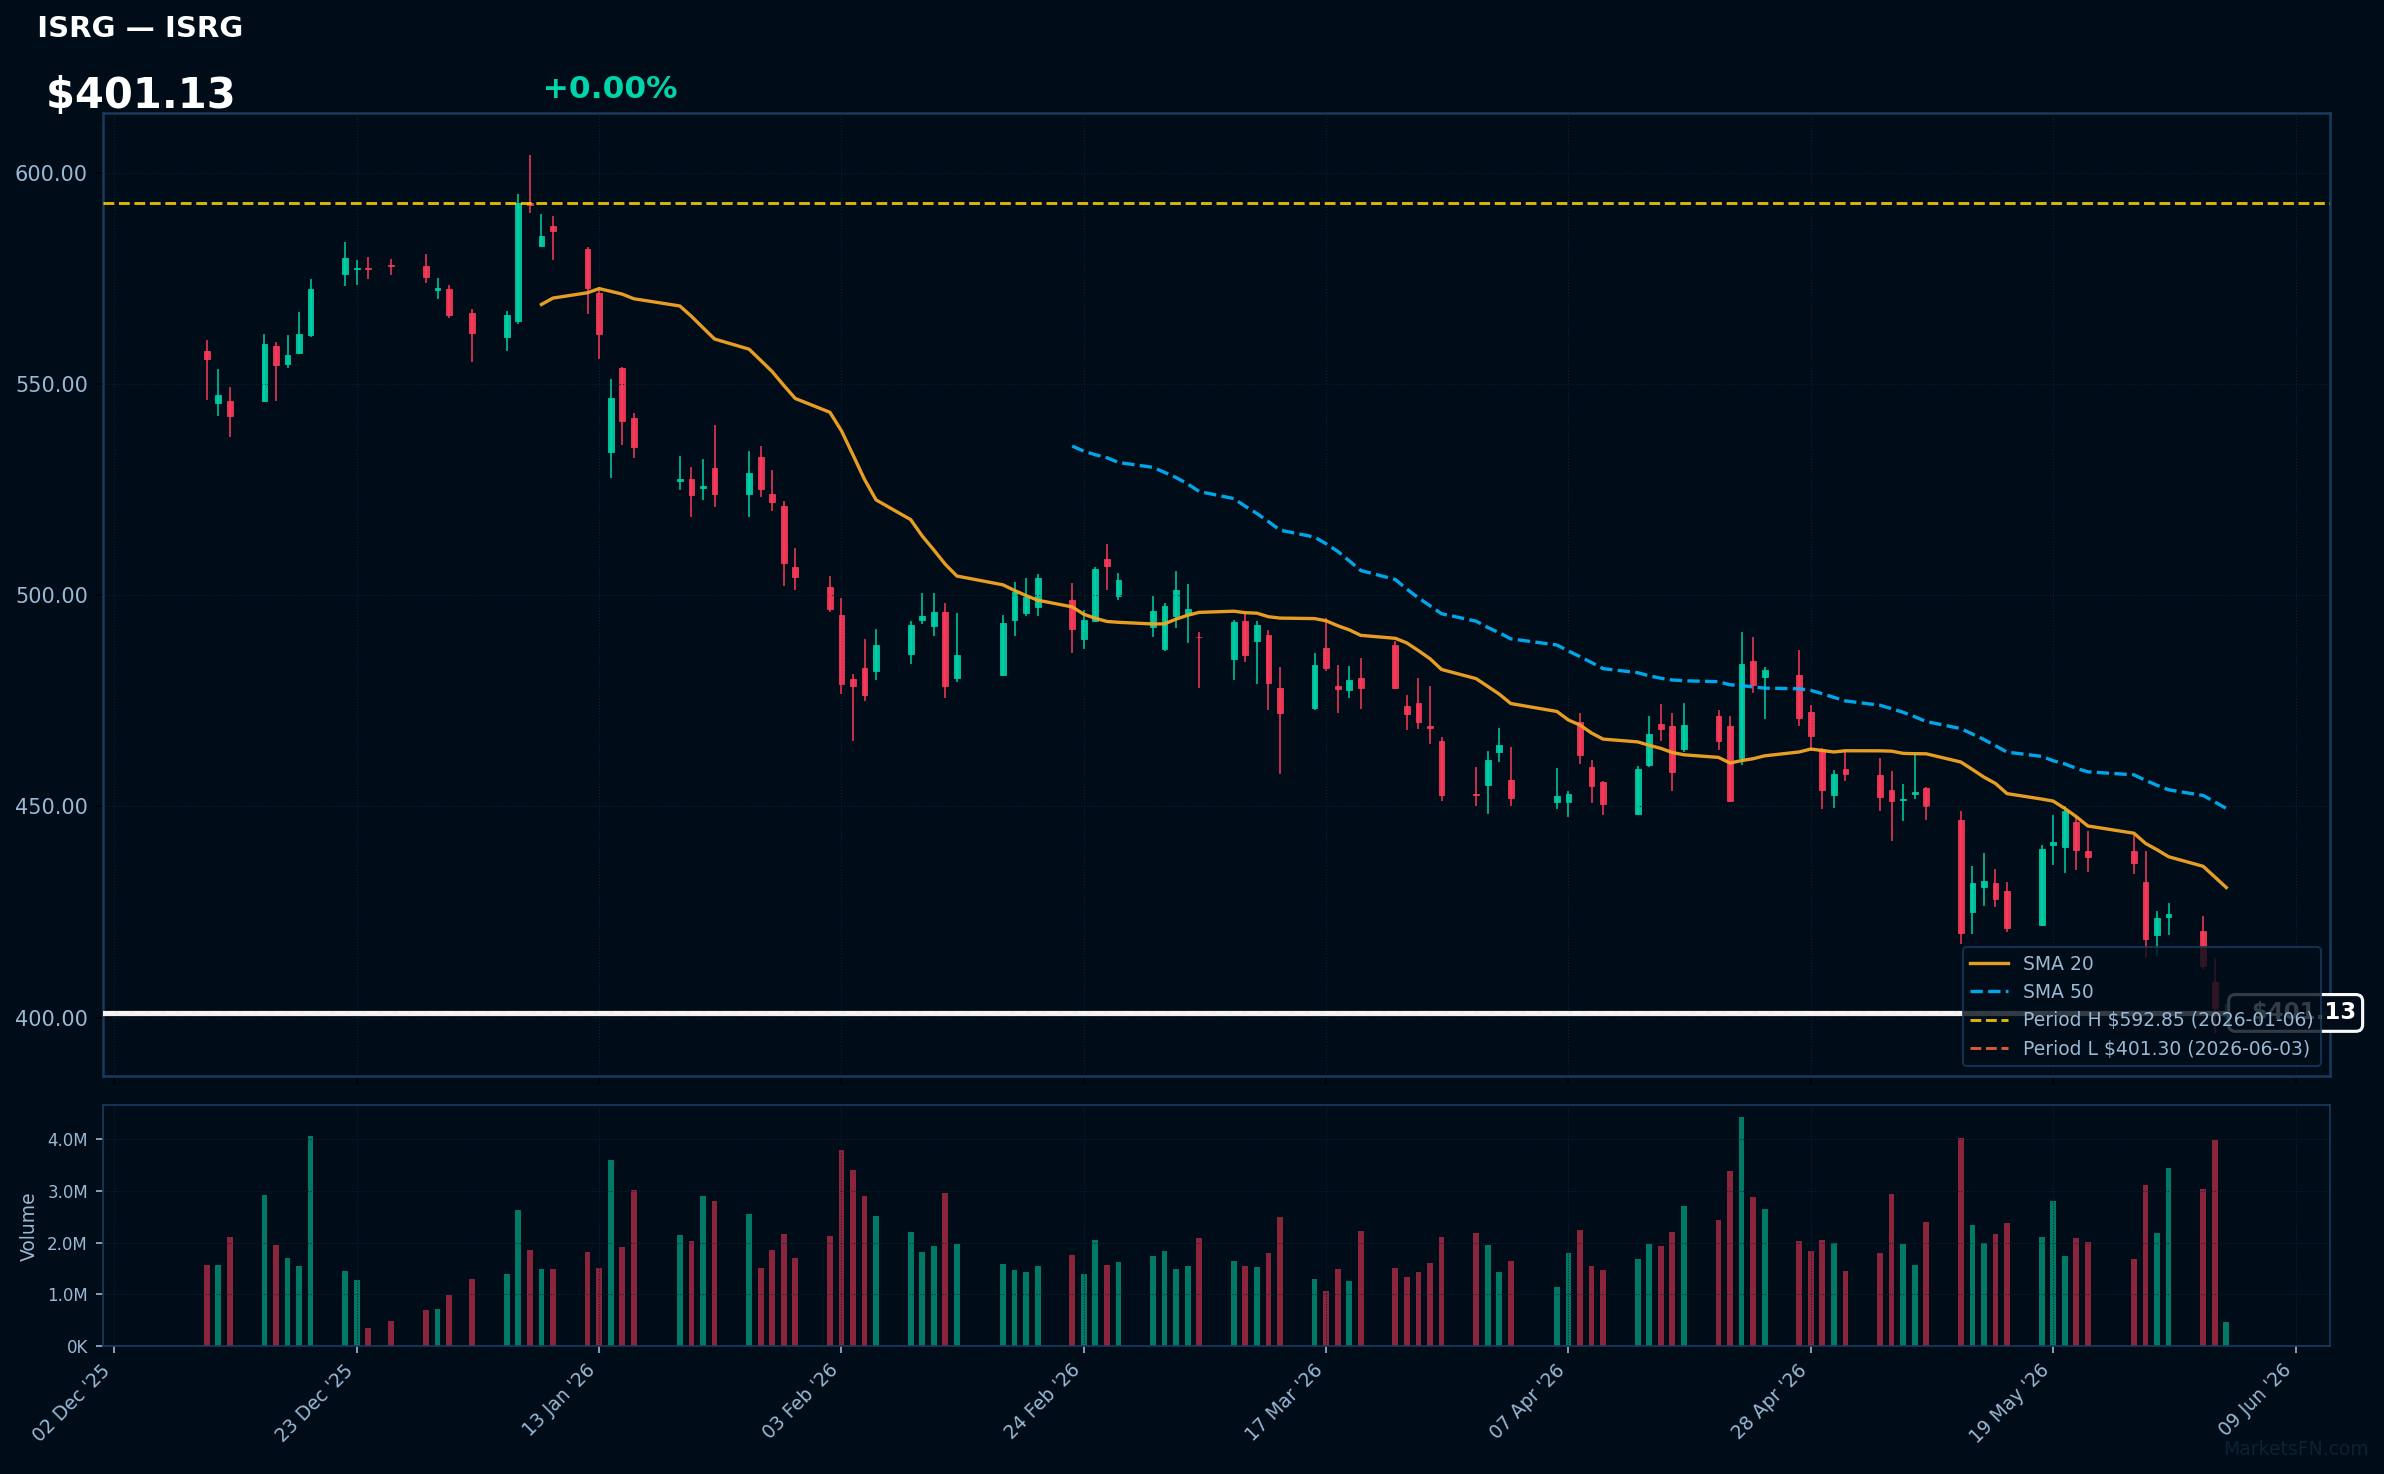
ISRG | Intuitive Surgical Inc | Healthcare | Price Last: $401.30 | % Realized: -27.28% | RSI: 31.5 | % above MA200: -18.8% | Trend: Below MA20, MA50, MA200
Intuitive Surgical Inc develops and markets robotic-assisted surgical systems, primarily the da Vinci system, which enables minimally invasive surgeries. Investors should care because its technology is revolutionizing surgical procedures, driving adoption and revenue growth in the medical technology sector.
ISRG's technical situation is bearish, with an RSI(14) of 31.5 indicating oversold conditions, and a sustained downtrend as price ($401.13) remains below MA20, MA50, and MA200. The stock is testing major support at its 52-Week low, having lost 27.3% over the past year.
Related headlines
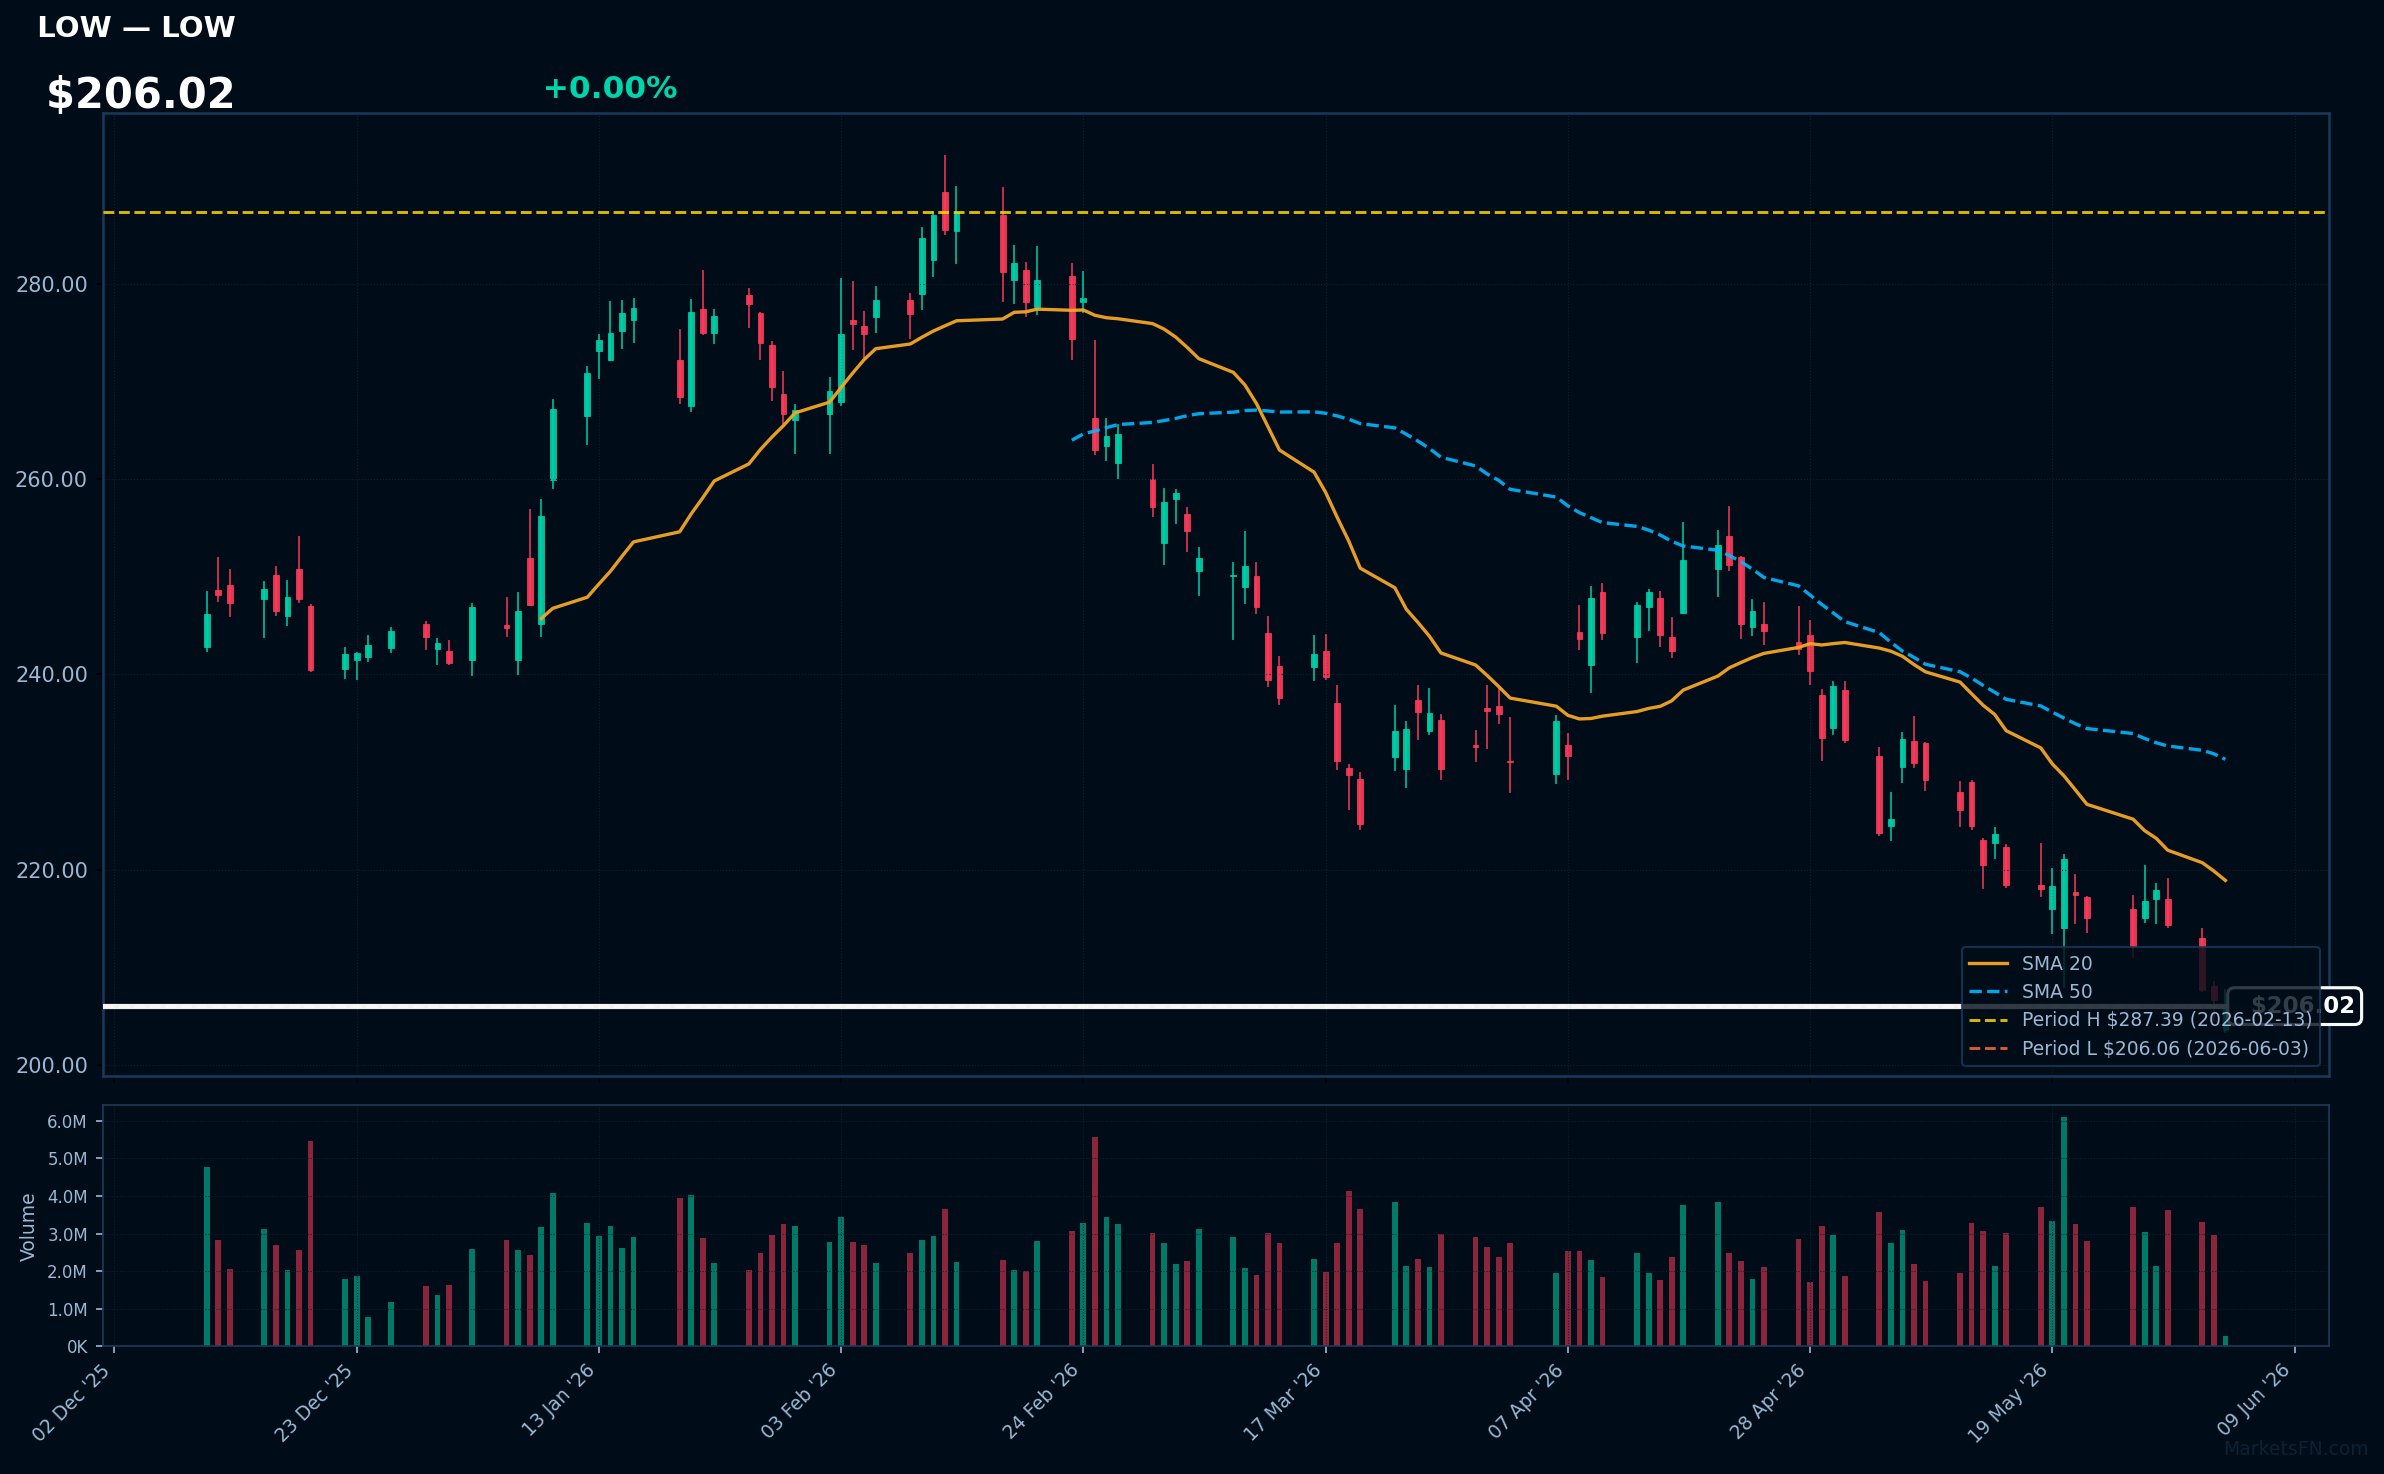
LOW | Lowe's Cos., Inc | Consumer Cyclical | Price Last: $206.06 | % Realized: -9.94% | RSI: 30.9 | % above MA200: -16.8% | Trend: Below MA20, MA50, MA200
Lowe's Cos., Inc is a home improvement retailer operating over 1,700 stores across North America, offering products for construction, renovation, and maintenance. Investors should care about its performance as it reflects housing market trends and consumer spending habits.
Lowe's is testing major support with its price 0.0% above 52-Week low. The RSI(14) is 30.9, indicating oversold conditions. Bearish MA alignment (price < 20MA < 50MA < 200MA) suggests a sustained downtrend, potentially a warning sign for investors.
Related headlines
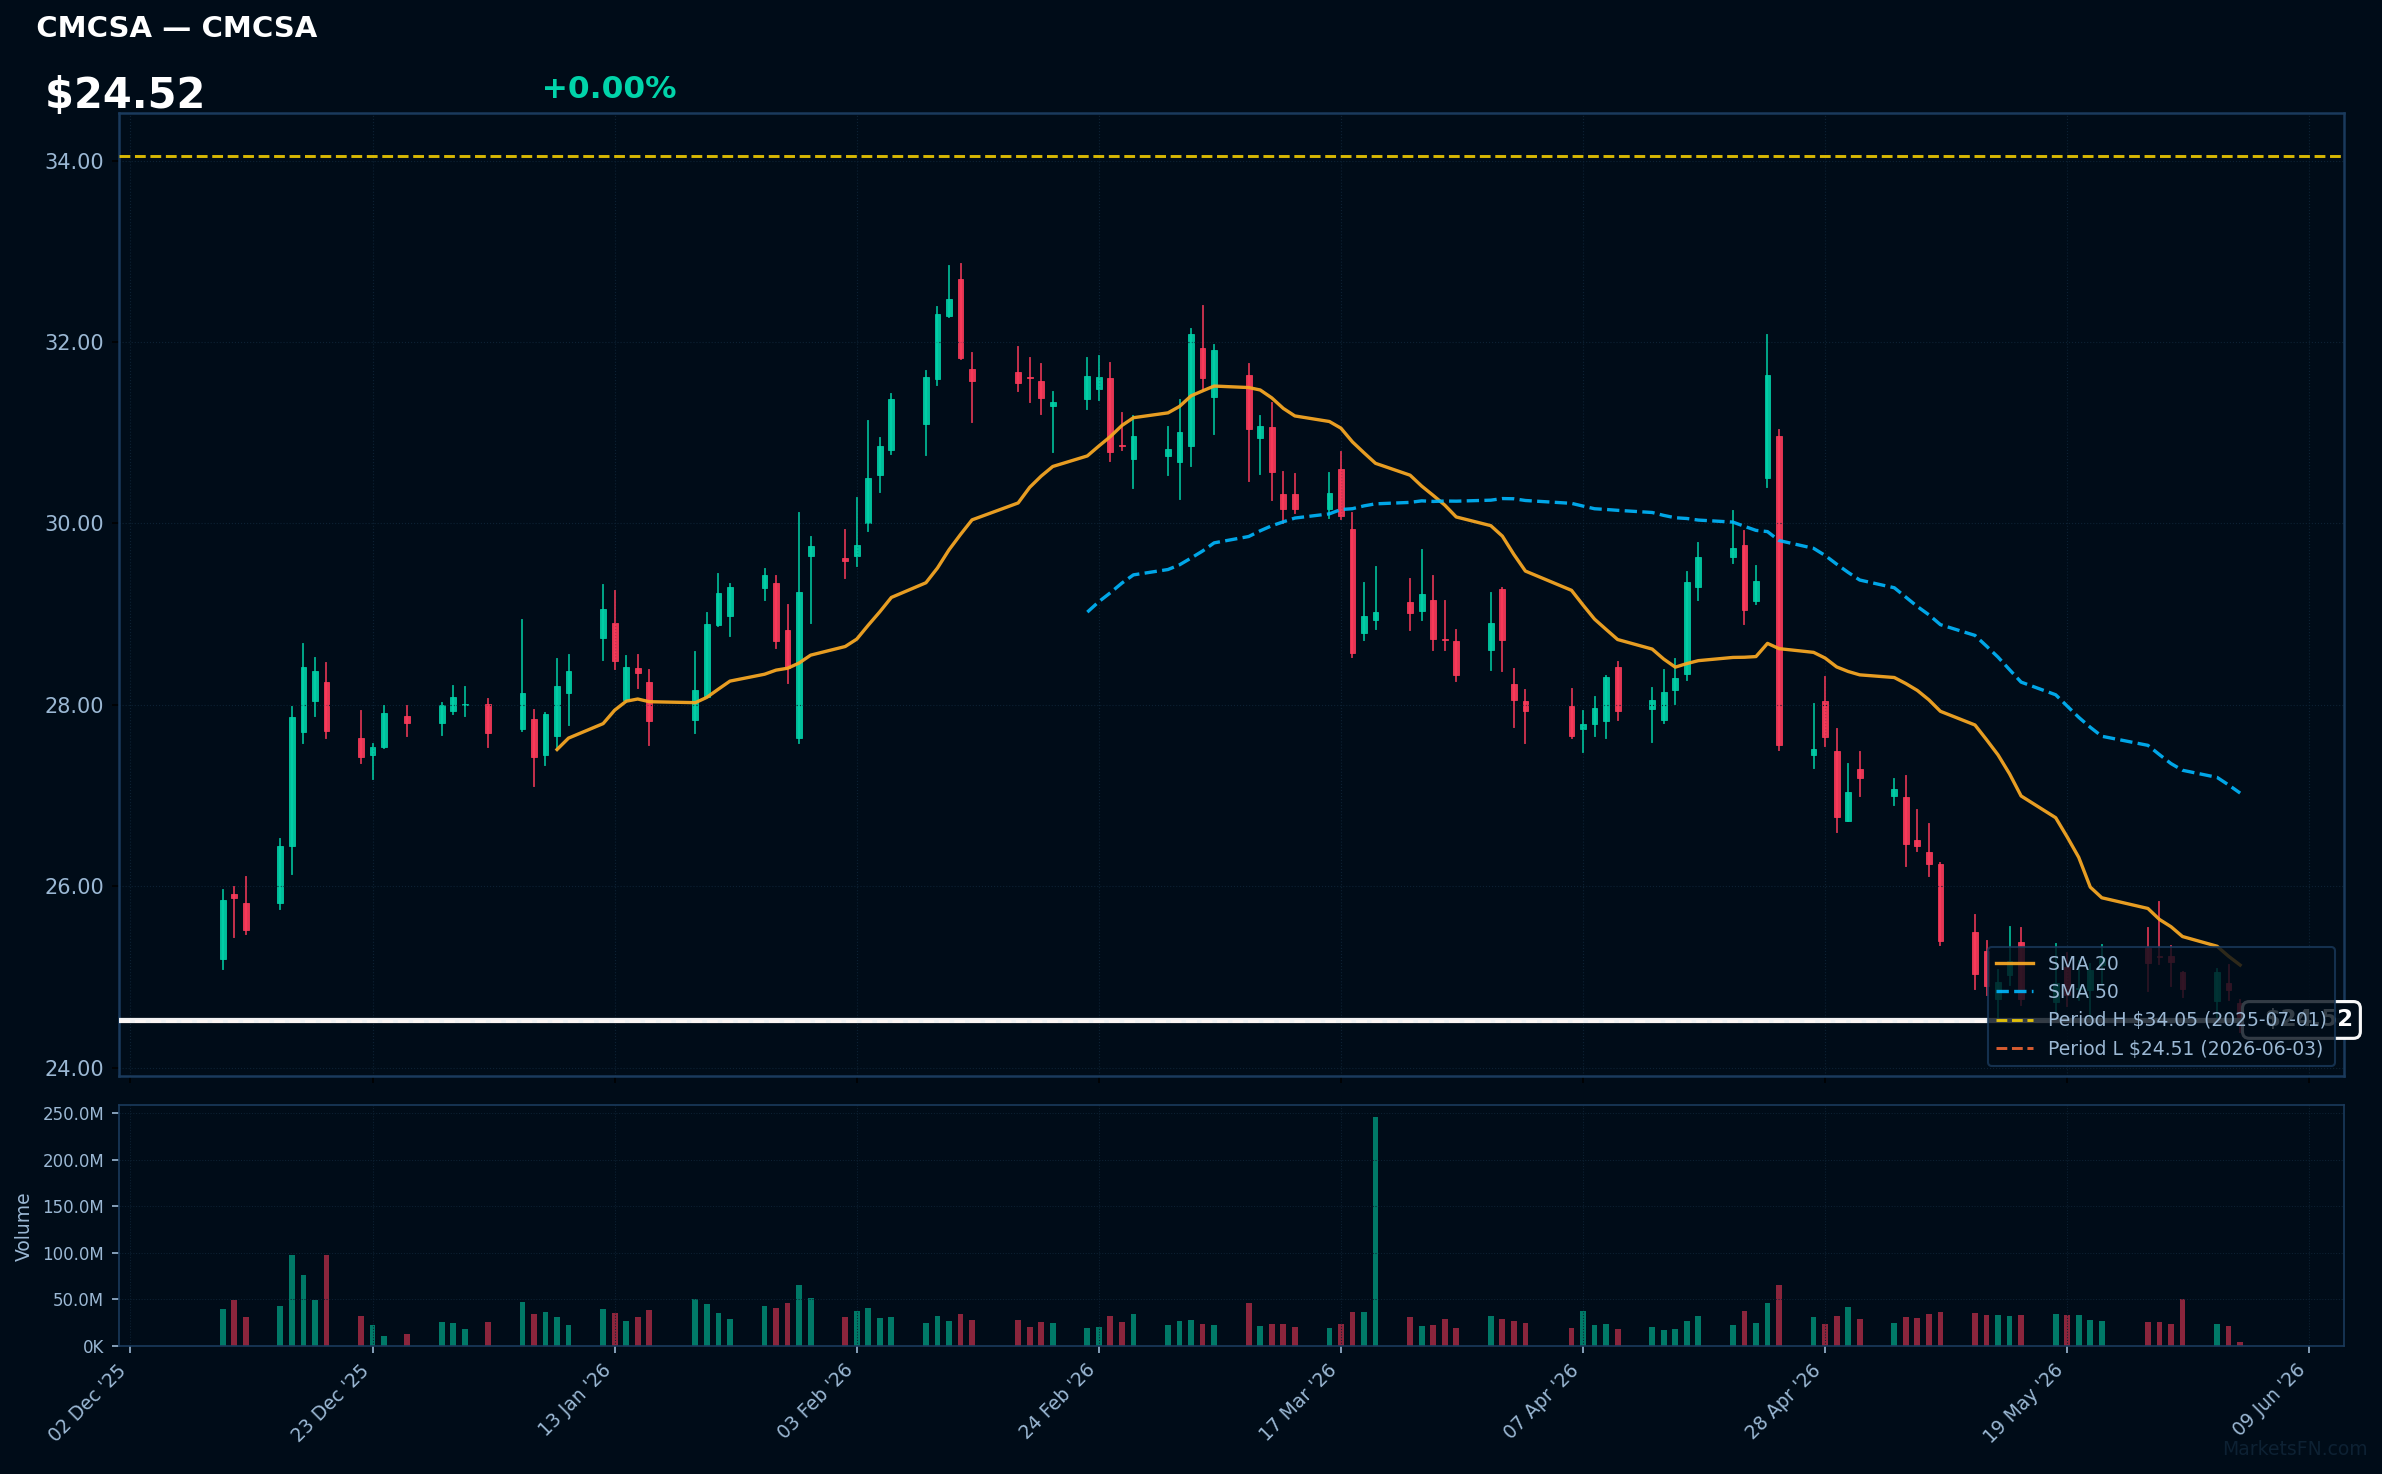
CMCSA | Comcast Corp | Communication Services | Price Last: $24.51 | % Realized: -24.53% | RSI: 33.0 | % above MA200: -13.6% | Trend: Below MA20, MA50, MA200
Comcast Corp is a media and telecommunications conglomerate providing cable television, internet, and phone services, as well as owning NBCUniversal, a major media company with film, television, and theme park assets, making it a significant player in both consumer connectivity and entertainment.
Comcast Corp's technical situation is bearish, with an RSI(14) of 33.0 indicating oversold conditions, and a sustained downtrend as price ($24.52) remains below MA20, MA50, and MA200, with the stock testing major support at its 52-Week low.
Related headlines
- Comcast Opens 20-Acre Kids Resort As Parks Push Expands
- Comcast's Universal Brings More Competition to Regional Parks
- Comcast Business Delivers Advanced Technology Infrastructure at Levis Stadium, Powering the Fan Experience and Stadium Operations
- Bellas Bites Serves Up Family-Inspired Flavor Powered by Comcast Business
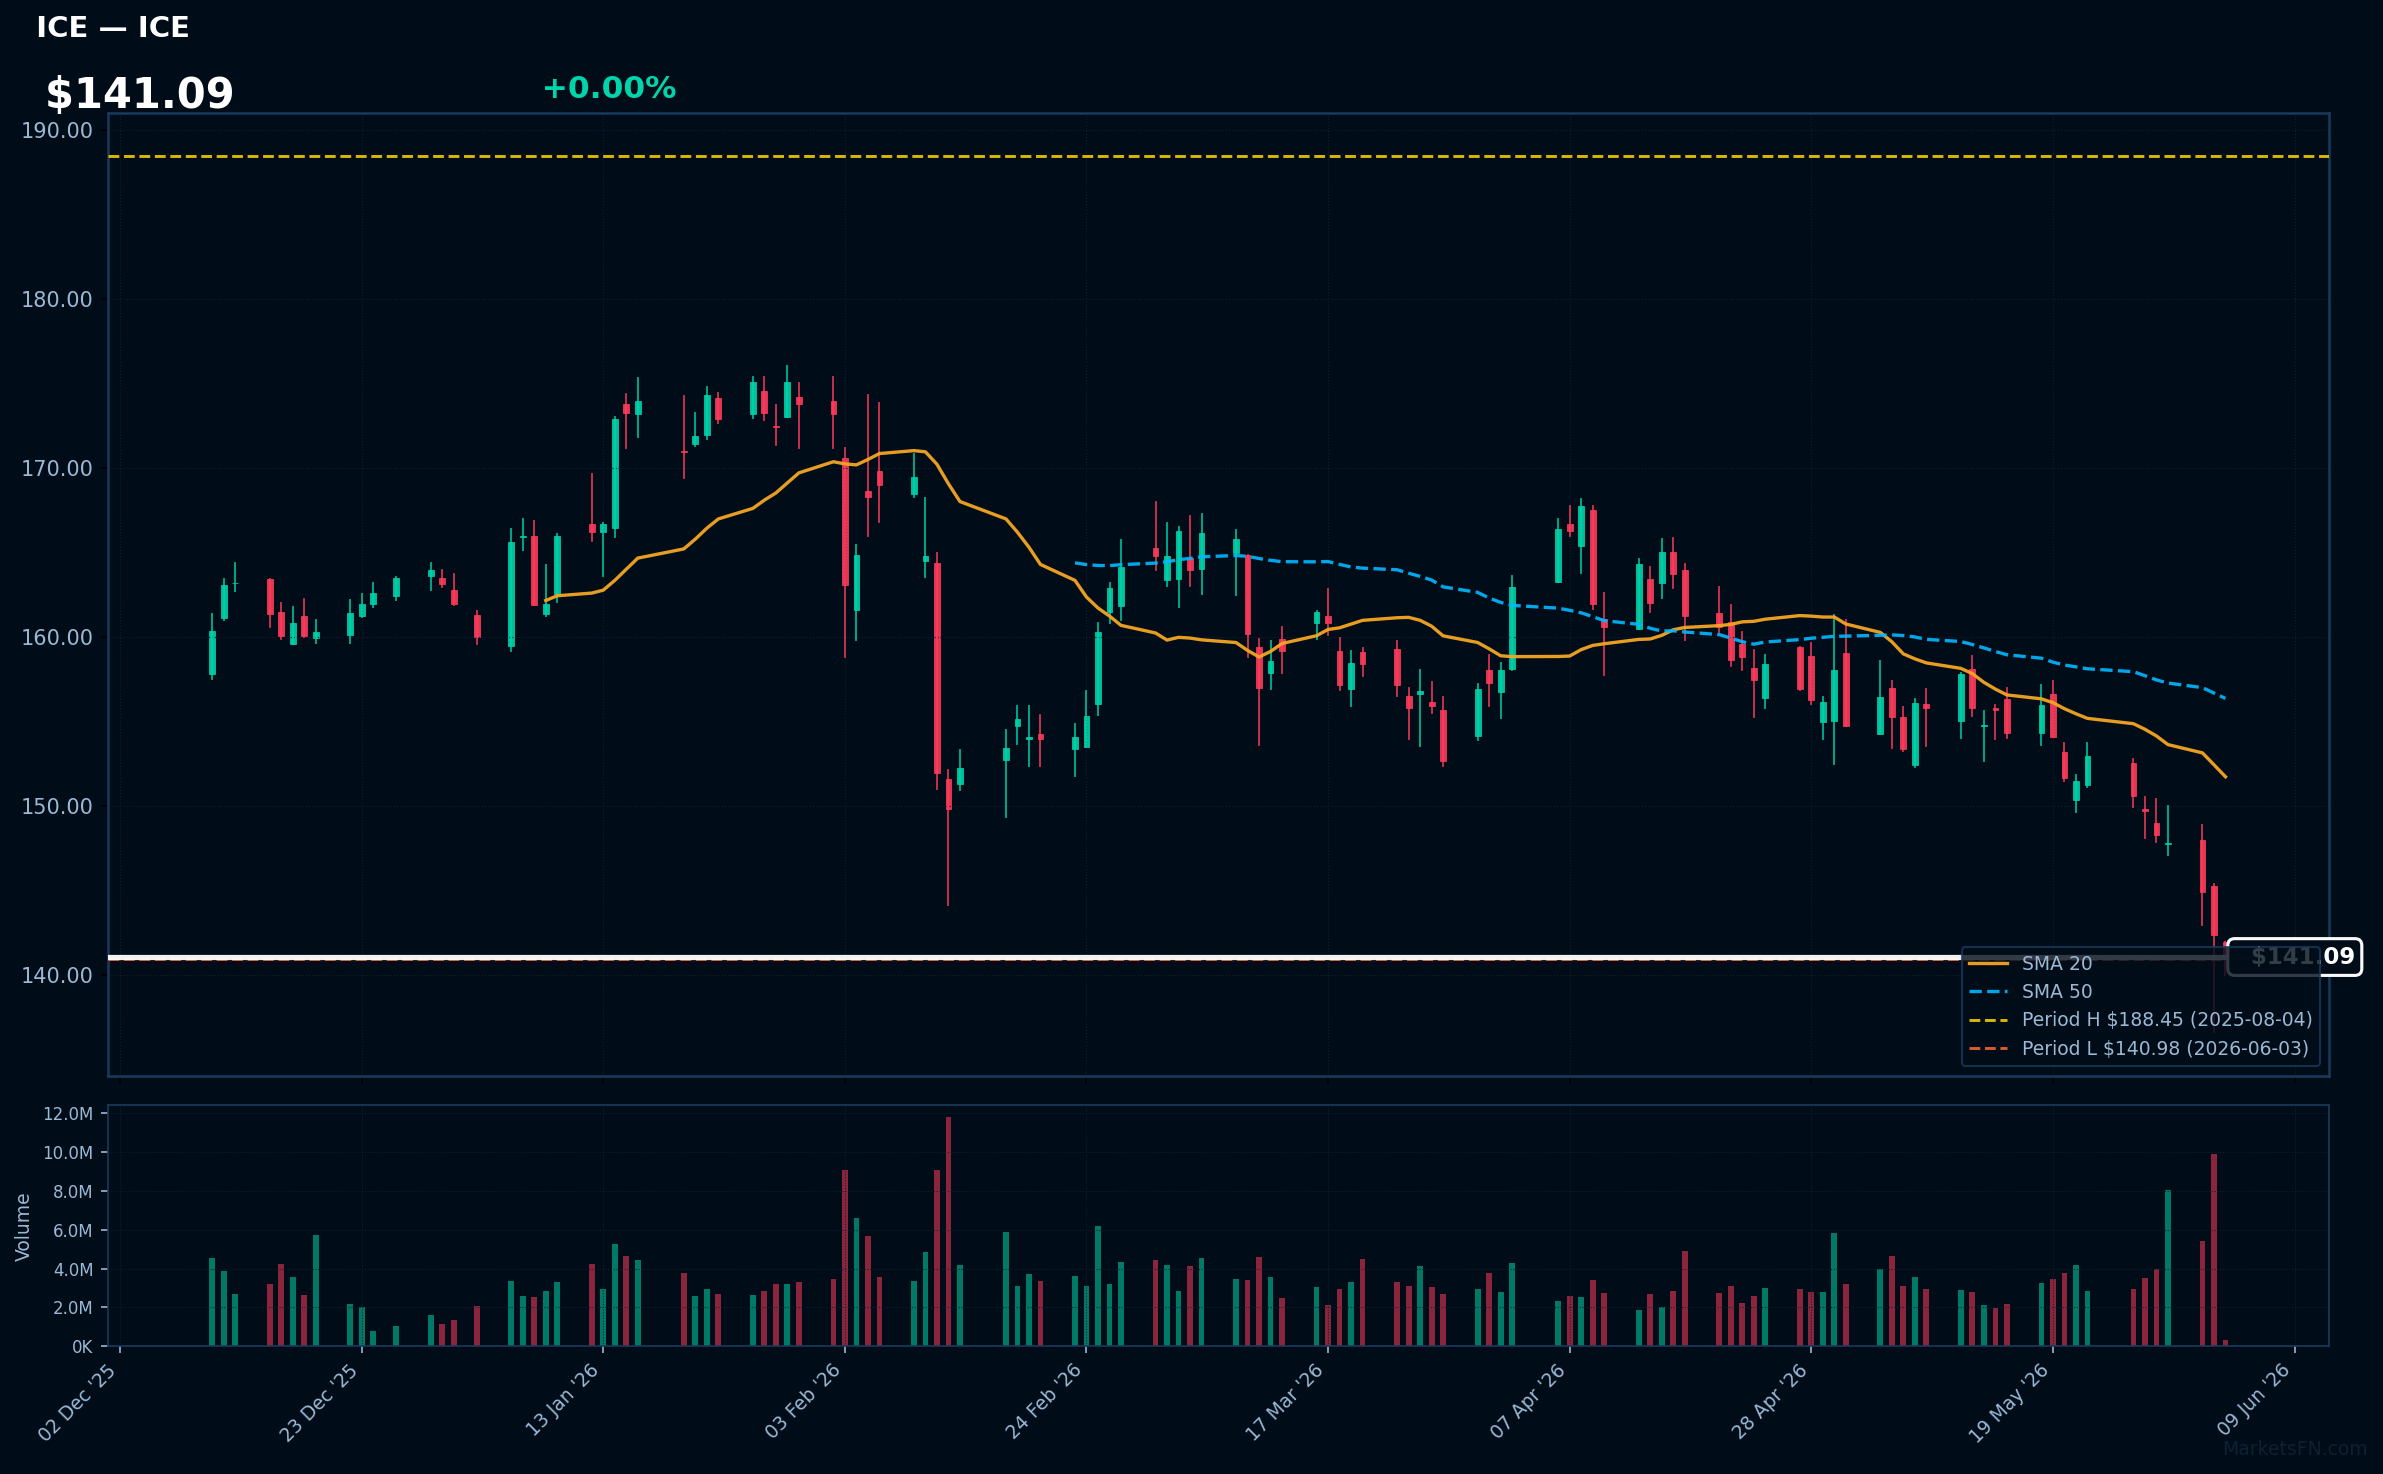
ICE | Intercontinental Exchange Inc | Financial | Price Last: $140.98 | % Realized: -21.39% | RSI: 24.5 | % above MA200: -12.6% | Trend: Below MA20, MA50, MA200
Intercontinental Exchange Inc (ICE) operates global exchanges, clearing houses, and data services, facilitating trading in financial and commodity markets; investors care due to its critical role in global financial infrastructure and potential exposure to market volatility.
ICE's technical situation indicates a sustained downtrend with price ($141.09) below MA20, MA50, and MA200; RSI(14) at 24.5 suggests oversold conditions, and being 0.0% above its 52-Week low signals testing of major support, potentially a warning sign.
Related headlines
- Intercontinental Exchange Reports May 2026 Statistics
- Intercontinental Exchange Joins Anthropic's Project Glasswing
- ICE Introduces Fraud Monitor to Help Mortgage Lenders Identify Fraud Risk and Accelerate Underwriting
- ICE's Total Futures and Options at Record Open Interest as Global Natural Gas and Power Markets Reach Record Levels of Liquidity
Market Commentary
The S&P 500 stocks listed are currently trading near their 52-week extremes, with some at all-time highs and others at yearly lows. Stocks like AAPL, AMD, AMAT, LRCX, and KLAC are at their 52-week highs, indicating strong performance, while MA, ISRG, LOW, CMCSA, and ICE are at their 52-week lows, suggesting potential weakness or undervaluation.
The stocks near 52-week highs are primarily from the technology and semiconductor sectors, potentially driven by macro themes such as advancements in AI, semiconductor demand, and technological innovation. Conversely, the stocks near 52-week lows span various sectors, including financials (MA, ICE), healthcare (ISRG), consumer discretionary (LOW), and communications (CMCSA), which may be influenced by different macroeconomic factors and sector rotations.
Key levels to watch include the sustainability of current price levels and potential catalysts such as earnings reports, macroeconomic data releases, and sector-specific news. Investors should monitor whether these stocks can maintain their current extremes or if they will revert to mean levels, potentially driven by changes in investor sentiment or broader market trends.
Methodology: All 503 S&P 500 constituents screened. 52-week high = highest daily close over the past 252 trading days (approx. 1 year). 52-week low = lowest daily close over the same period. Distance = (current price / extreme − 1) × 100. Technical indicators computed on up to 1 year of daily OHLCV data.
Disclaimer: For informational purposes only. Not investment advice. Past performance is not indicative of future results.