S&P 500 52-Week Highs & Lows Radar: Bank Of America (BAC), Palantir (PLTR) and more
· Stocks · MarketsFN Team
S&P 500 52-Week Highs & Lows Radar: Bank Of America (BAC), Palantir (PLTR) and more
Screening all 503 S&P 500 constituents for stocks nearest to their 52-week high and their 52-week low. Data as of June 23, 2026. % Realized = 52-week total return.
Legend: RSI > 70 = overbought · RSI < 30 = oversold · Green % Realized = positive 52W return · Red = negative.
📈 Nearest to 52-Week High
Sectors represented: Financial (3), Consumer Defensive (1), Utilities (1)
| Ticker | Company | Sector | Price Last | % Realized | 52-Week High Date | RSI | % above MA200 | Trend |
|---|---|---|---|---|---|---|---|---|
| BAC | Bank Of America Corp | Financial | $57.60 | +24.42% | 2026-06-23 | 73.1 | +10.1% | Above MA20, MA50, MA200 |
| TRV | Travelers Companies Inc | Financial | $314.07 | +17.36% | 2026-06-23 | 65.9 | +8.3% | Above MA20, MA50, MA200 |
| MNST | Monster Beverage Corp | Consumer Defensive | $93.26 | +47.55% | 2026-06-23 | 67.8 | +22.0% | Above MA20, MA50, MA200 |
| ALL | Allstate Corp | Financial | $228.46 | +15.19% | 2026-06-23 | 64.3 | +9.9% | Above MA20, MA50, MA200 |
| D | Dominion Energy Inc | Utilities | $68.61 | +22.78% | 2026-06-23 | 61.0 | +10.8% | Above MA20, MA50, MA200 |
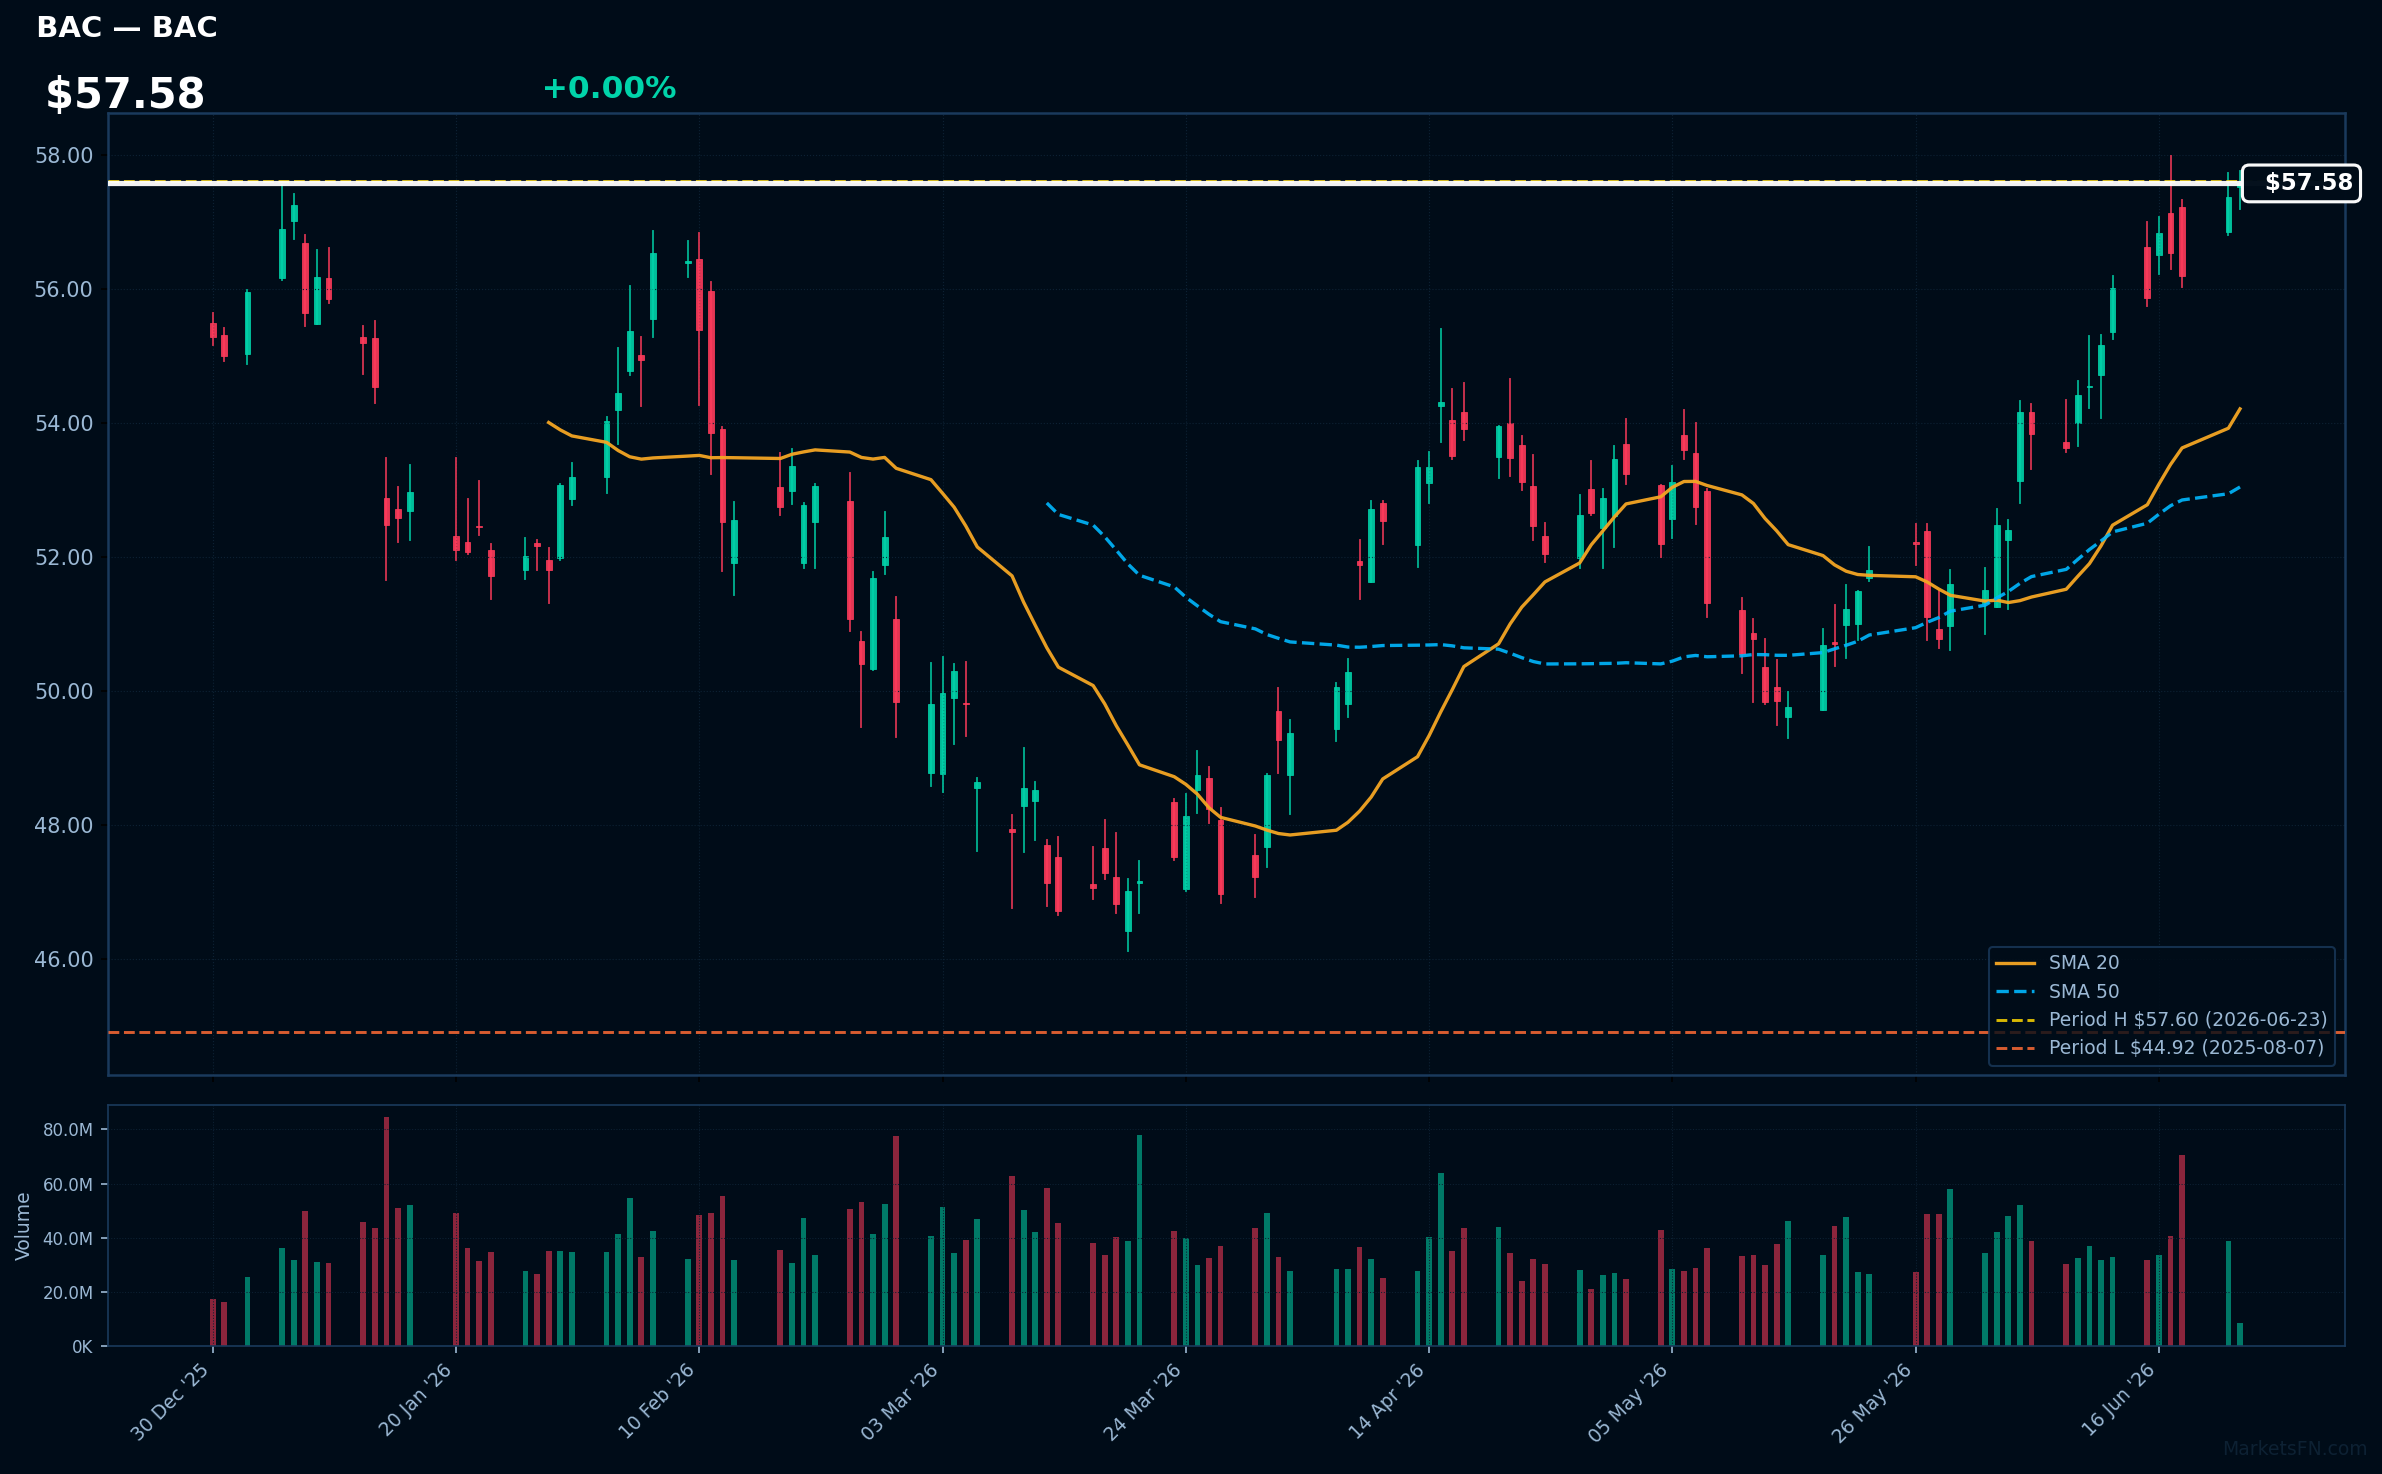
BAC | Bank Of America Corp | Financial | Price Last: $57.60 | % Realized: +24.42% | RSI: 73.1 | % above MA200: +10.1% | Trend: Above MA20, MA50, MA200
Bank Of America Corp is a global bank providing consumer and commercial banking, wealth management, and investment banking services. Investors care about its performance as it reflects the overall health of the US economy and consumer credit.
The stock is in a sustained uptrend with price > MA20 > MA50 > MA200, RSI(14) at 73.1, and is 0.0% below its 52-Week high, indicating strong momentum; however, the high RSI may be a warning sign of overbought conditions.
Related headlines
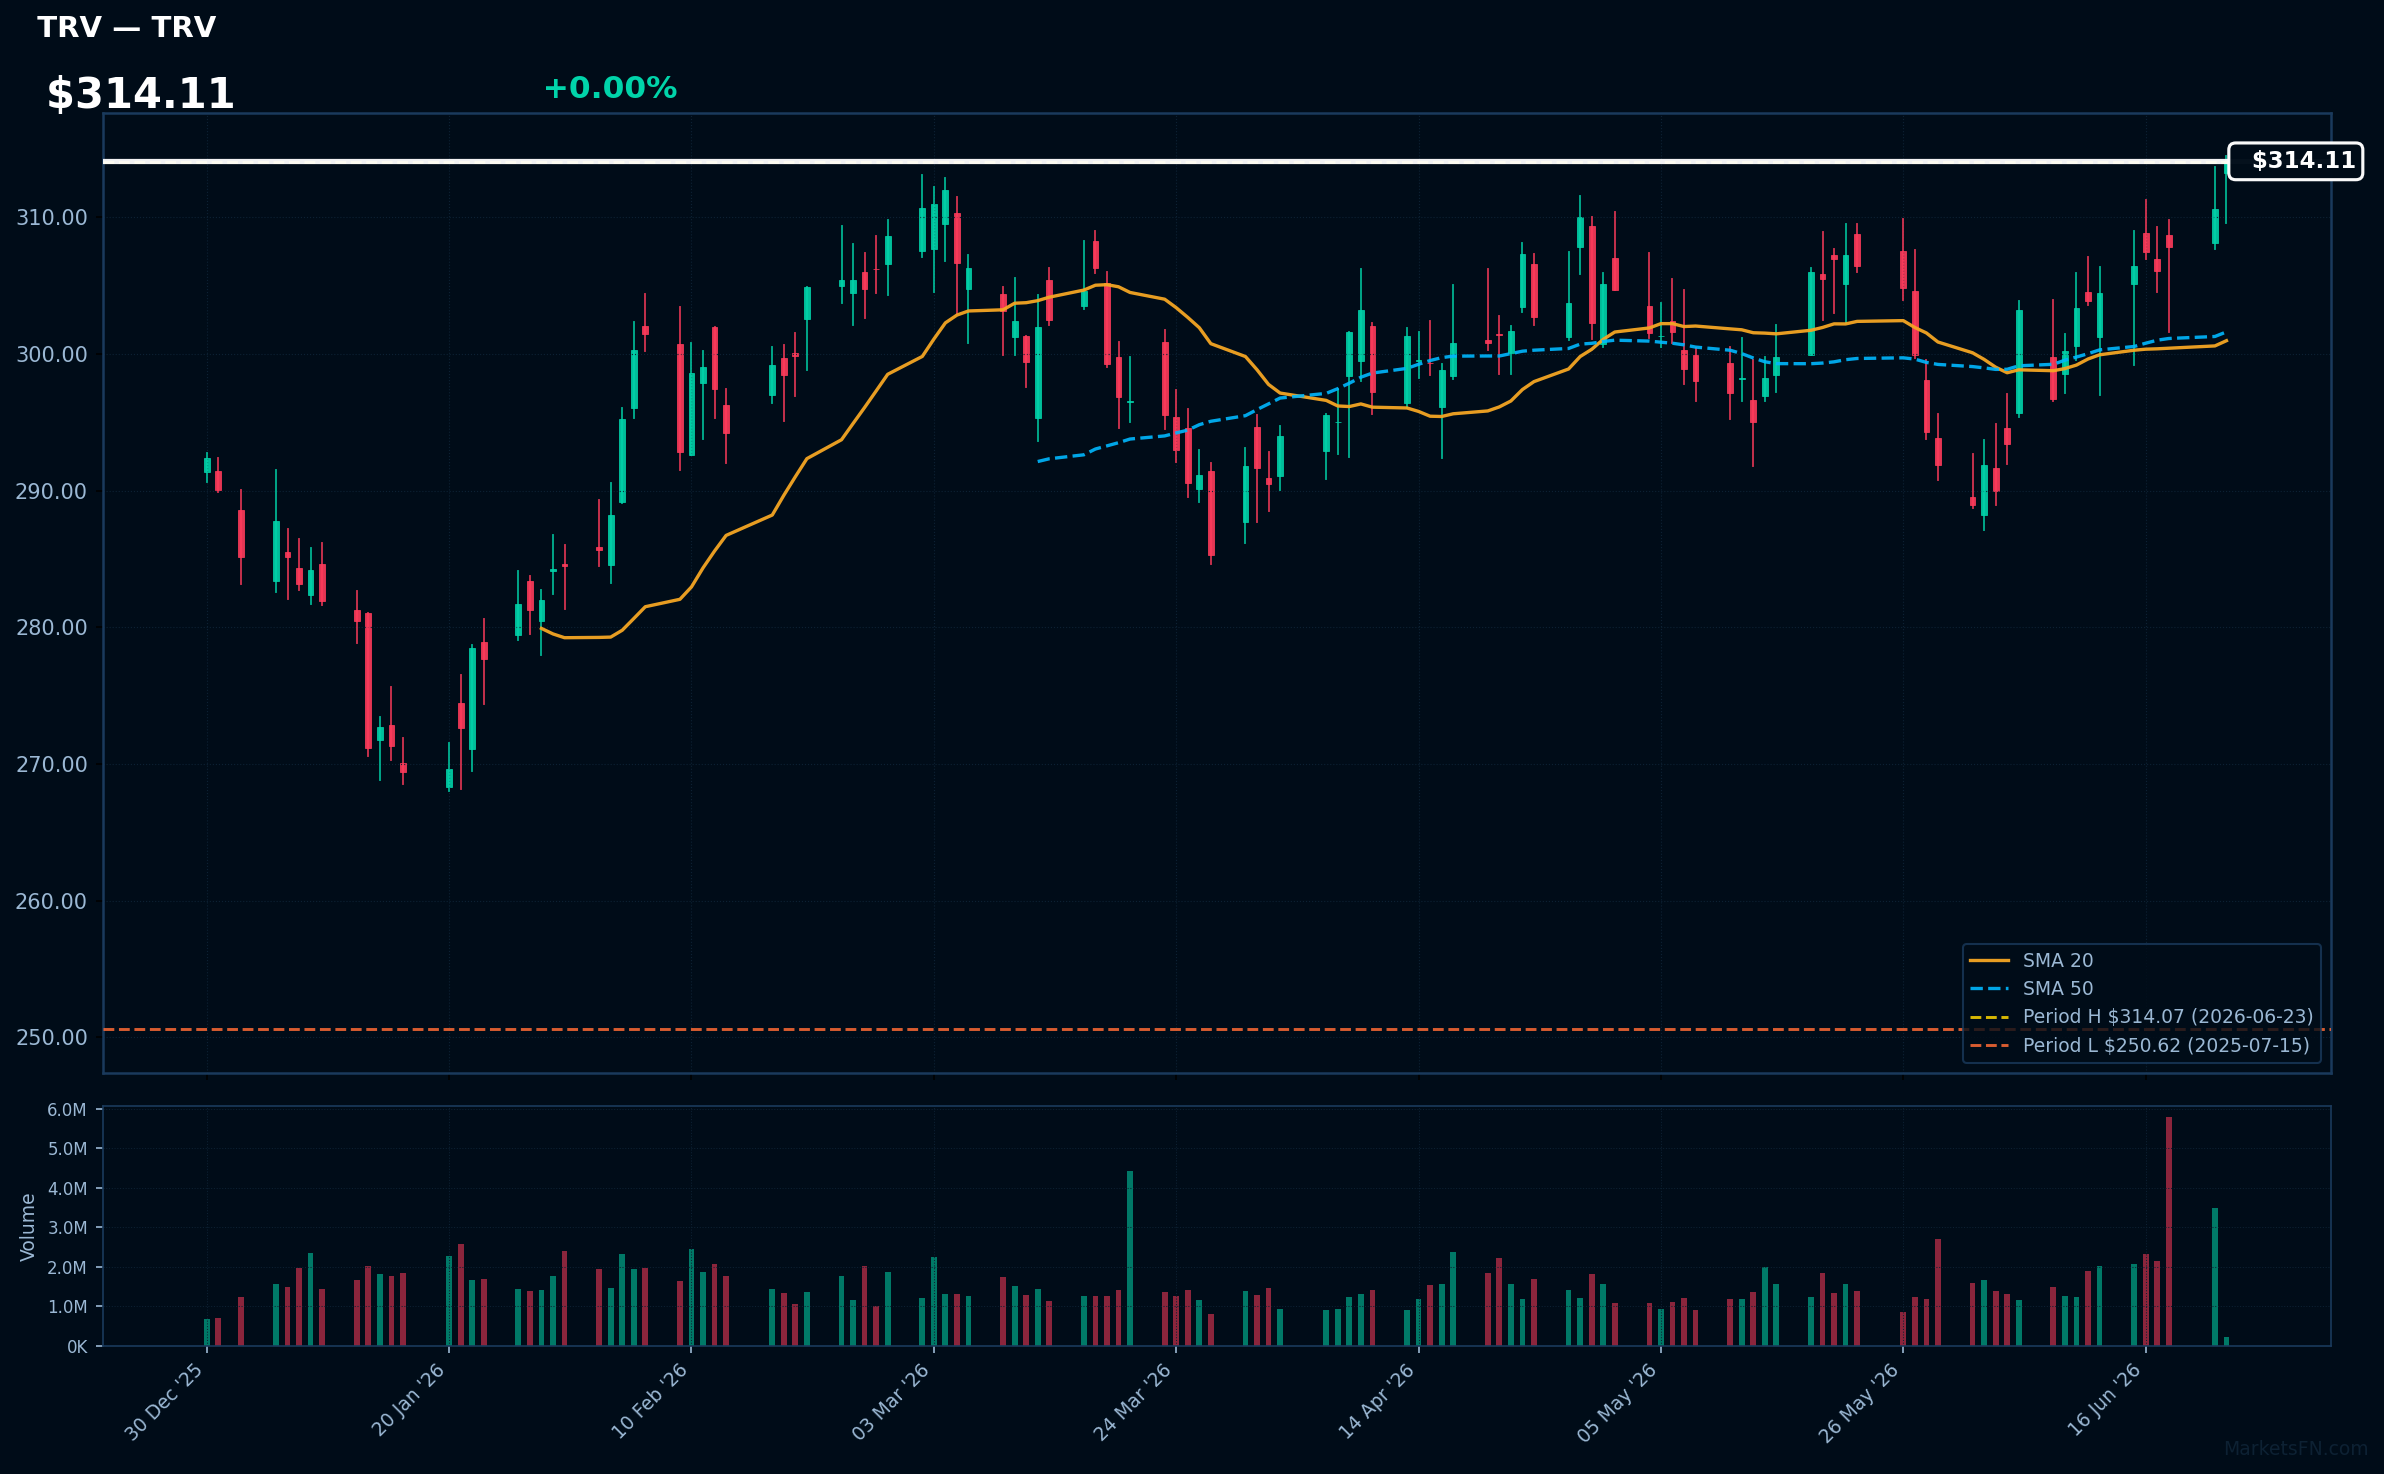
TRV | Travelers Companies Inc | Financial | Price Last: $314.07 | % Realized: +17.36% | RSI: 65.9 | % above MA200: +8.3% | Trend: Above MA20, MA50, MA200
Travelers Companies Inc (TRV) is a property casualty insurer providing various insurance products. Investors should care about its performance as it reflects the company's risk management and pricing power in the insurance market.
TRV's RSI(14) is 65.9, indicating rising momentum. With the price above MA20, MA50, and MA200, and being 0.0% below its 52-Week high, the stock shows strong technical alignment, suggesting continued upward momentum.
Related headlines
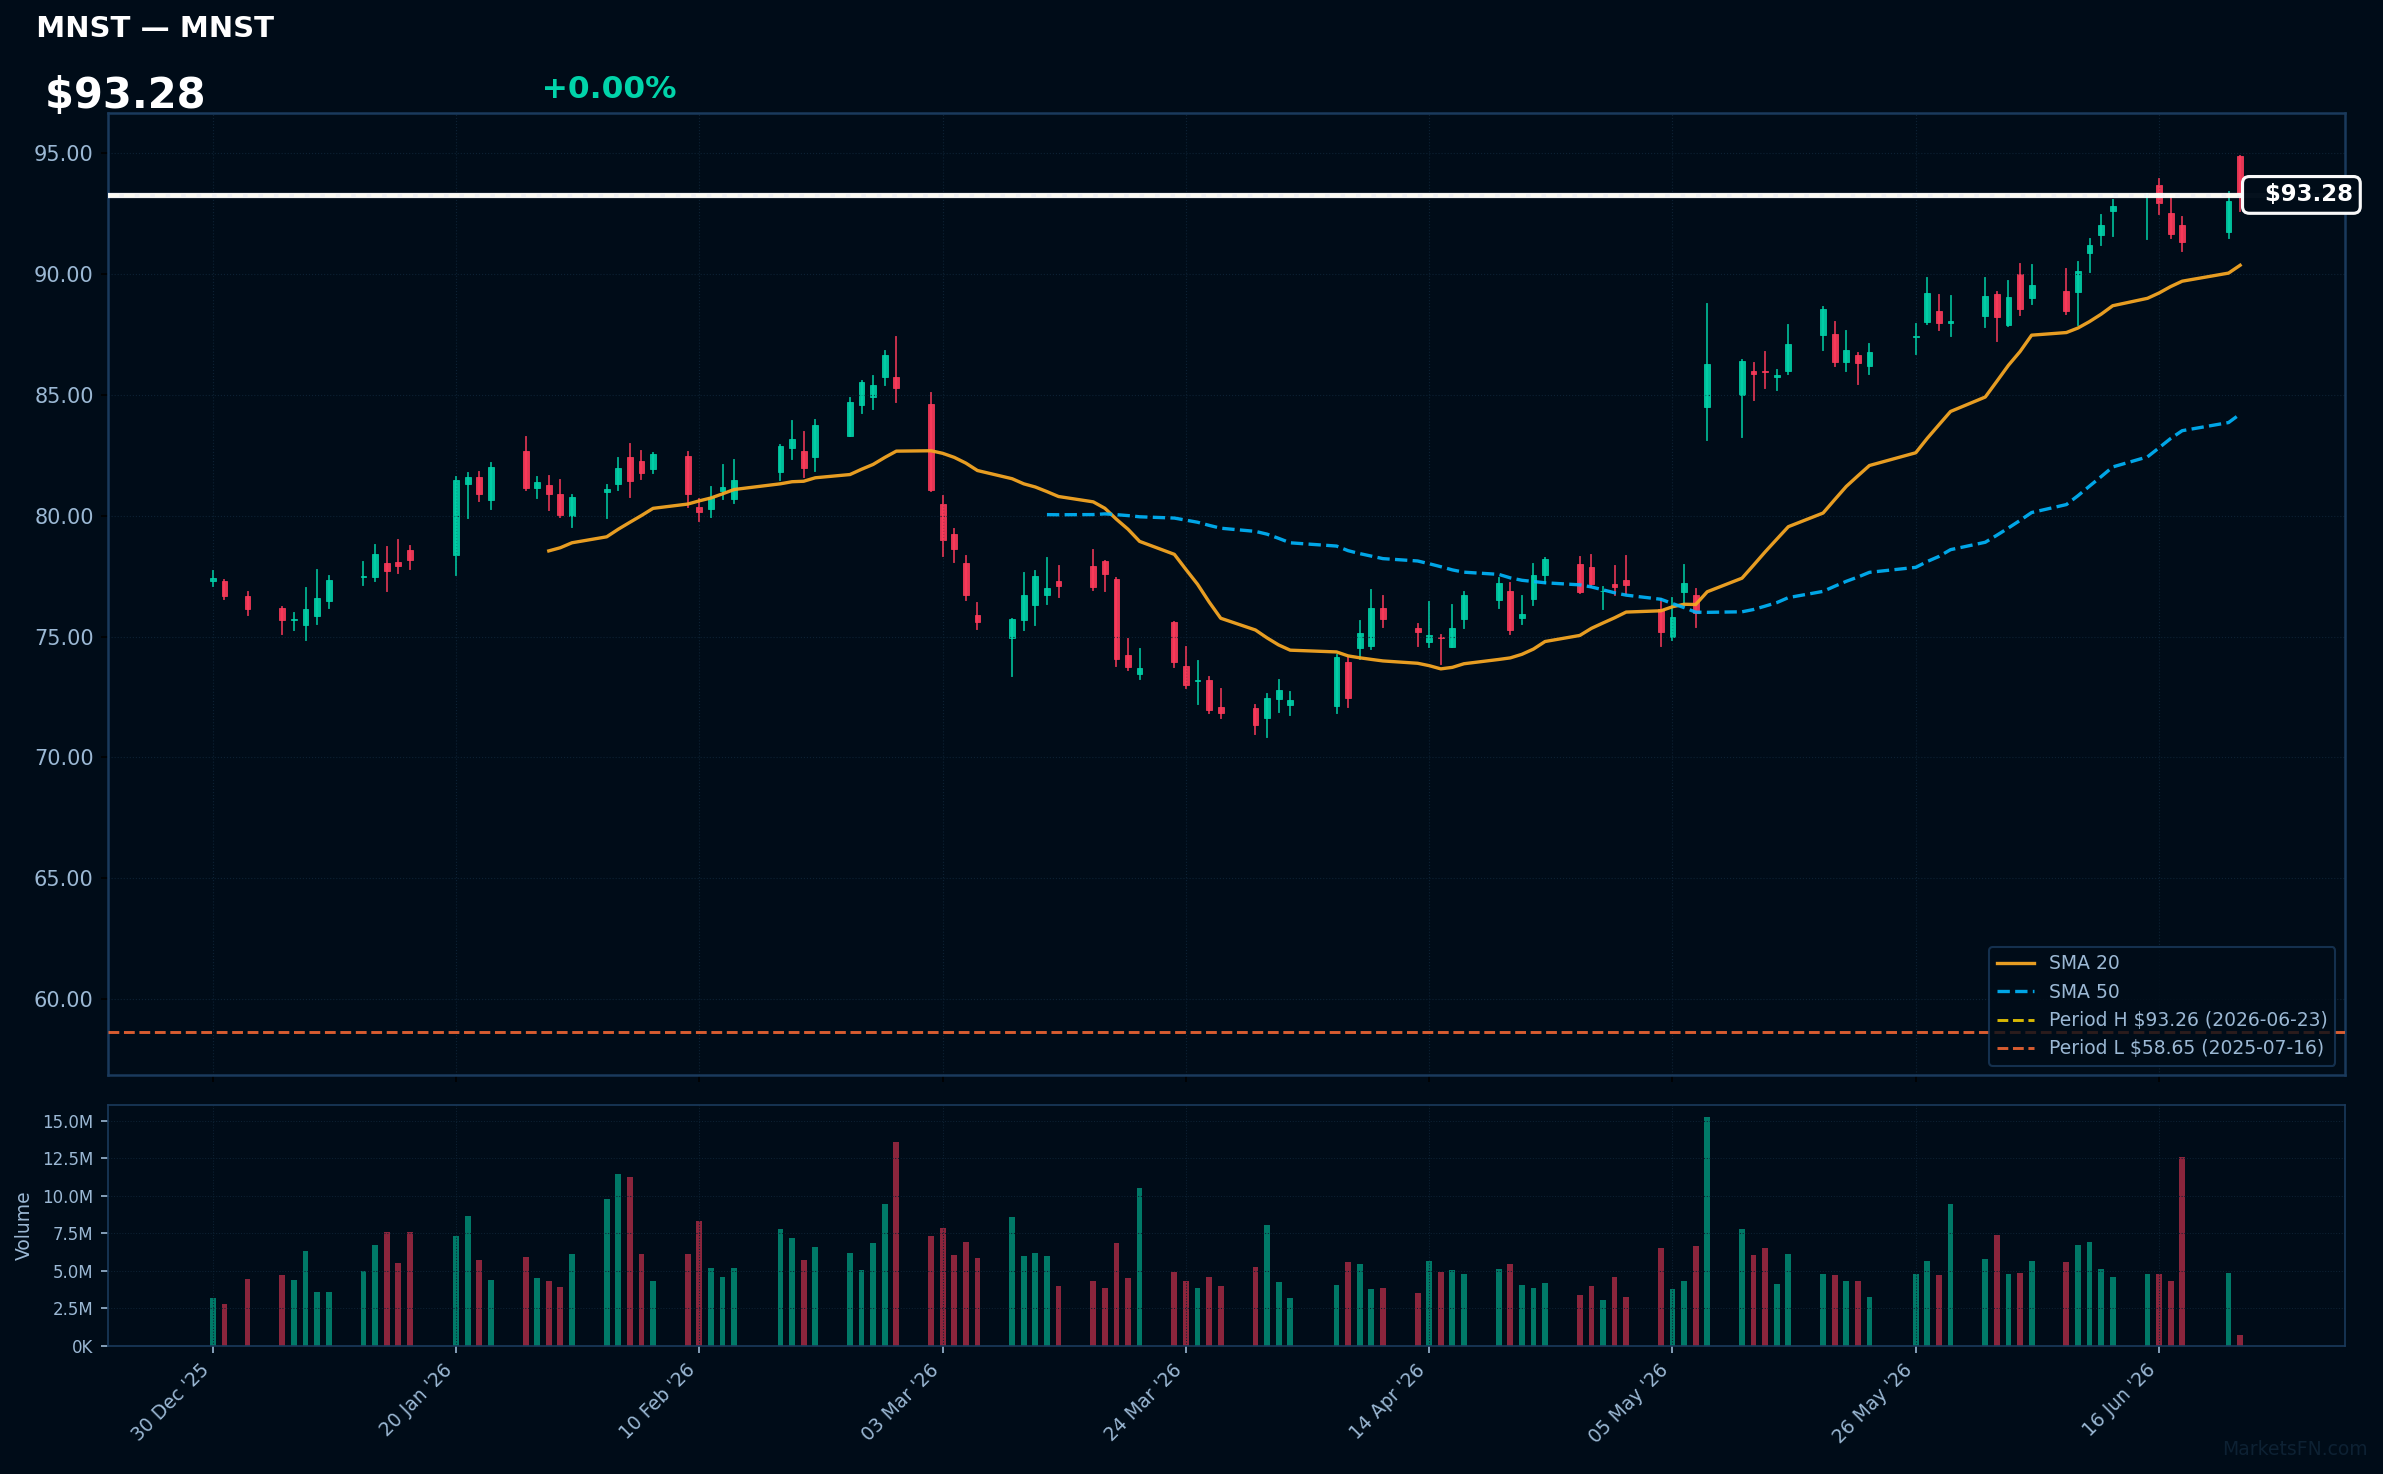
MNST | Monster Beverage Corp | Consumer Defensive | Price Last: $93.26 | % Realized: +47.55% | RSI: 67.8 | % above MA200: +22.0% | Trend: Above MA20, MA50, MA200
Monster Beverage Corp is a leading energy drink manufacturer with popular brands like Monster Energy. Investors should care due to its strong brand portfolio and growth potential in the energy drink market.
The stock shows bullish MA alignment with price > MA20 > MA50 > MA200 and RSI(14) at 67.8, indicating sustained uptrend and momentum. It's near its 52-Week high, 0.0% below, suggesting a potential breakout.
Related headlines
- Massive Gap-Up Propels This Monster To Record High. These Clues Point To More Gains Ahead.
- Monster Beverage Announces Participation in dbAccess Global Consumer Conference 2026
- Dow Jones Leader Amazon, AI Stock Quanta, Monster Beverage In Or Near Buy Zones
- See How Institutions Drive Monster Beverage Shares Higher
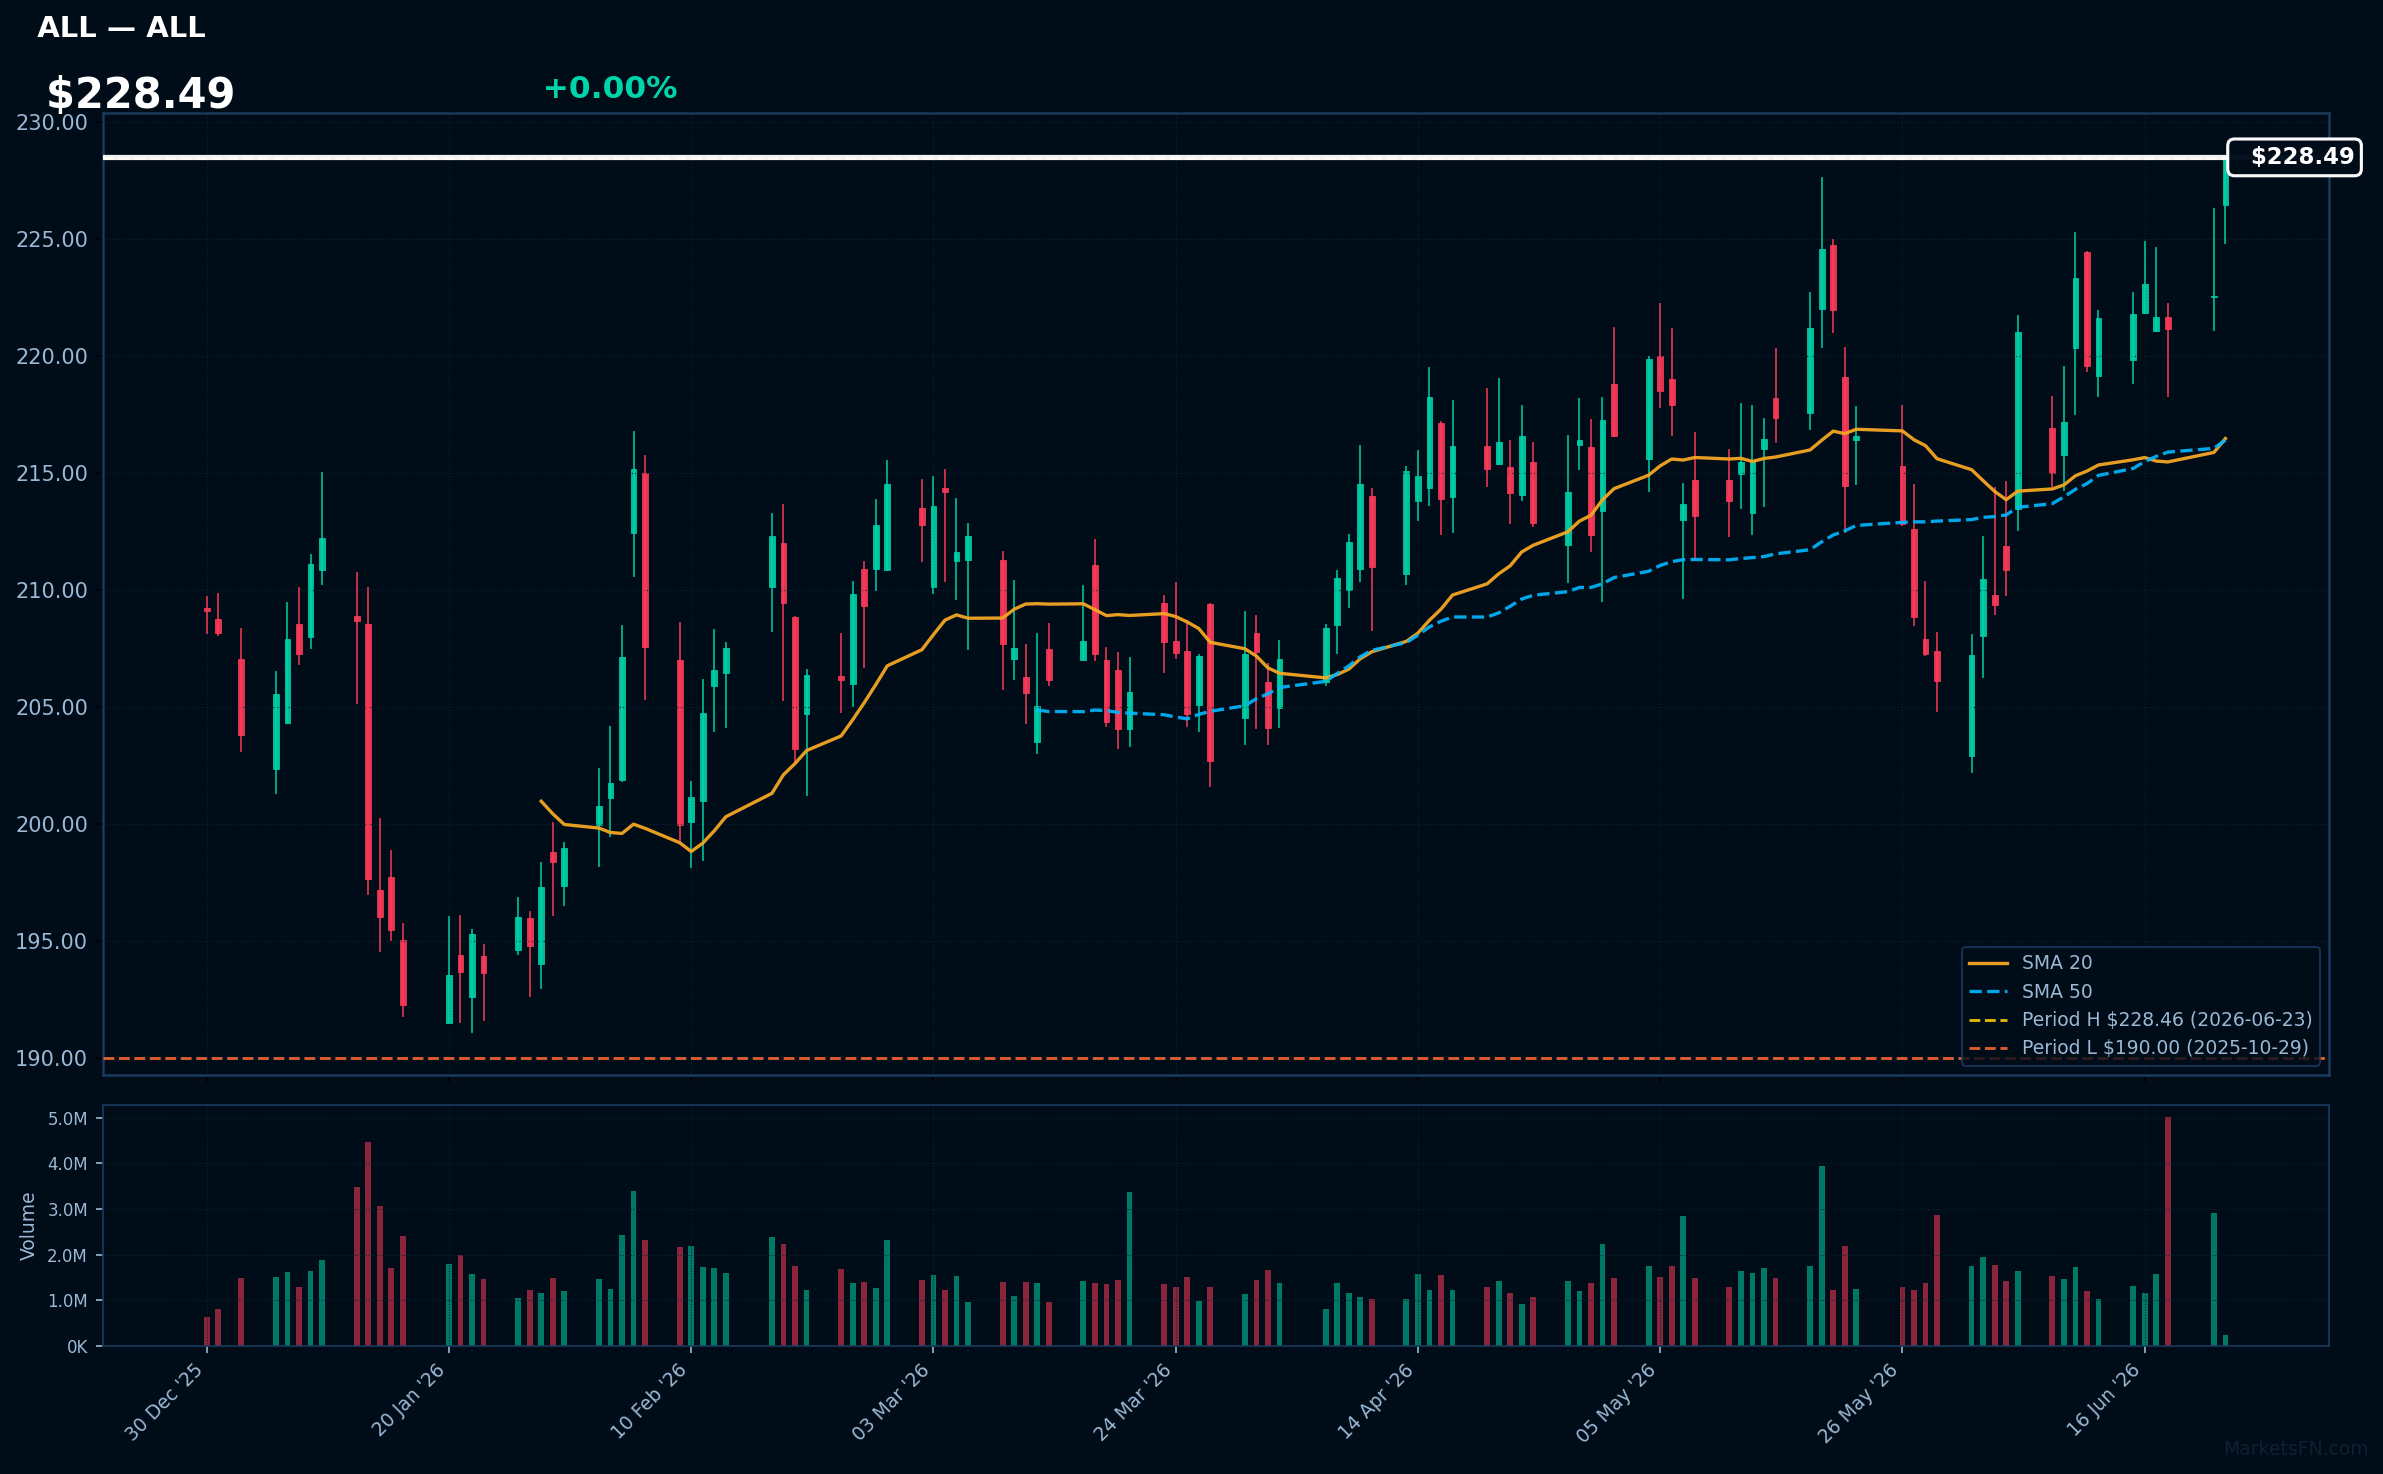
ALL | Allstate Corp | Financial | Price Last: $228.46 | % Realized: +15.19% | RSI: 64.3 | % above MA200: +9.9% | Trend: Above MA20, MA50, MA200
Allstate Corp is a leading personal lines insurer in the US, offering auto, home, and life insurance products. Investors should care about its ability to navigate competitive markets, manage claims, and adapt to regulatory changes, impacting its profitability and growth.
Allstate Corp's current technical situation indicates momentum, with an RSI(14) of 64.3 and a bullish MA alignment (price > MA20 > MA50 > MA200), suggesting a sustained uptrend. The stock is 0.0% below its 52-Week high, near a potential breakout level.
Related headlines
- Cerebras initiated, Crocs upgraded: Wall Street's top analyst calls
- Allstate announces quarterly dividends payable in July 2026
- University of Virginia coxswain and volunteer firefighter and EMT Shelby Bavin named captain of the Allstate NACDA Spring Good Works Team
- The Allstate Corporation Q1 2026 Earnings Call Summary
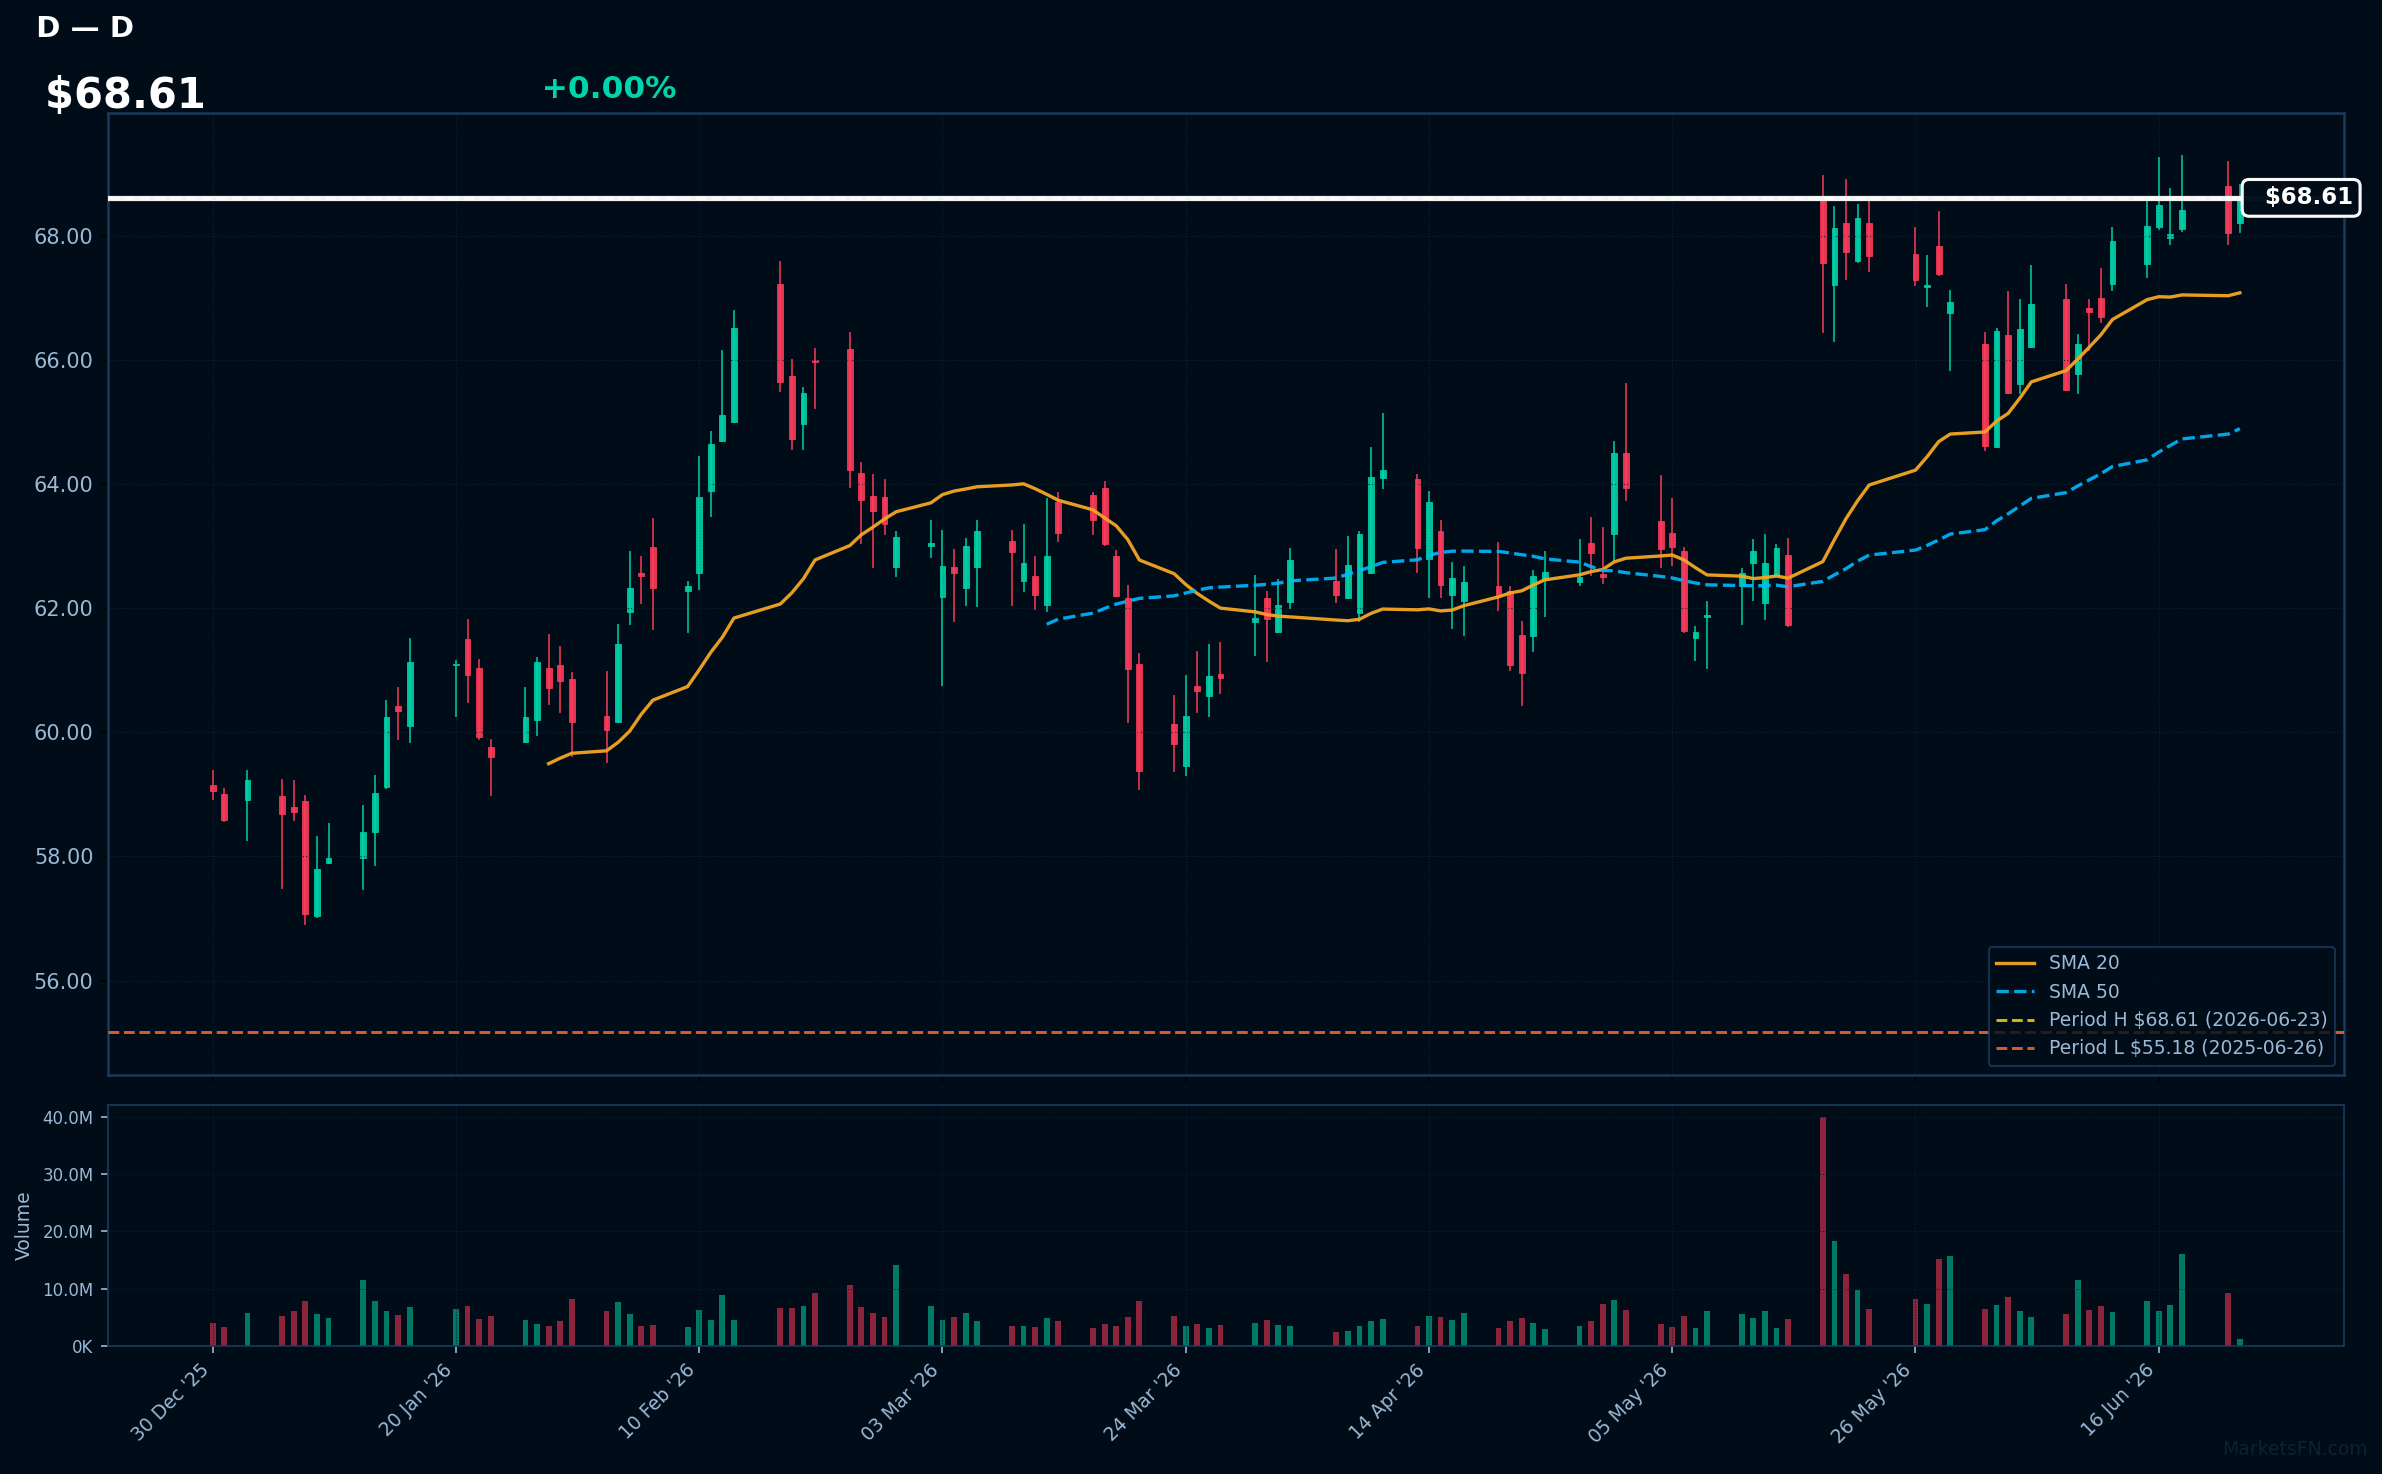
D | Dominion Energy Inc | Utilities | Price Last: $68.61 | % Realized: +22.78% | RSI: 61.0 | % above MA200: +10.8% | Trend: Above MA20, MA50, MA200
Dominion Energy Inc is a utility company that generates and distributes electricity and natural gas. Investors should care because its stable cash flows and dividend yield can provide a defensive component to a portfolio, especially during economic downturns.
Dominion Energy Inc is in a sustained uptrend with price > MA20 > MA50 > MA200, RSI(14) at 61.0, and is 0.0% below its 52-Week high, indicating strong momentum with no signs of overbought conditions, as the RSI is below 70.
Related headlines
- U.S. Bets Billions of Dollars in Low-Cost Loans Can Revive Nuclear Power
- NextEra to pay $150M to settle charges related to Florida political misconduct allegations
- NextEra agrees to pay $150M to settle charges officials lied about Florida political misconduct
- Dominion to buy land for North Carolina offshore wind project
📉 Nearest to 52-Week Low
Sectors represented: Communication Services (3), Technology (2)
| Ticker | Company | Sector | Price Last | % Realized | 52-Week Low Date | RSI | % above MA200 | Trend |
|---|---|---|---|---|---|---|---|---|
| PLTR | Palantir Technologies Inc | Technology | $119.21 | -14.80% | 2026-06-23 | 34.3 | -25.3% | Below MA20, MA50, MA200 |
| CTSH | Cognizant Technology Solutions Corp | Technology | $41.42 | -46.02% | 2026-06-23 | 22.6 | -38.5% | Below MA20, MA50, MA200 |
| TTD | Trade Desk Inc | Communication Services | $17.69 | -74.31% | 2026-06-23 | 34.0 | -47.0% | Below MA20, MA50, MA200 |
| FOX | Fox Corporation | Communication Services | $44.65 | -13.13% | 2026-06-23 | 23.2 | -22.0% | Below MA20, MA50, MA200 |
| FOXA | Fox Corporation | Communication Services | $48.99 | -12.64% | 2026-06-23 | 23.6 | -23.1% | Below MA20, MA50, MA200 |
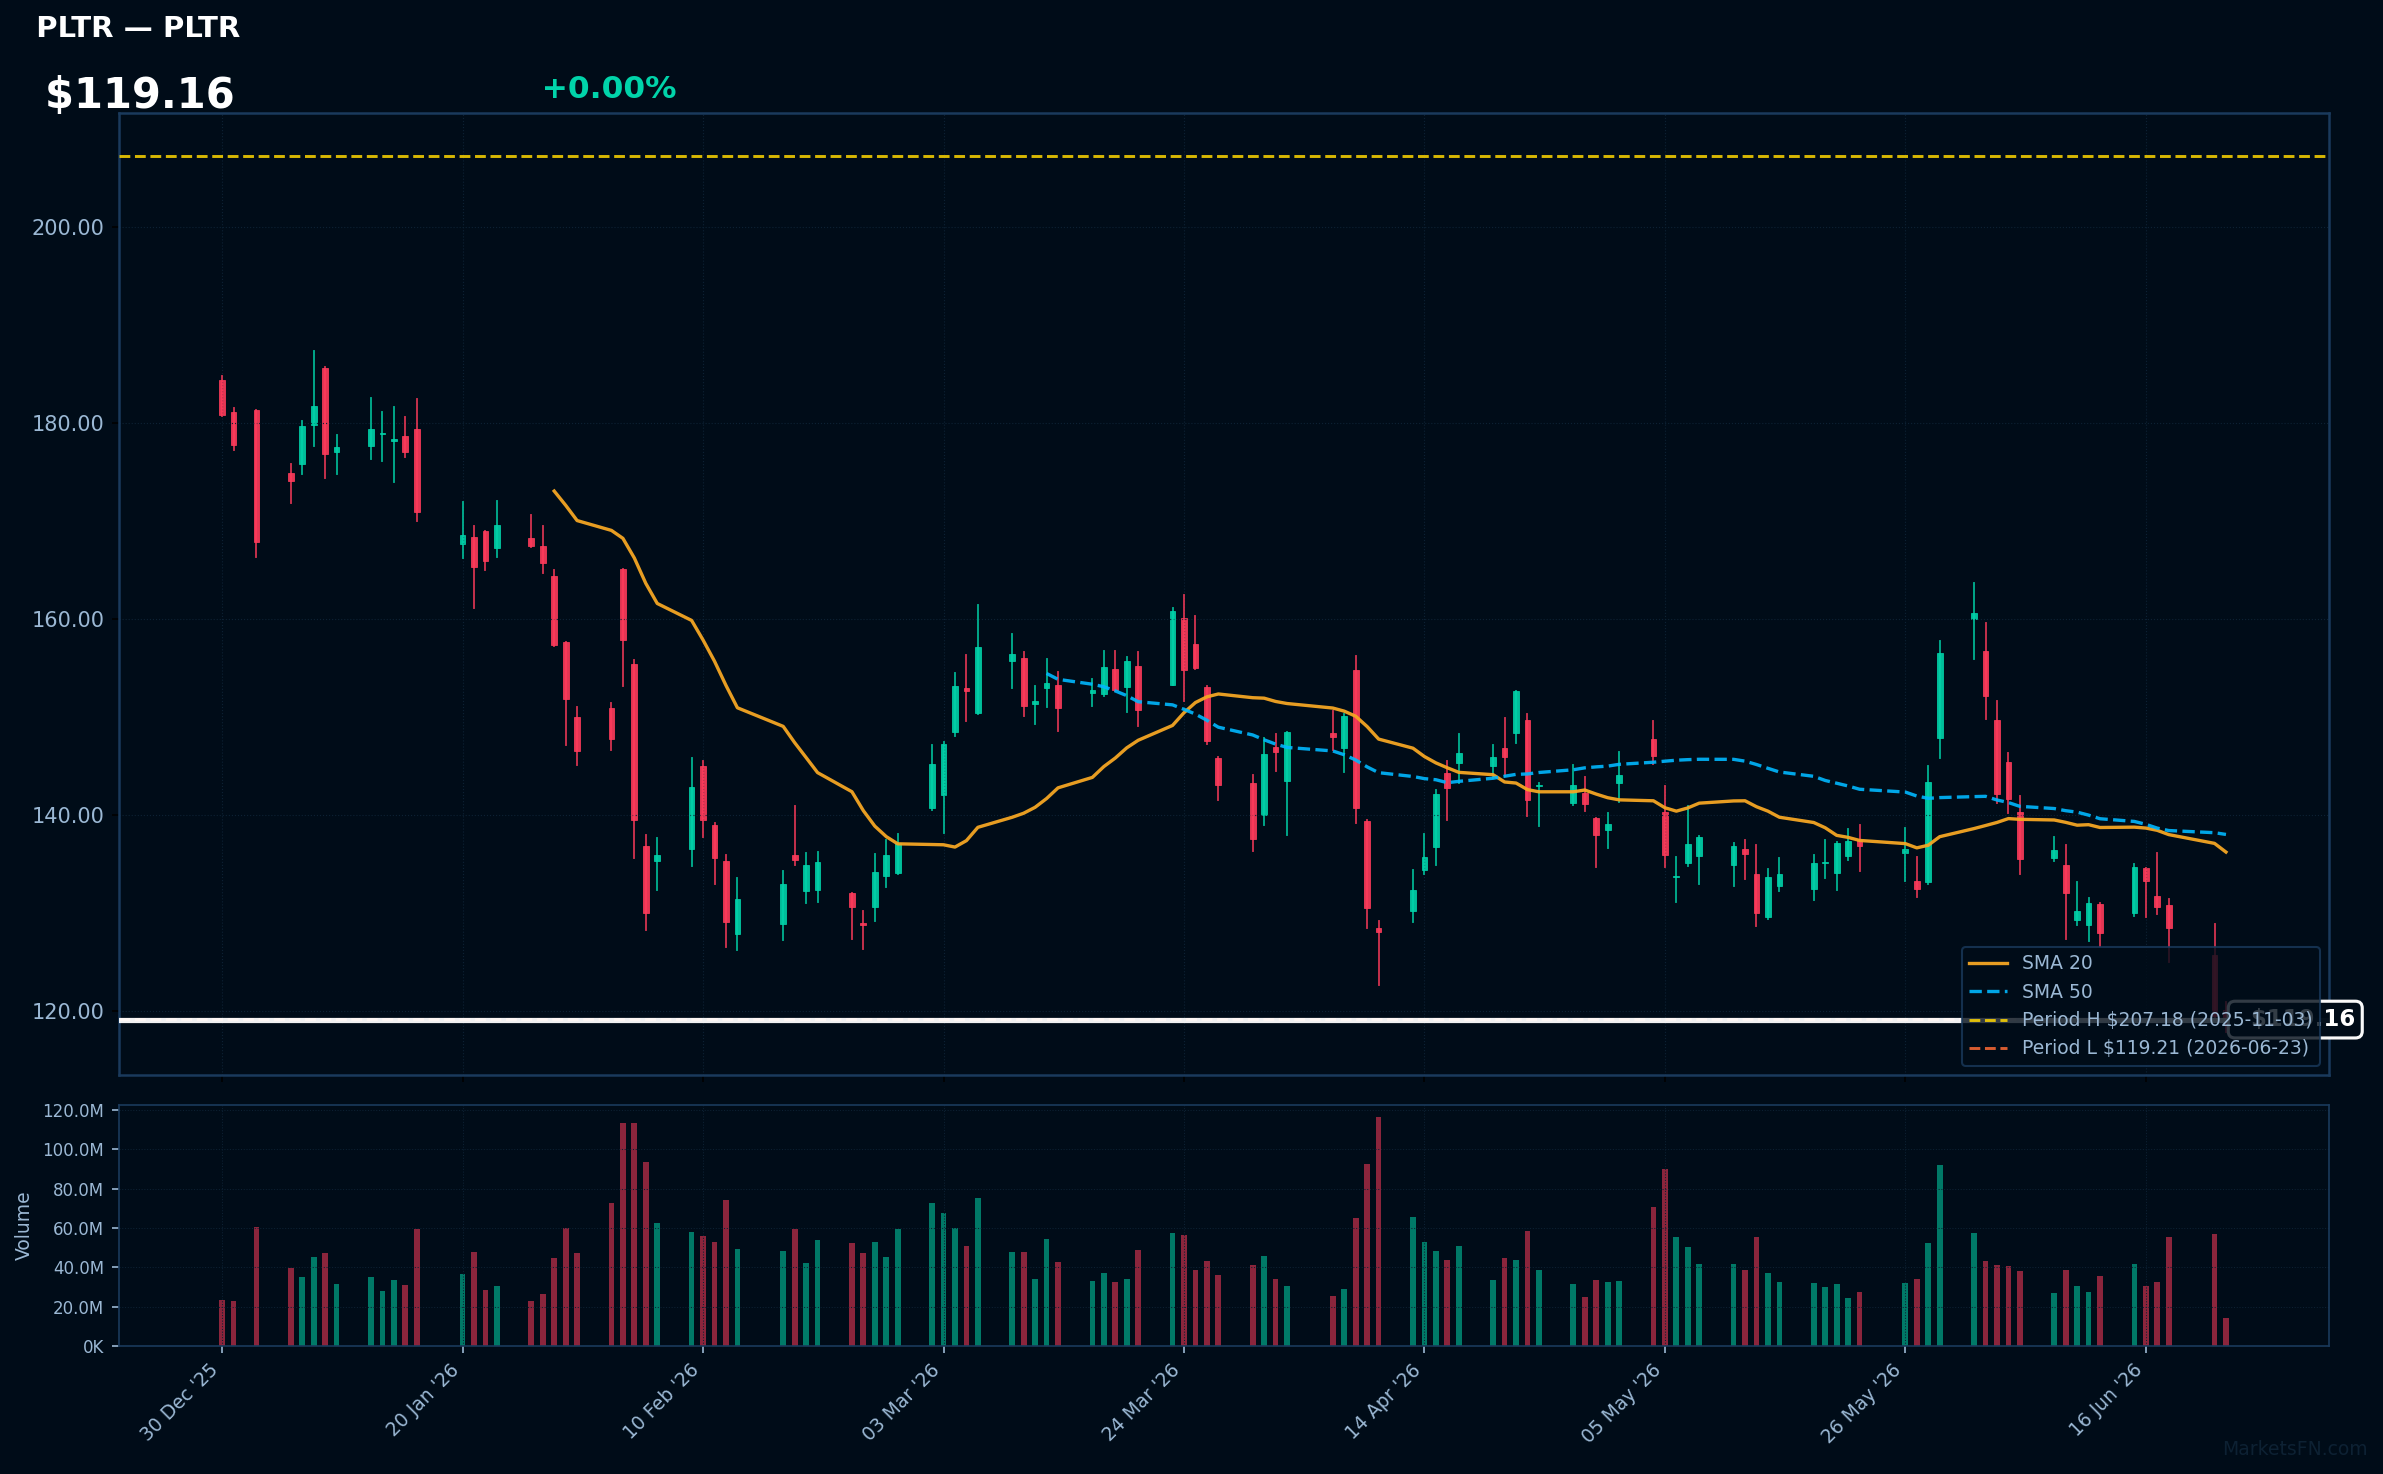
PLTR | Palantir Technologies Inc | Technology | Price Last: $119.21 | % Realized: -14.80% | RSI: 34.3 | % above MA200: -25.3% | Trend: Below MA20, MA50, MA200
Palantir Technologies Inc provides data integration and analytics software to government agencies and commercial organizations, enabling them to make data-driven decisions. Investors should care about its ability to expand its customer base and increase revenue.
PLTR's technical situation is bearish, with RSI(14) at 34.3, indicating oversold conditions, and a sustained downtrend (price < MA20 < MA50 < MA200). The stock is testing major support at its 52-Week low, having returned -14.8% over the 52-Week period.
Related headlines
- Why ZETA Stock Is Climbing Today: A Look Inside Its New Palantir-Powered AI Bet
- Zeta Global Gains After Partnering With Palantir to Build AI-Powered Marketing Platform (ZETA)
- PLTR, CRM Stocks Can't Stop Sliding While Chip Stocks Shine: Wall Street Isn't Writing Them Off Yet
- Nasdaq, S&P 500 Futures Dip After Megacap Tech Selloff: Why SPCX, INFQ, PLTR, QBTS, HIMS Are In Focus
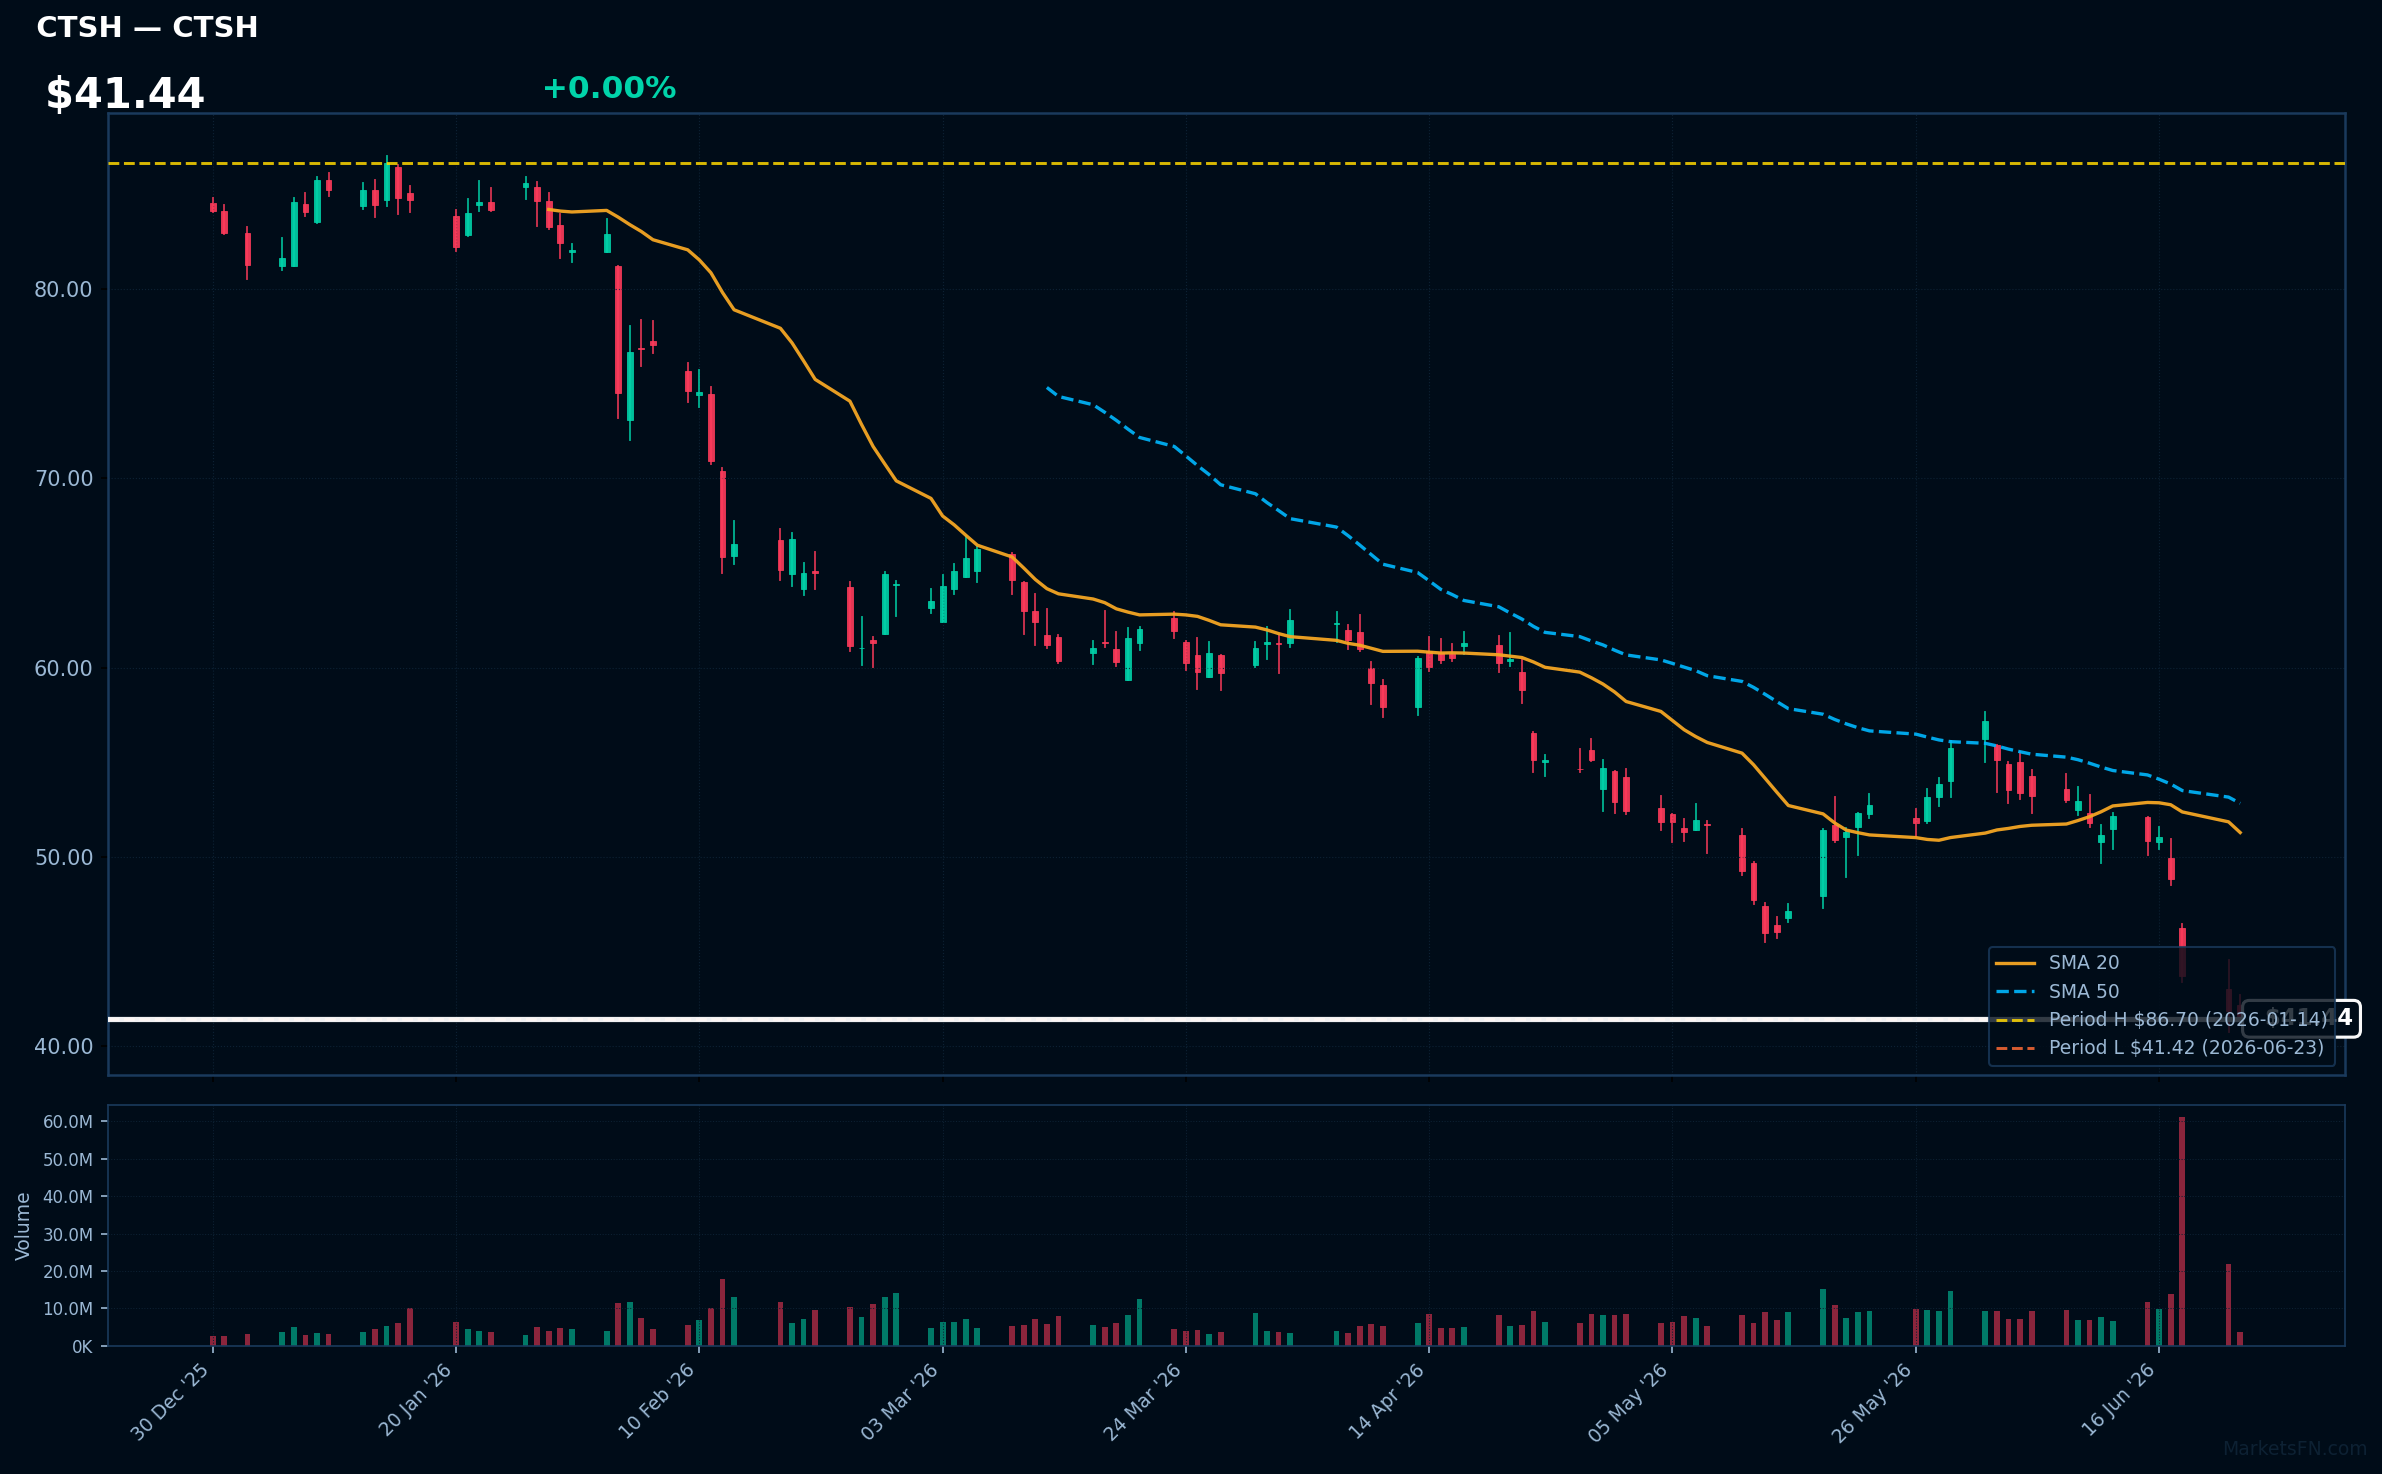
CTSH | Cognizant Technology Solutions Corp | Technology | Price Last: $41.42 | % Realized: -46.02% | RSI: 22.6 | % above MA200: -38.5% | Trend: Below MA20, MA50, MA200
Cognizant Technology Solutions Corp is an IT services company providing digital transformation, consulting, and technology services. Investors should care about its ability to adapt to changing tech landscapes and client needs, impacting revenue growth and profitability.
Cognizant's technical situation is bearish, with RSI(14) at 22.6, indicating oversold conditions. The MA alignment (price < MA20 < MA50 < MA200) confirms a sustained downtrend. The stock is at its 52-Week low, down 46.0% over the period, signaling a potential warning sign.
Related headlines
- Cognizant Technology Solutions Corp. stock underperforms Thursday when compared to competitors
- Cognizant expands cross-platform agentic AI with new ServiceNow AI Agent interoperability
- Entry-Level Work Remains Essential: 94% of HR Leaders Expect AI to Create New Entry-Level Roles, Cognizant and Pearson Study Reveals
- Berenberg downgrades Cognizant as AI risks cloud IT services outlook
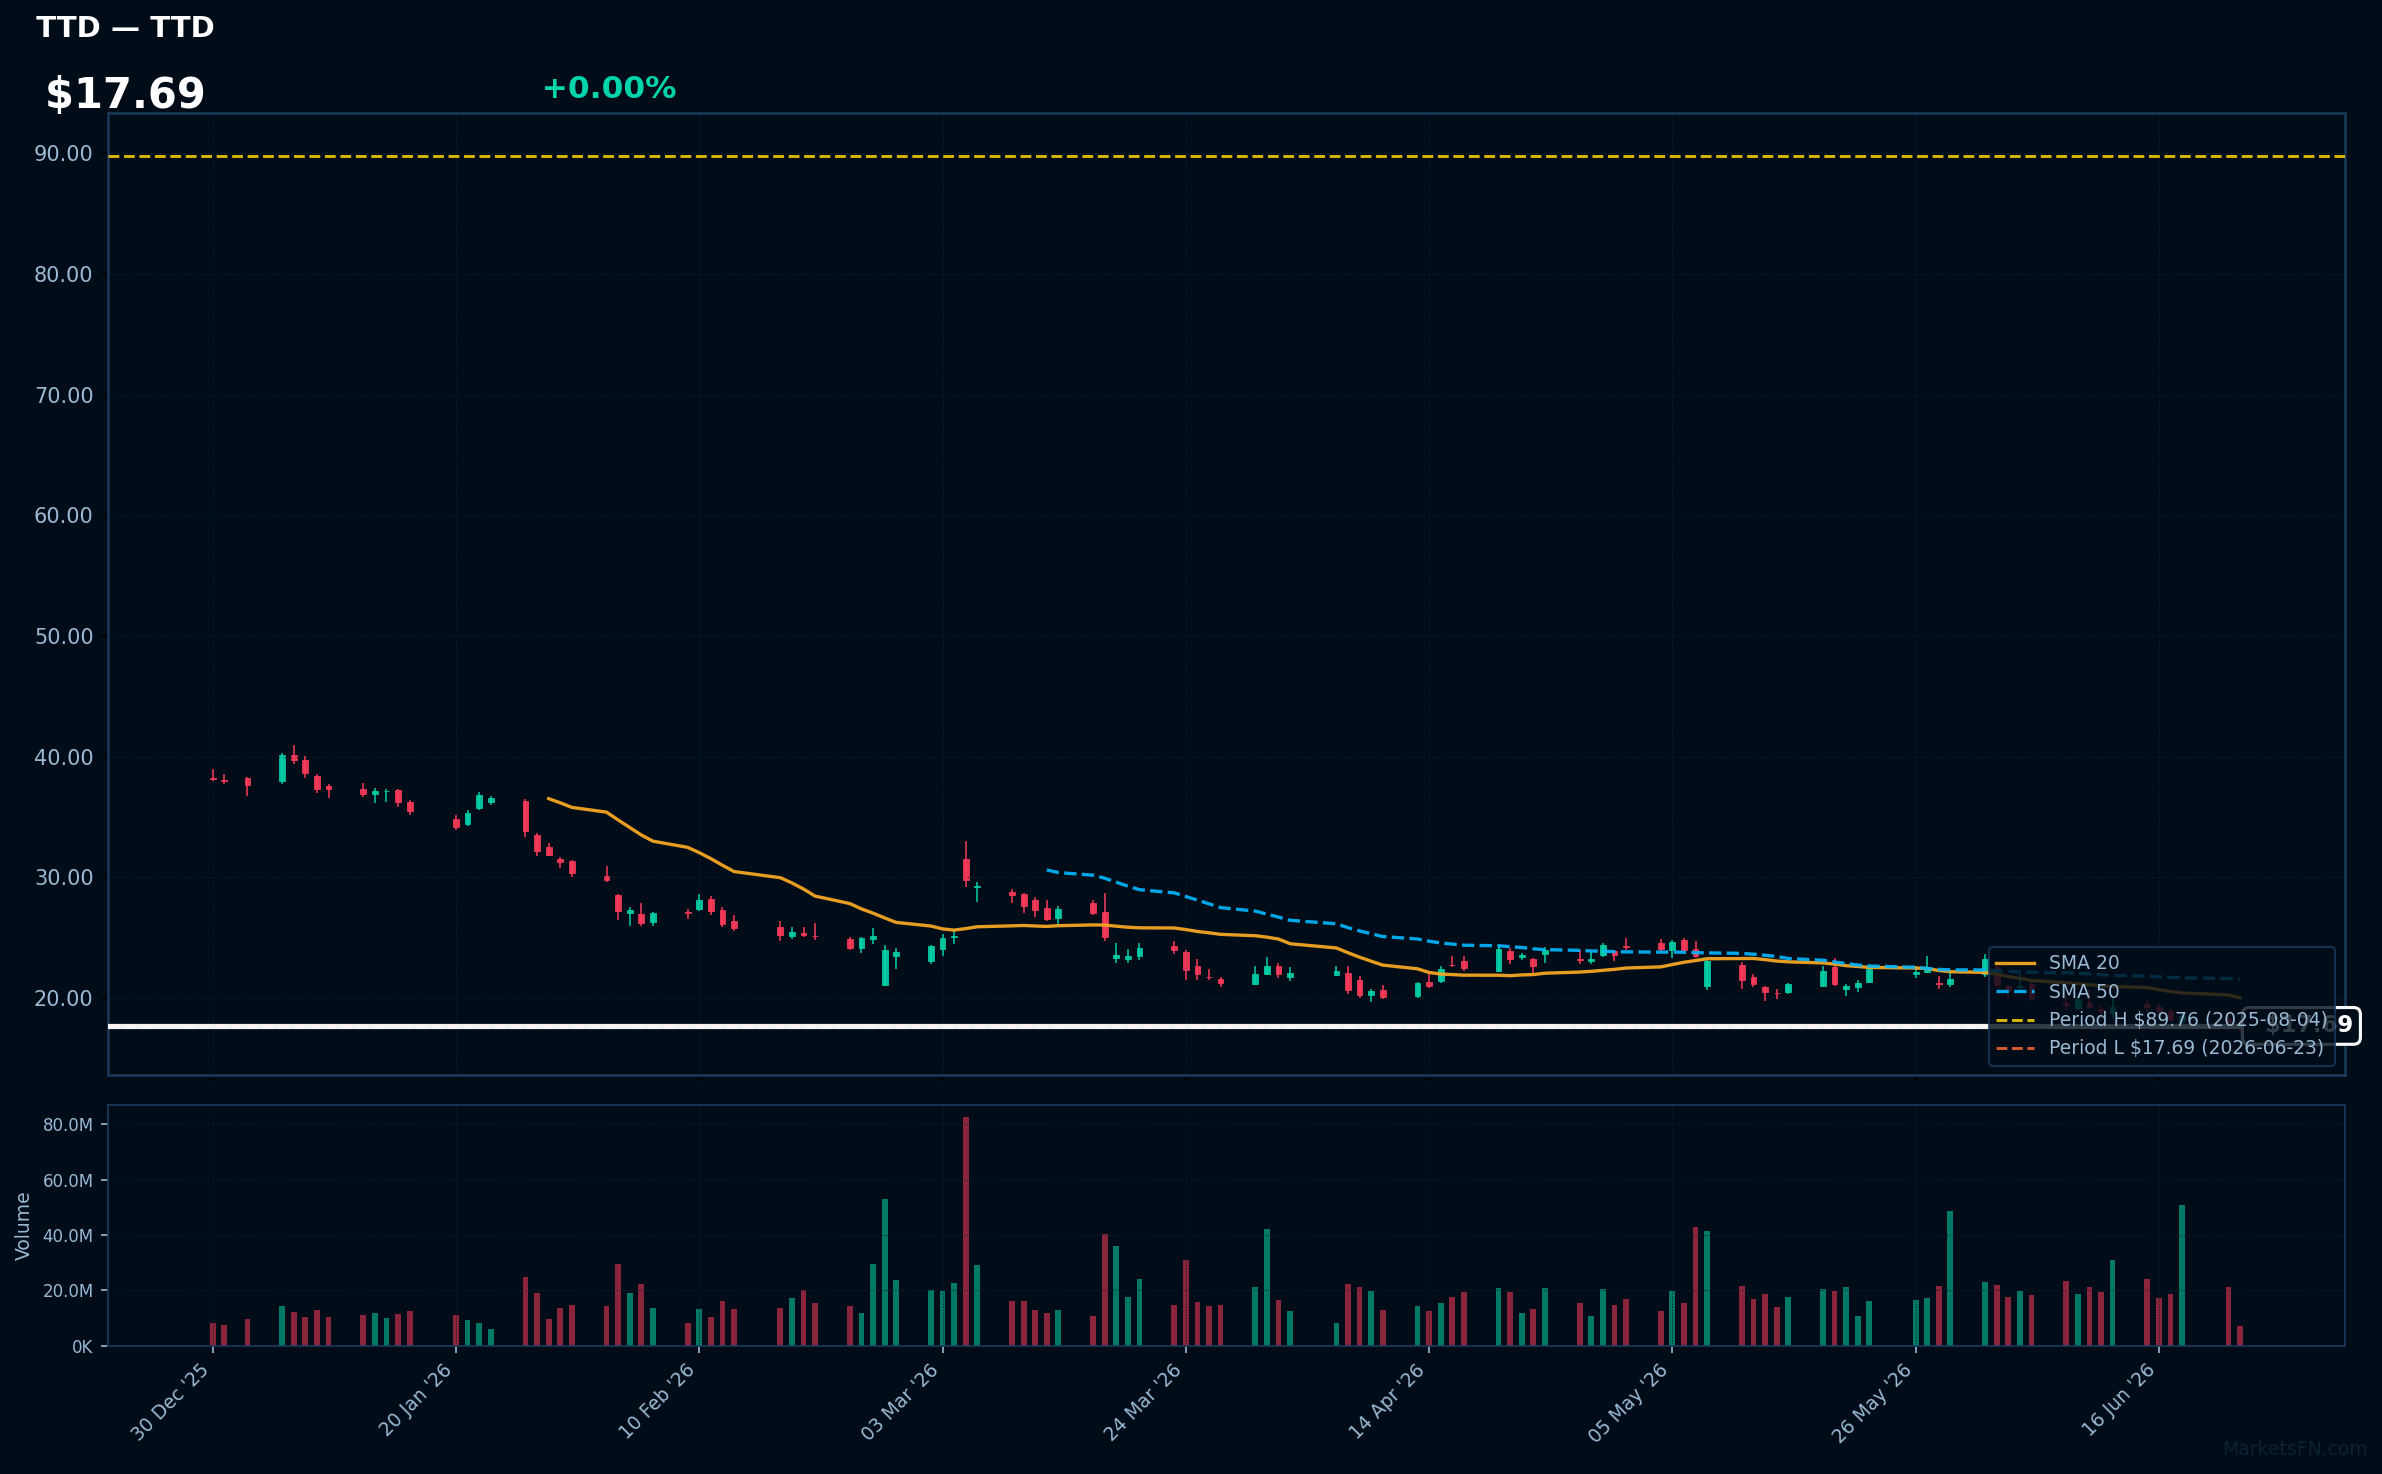
TTD | Trade Desk Inc | Communication Services | Price Last: $17.69 | % Realized: -74.31% | RSI: 34.0 | % above MA200: -47.0% | Trend: Below MA20, MA50, MA200
The Trade Desk Inc operates a demand-side platform enabling advertisers to manage digital ad campaigns across various channels and devices. Investors should care as it reflects the growth of digital advertising and the company's competitive positioning.
The stock is in a sustained downtrend with price ($17.69) below MA20, MA50, and MA200. RSI(14) is 34.0, near oversold territory, and the stock is 0.0% above its 52-Week low, indicating a potential support test.
Related headlines
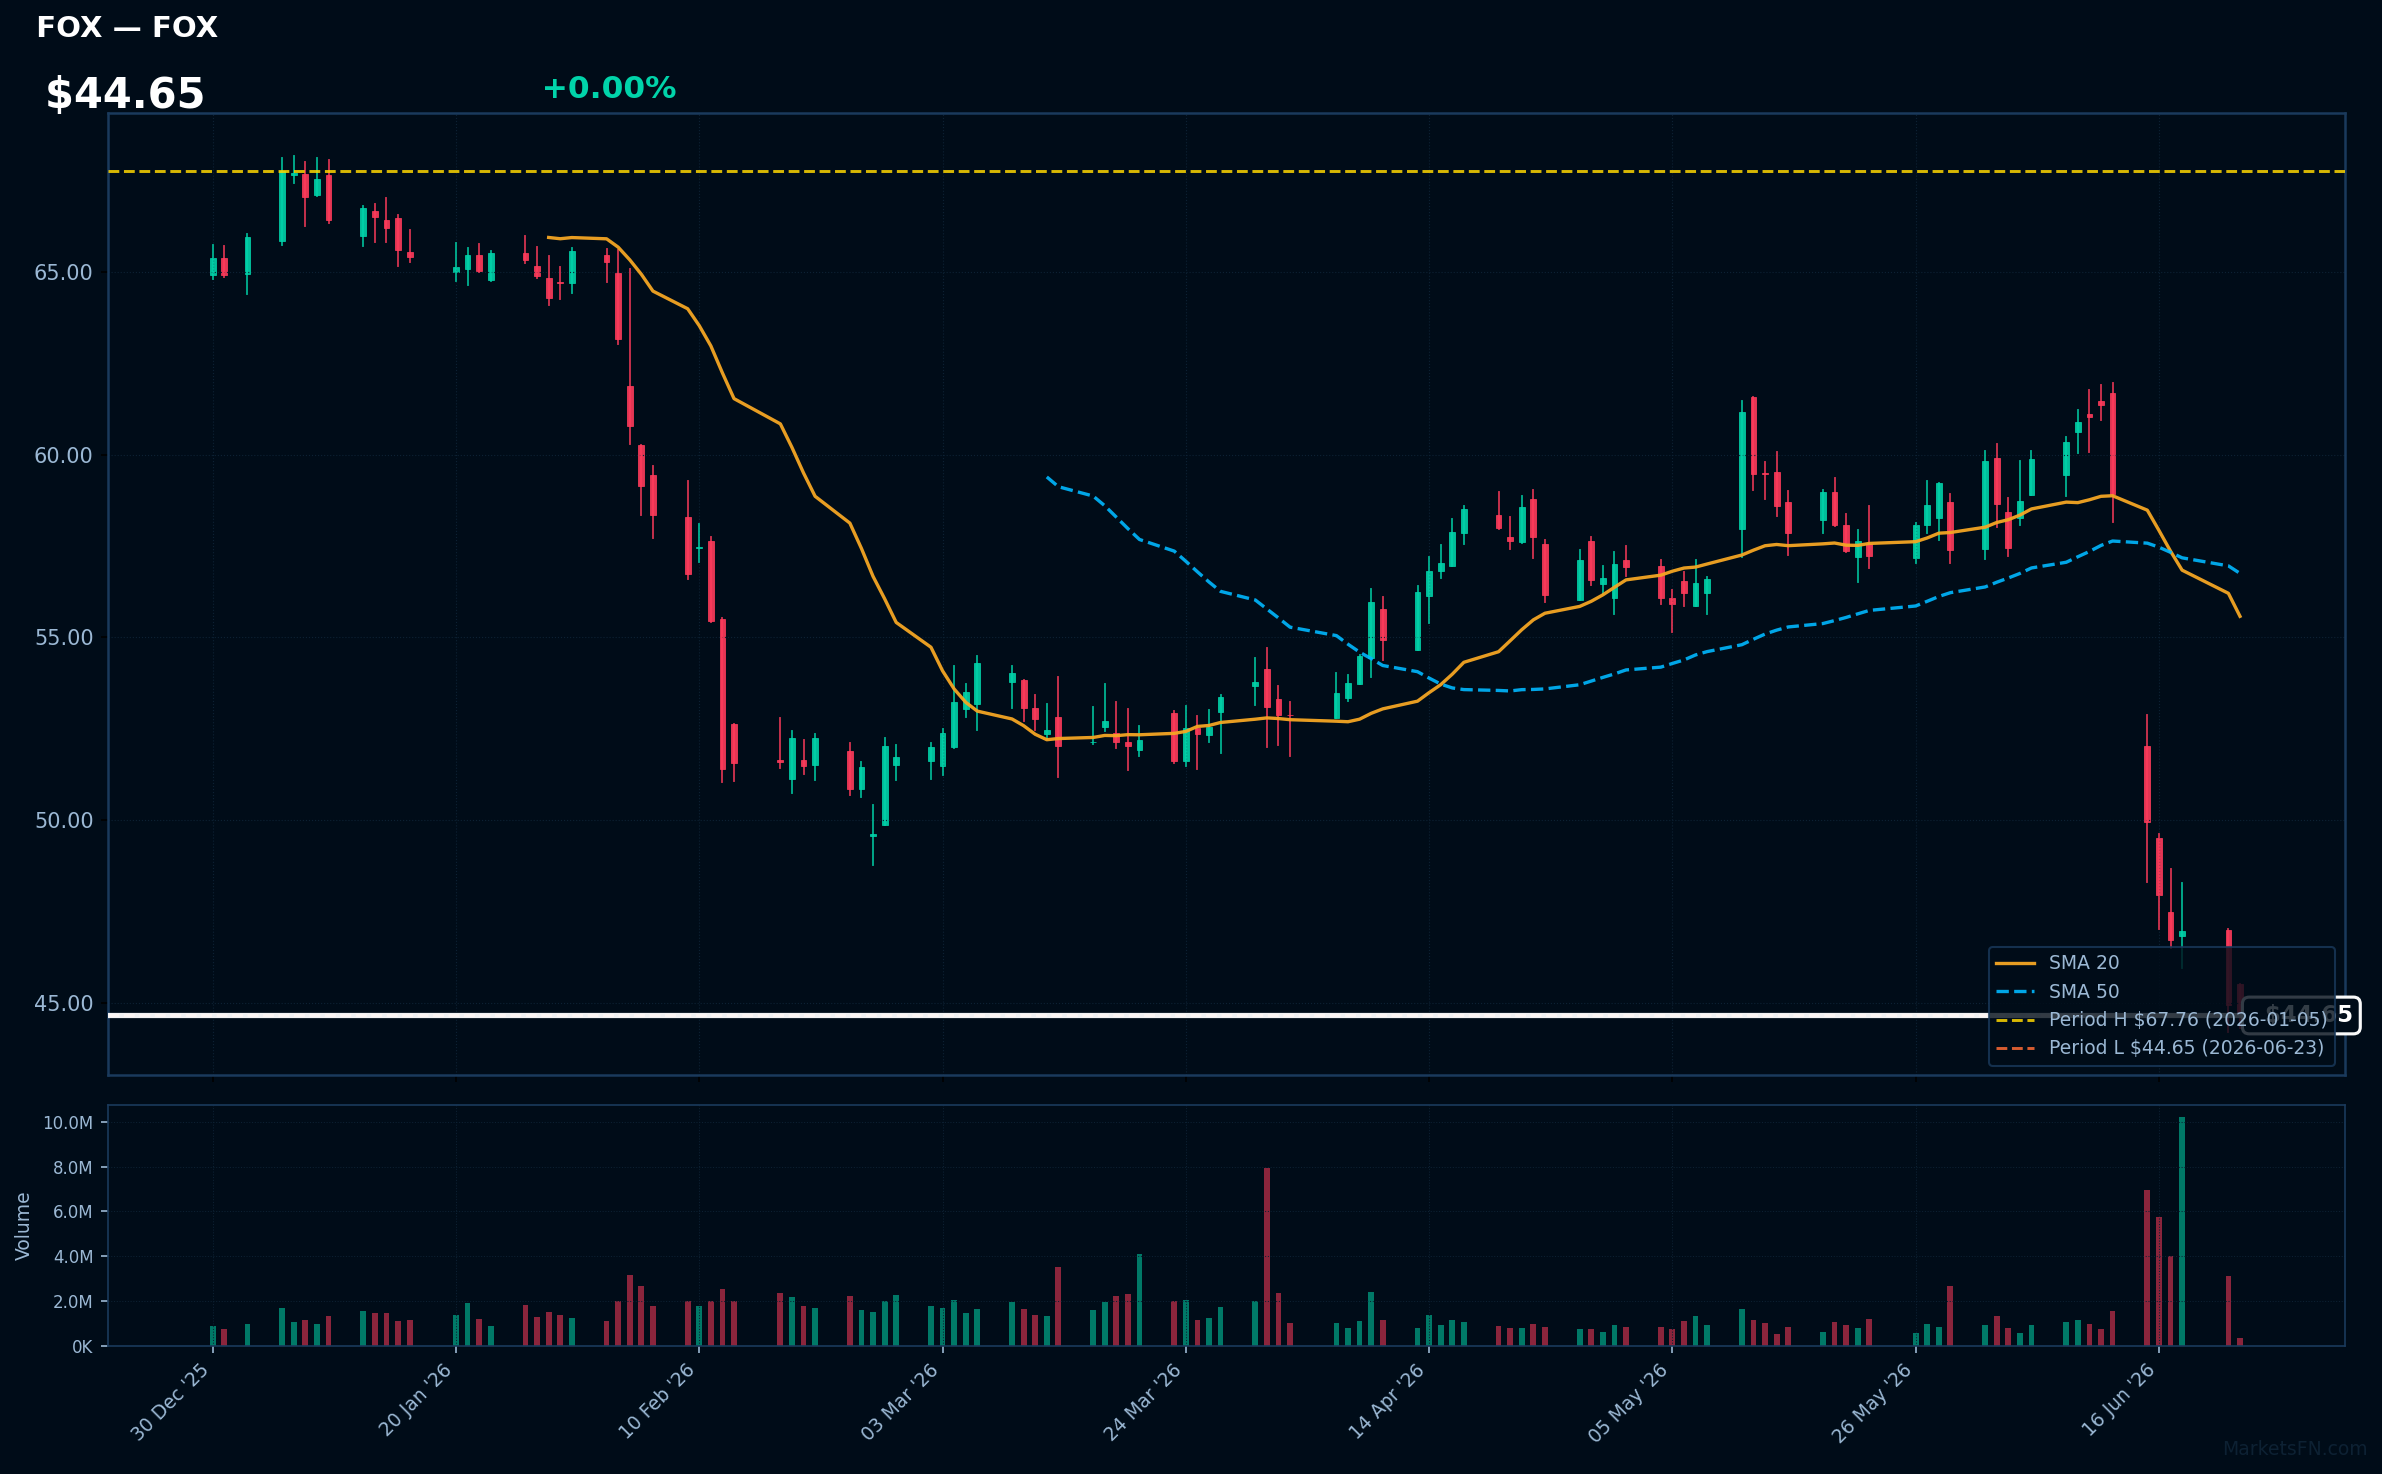
FOX | Fox Corporation | Communication Services | Price Last: $44.65 | % Realized: -13.13% | RSI: 23.2 | % above MA200: -22.0% | Trend: Below MA20, MA50, MA200
Fox Corporation is a media conglomerate with significant holdings in television broadcasting, news, and entertainment. Investors should care due to its influence on the media landscape and potential for advertising revenue growth.
Fox Corporation's technical situation is bearish, with an RSI(14) of 23.2 indicating oversold conditions, and a sustained downtrend as price ($44.65) remains below MA20, MA50, and MA200, testing major support at its 52-Week low.
Related headlines
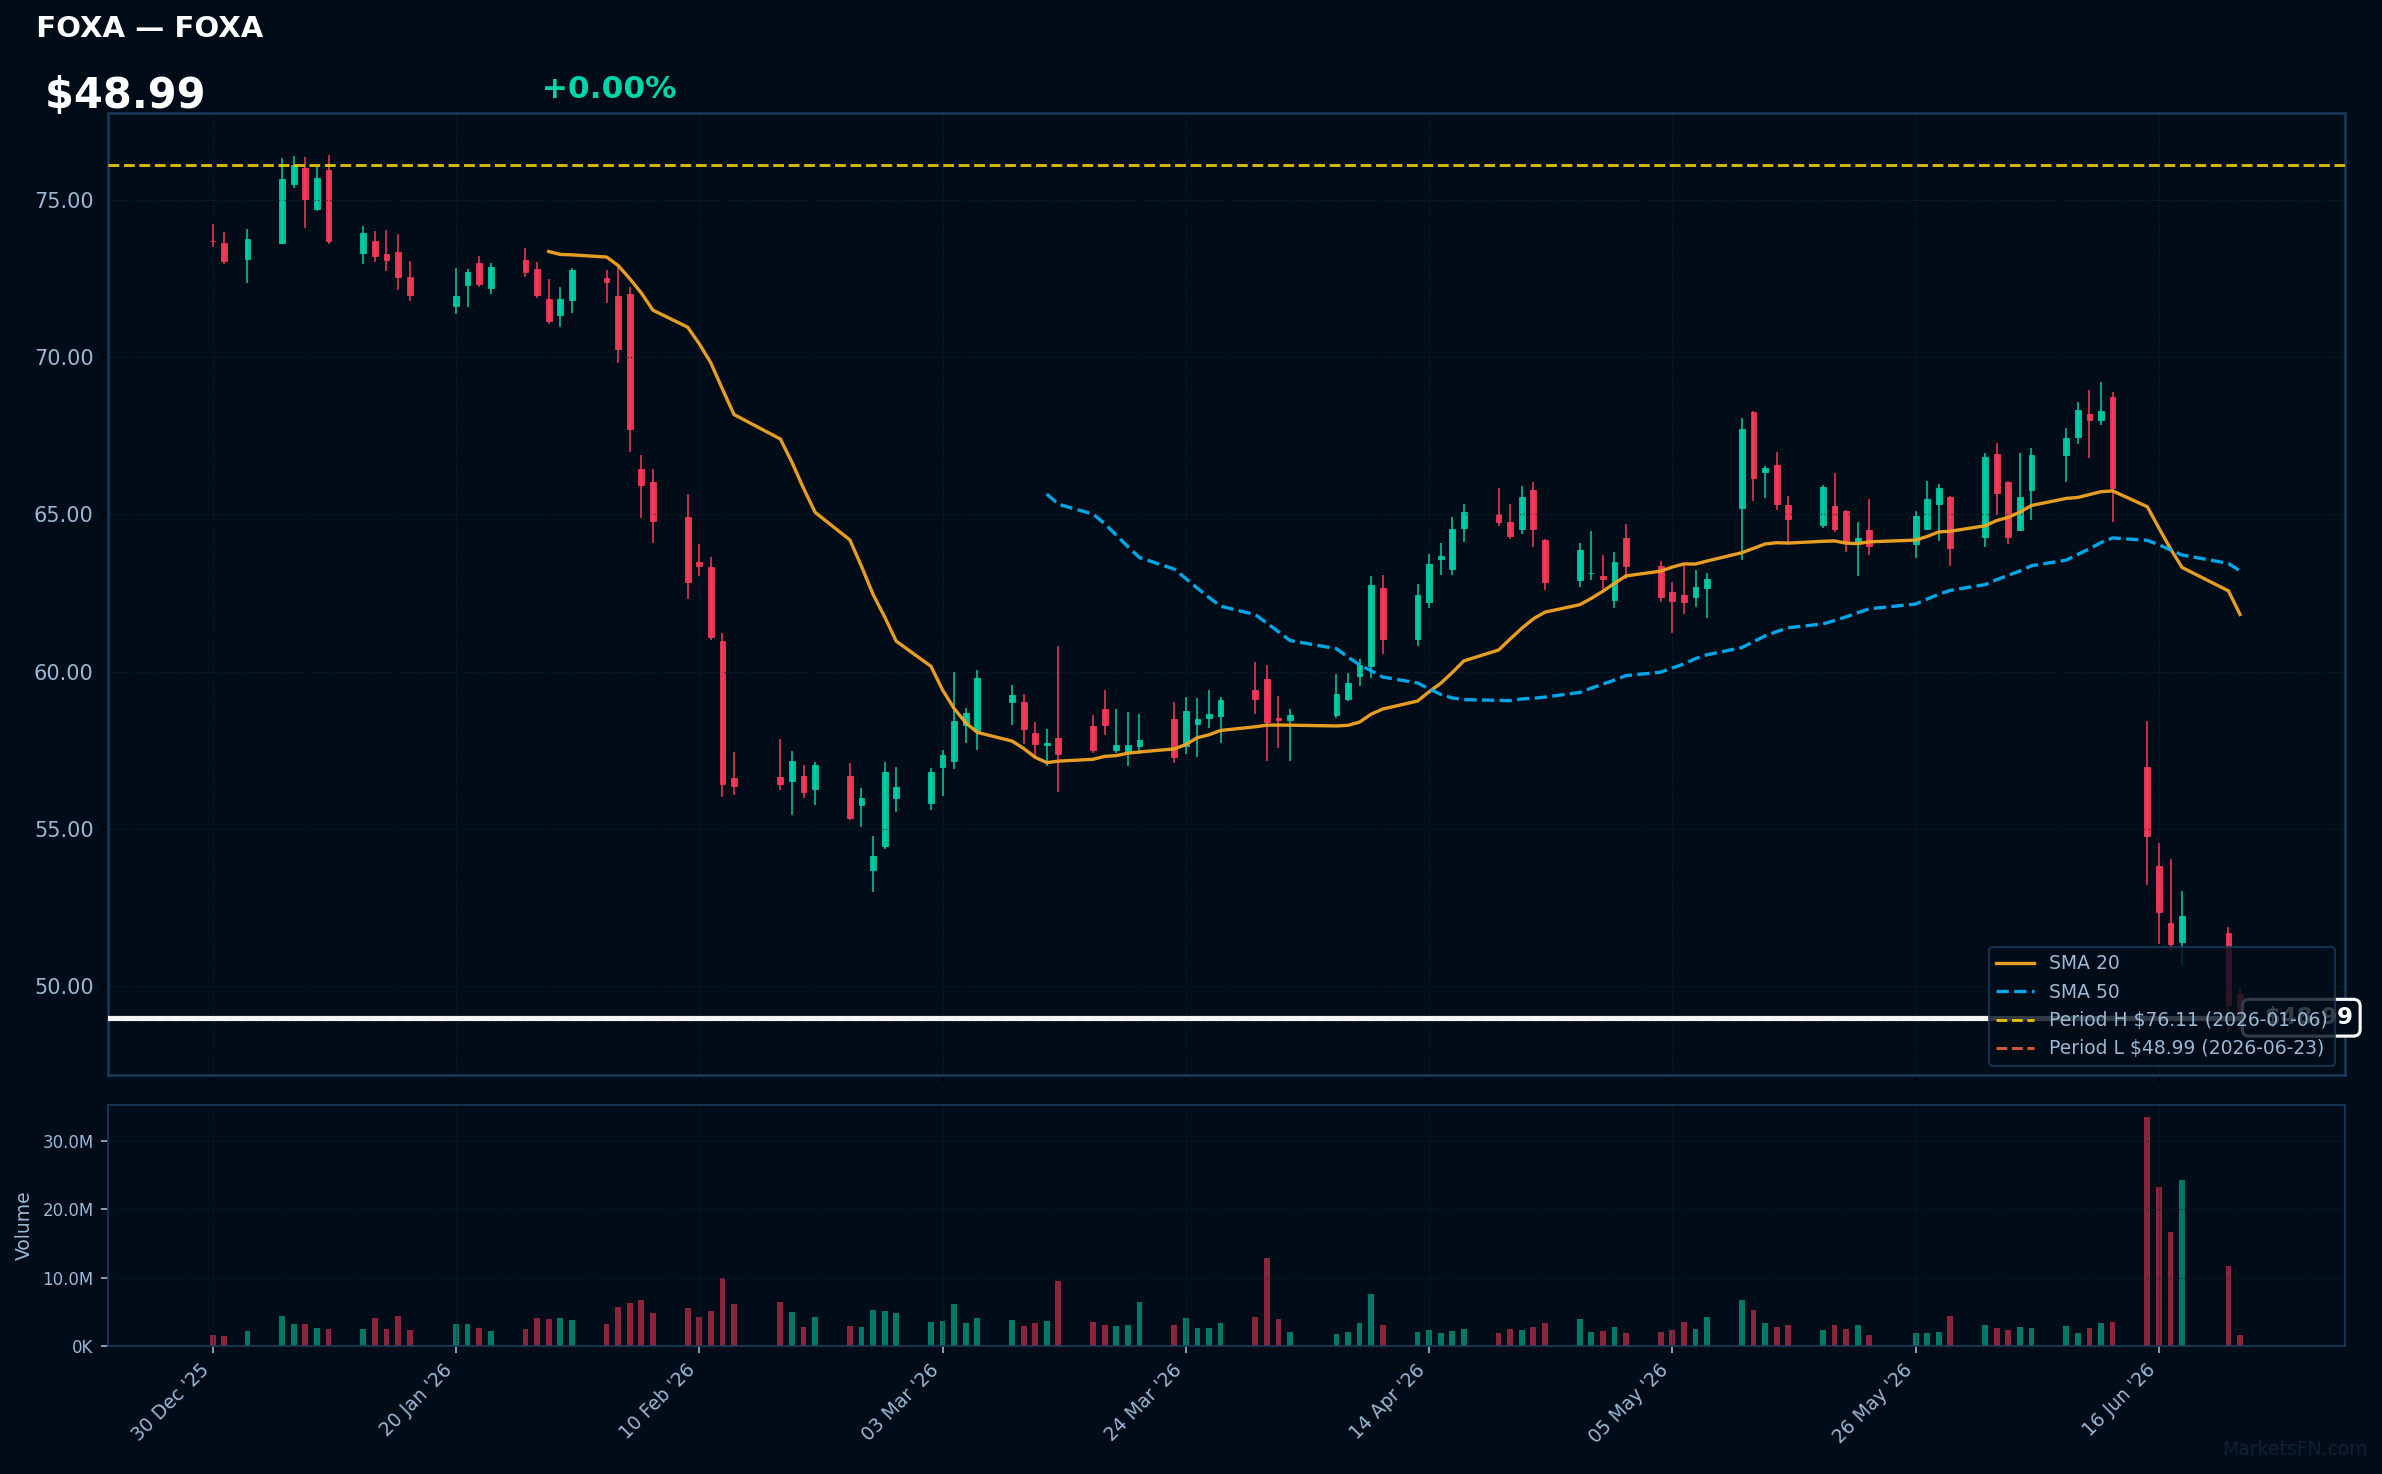
FOXA | Fox Corporation | Communication Services | Price Last: $48.99 | % Realized: -12.64% | RSI: 23.6 | % above MA200: -23.1% | Trend: Below MA20, MA50, MA200
Fox Corporation is a media conglomerate with significant broadcasting and entertainment assets. Investors should care about its advertising revenue, affiliate fees, and content production, which drive its financial performance and influence its stock price.
Fox Corporation's technical situation is bearish, with an RSI(14) of 23.6 indicating oversold conditions, and a sustained downtrend as price ($48.99) remains below MA20, MA50, and MA200, with the stock testing its 52-Week low.
Related headlines
- Why Did CRM, INTU, FOXA Stocks Hit 52-Week Lows Last Week?
- Why Did CRM, FOXA, GLND Stocks Fall To 52-Week Lows On Tuesday?
- FOXA Stock Slides As Wall Street Weighs Risks And Rewards Of $22B Roku Deal: Retail Stays Bullish
- Fox Corporation announces $22B acquisition of Roku in landmark streaming and live TV deal
Market Commentary
The S&P 500 stocks listed are currently trading at their 52-week extremes, with some at highs and others at lows. Stocks like BAC, TRV, MNST, ALL, and D are at their 52-week highs, while PLTR, CTSH, TTD, FOX, and FOXA are at their 52-week lows. This indicates a significant price movement, potentially driven by fundamental or macroeconomic factors.
The stocks at 52-week highs are from diverse sectors, including finance (BAC, TRV, ALL), consumer staples (MNST), and utilities (D), suggesting a broad-based market movement. In contrast, the stocks at 52-week lows are primarily from the technology (PLTR, CTSH, TTD) and media (FOX, FOXA) sectors, potentially indicating a sector rotation or a shift in investor sentiment towards or away from these areas.
Key levels to watch include the current prices of these stocks, as a break above or below their 52-week extremes could signal further price movements. Potential catalysts for these stocks include earnings reports, macroeconomic data releases, and industry-specific news, which could influence their prices and overall market direction.
Methodology: All 503 S&P 500 constituents screened. 52-week high = highest daily close over the past 252 trading days (approx. 1 year). 52-week low = lowest daily close over the same period. Distance = (current price / extreme − 1) × 100. Technical indicators computed on up to 1 year of daily OHLCV data.
Disclaimer: For informational purposes only. Not investment advice. Past performance is not indicative of future results.