S&P 500 52-Week Highs & Lows Radar: Broadcom (AVGO), Mastercardorporated (MA) and more
· Stocks · MarketsFN Team
S&P 500 52-Week Highs & Lows Radar: Broadcom (AVGO), Mastercardorporated (MA) and more
Screening all 503 S&P 500 constituents for stocks nearest to their 52-week high and their 52-week low. Data as of June 02, 2026. % Realized = 52-week total return.
Legend: RSI > 70 = overbought · RSI < 30 = oversold · Green % Realized = positive 52W return · Red = negative.
📈 Nearest to 52-Week High
Sectors represented: Technology (3), Financial (2)
| Ticker | Company | Sector | Price Last | % Realized | 52-Week High Date | RSI | % above MA200 | Trend |
|---|---|---|---|---|---|---|---|---|
| AVGO | Broadcom Inc | Technology | $483.27 | +94.31% | 2026-06-02 | 75.1 | +36.5% | Above MA20, MA50, MA200 |
| CSCO | Cisco Systems, Inc | Technology | $127.21 | +99.23% | 2026-06-02 | 80.7 | +60.2% | Above MA20, MA50, MA200 |
| MS | Morgan Stanley | Financial | $216.05 | +68.26% | 2026-06-02 | 79.9 | +26.0% | Above MA20, MA50, MA200 |
| IBM | International Business Machines Corp | Technology | $322.52 | +22.21% | 2026-06-02 | 84.1 | +18.9% | Above MA20, MA50, MA200 |
| GS | Goldman Sachs Group, Inc | Financial | $1069.72 | +78.67% | 2026-06-02 | 77.5 | +24.8% | Above MA20, MA50, MA200 |
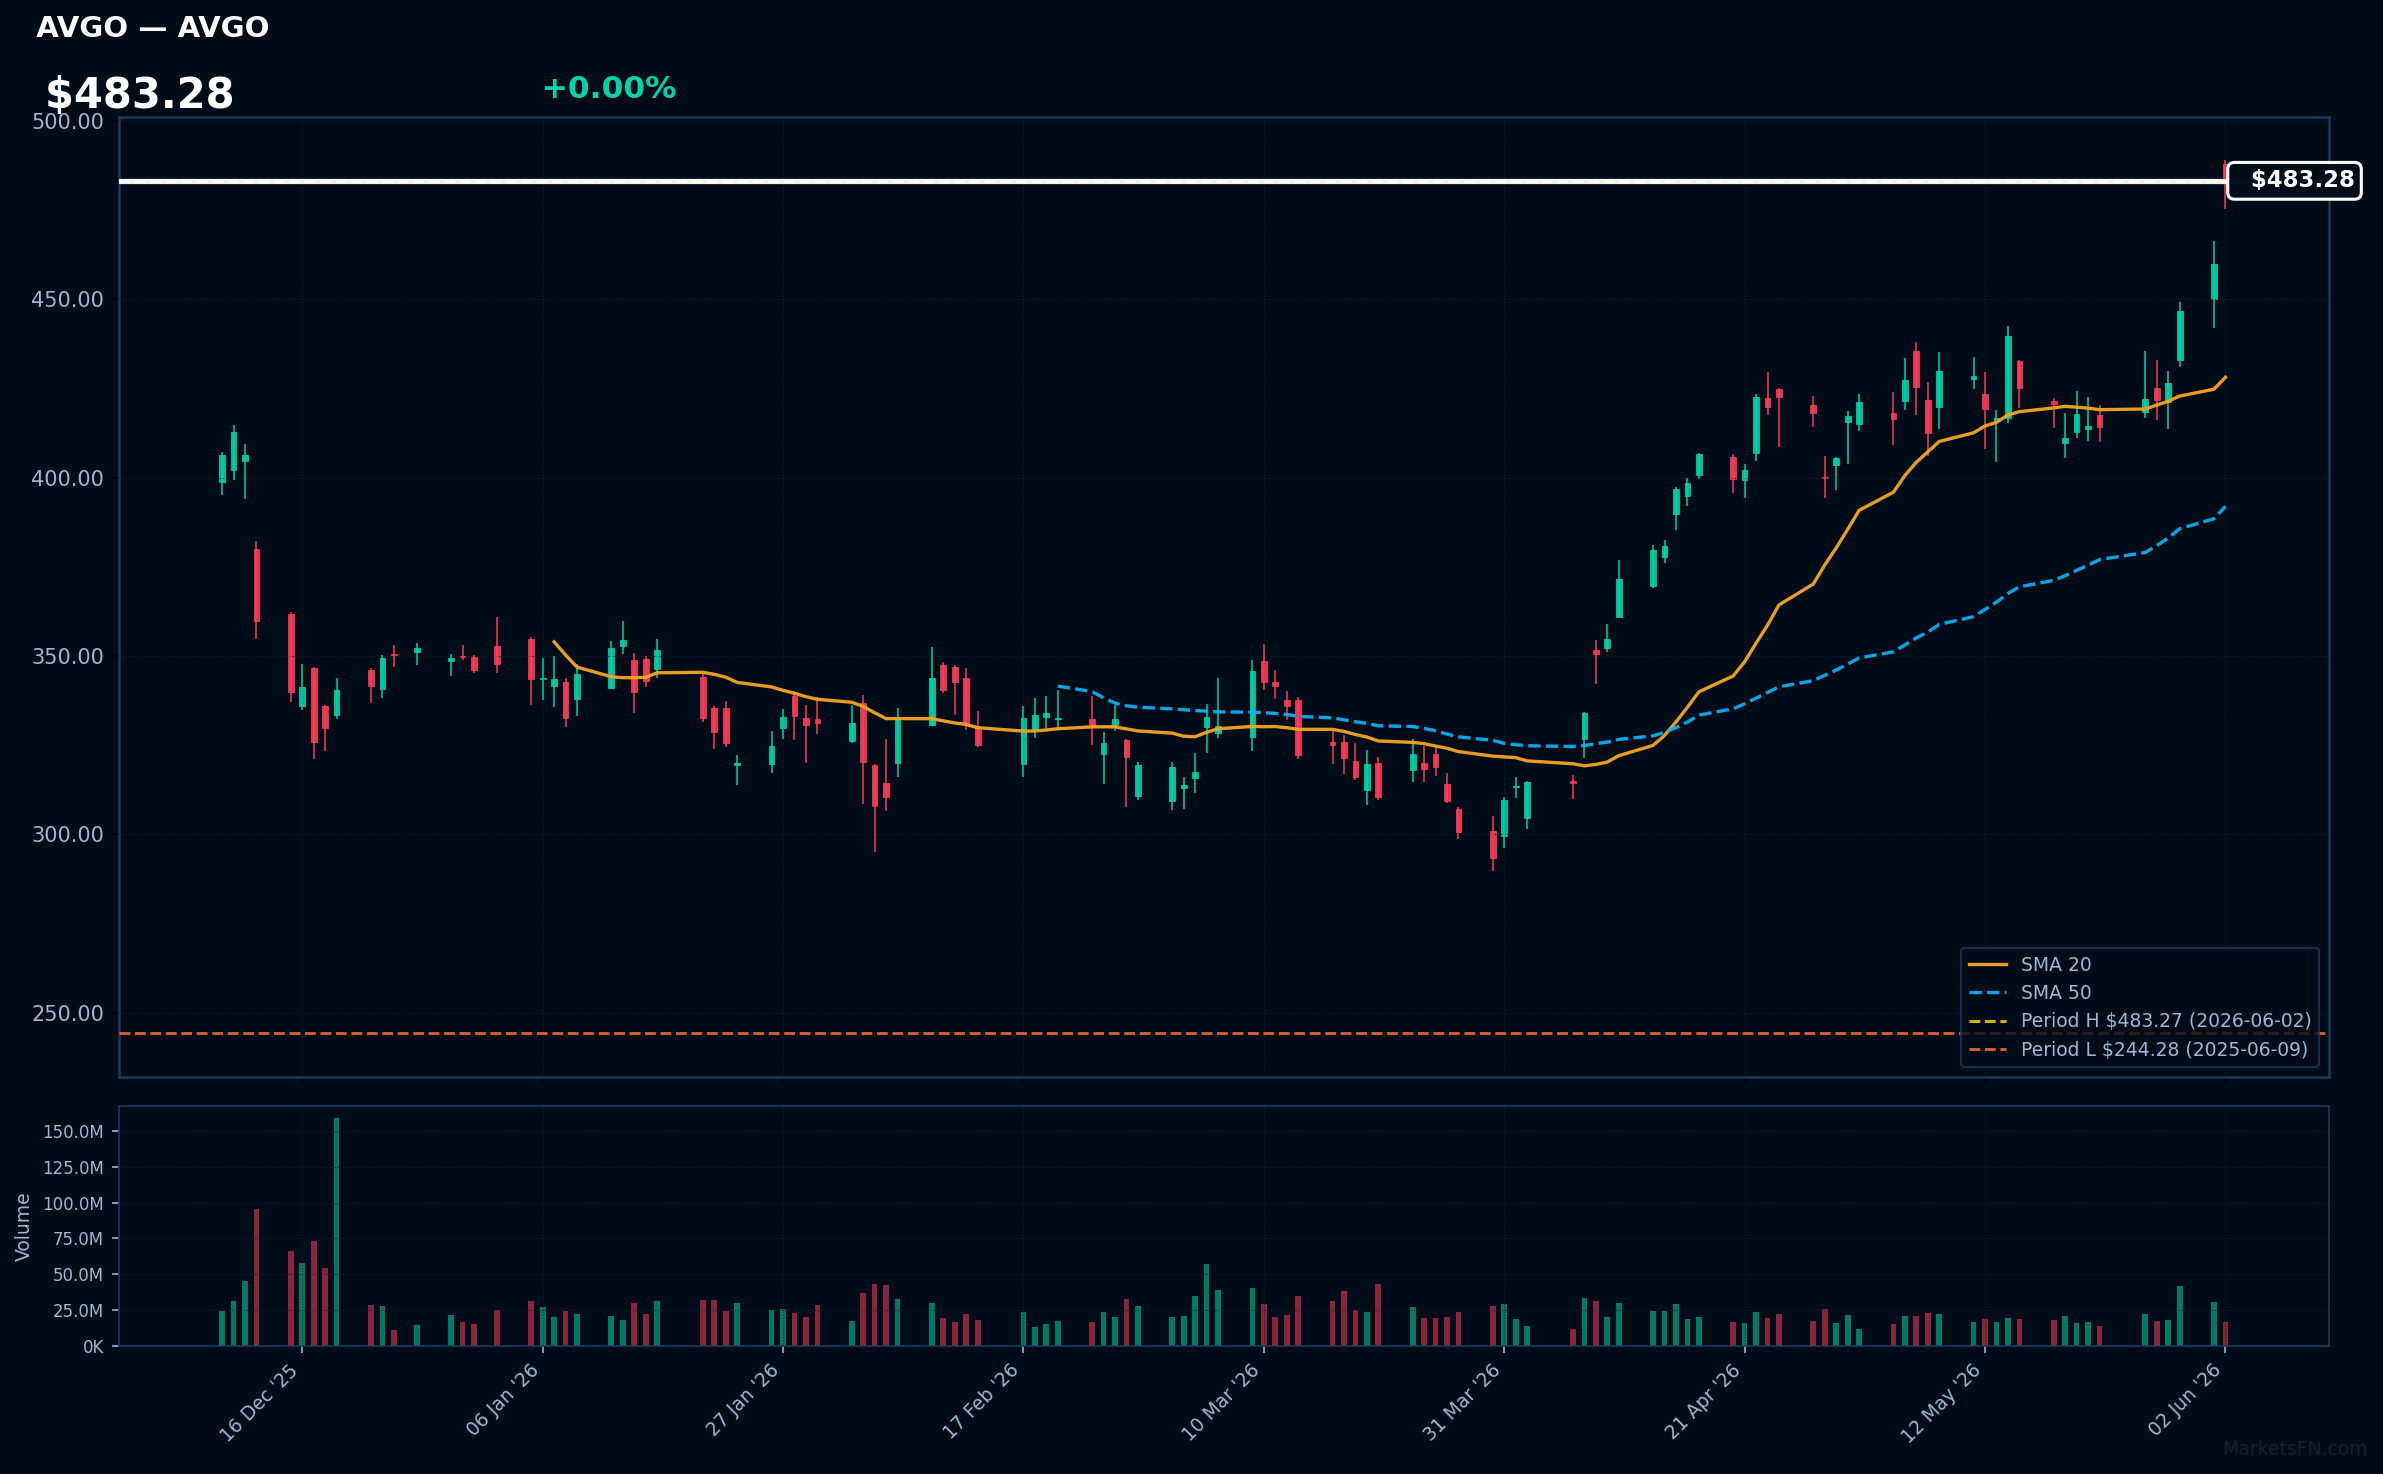
AVGO | Broadcom Inc | Technology | Price Last: $483.27 | % Realized: +94.31% | RSI: 75.1 | % above MA200: +36.5% | Trend: Above MA20, MA50, MA200
Broadcom Inc (AVGO) is a semiconductor and infrastructure software company. Investors should care because its semiconductor solutions enable data center, networking, and storage applications, while its software segment provides critical infrastructure management solutions, driving growth in high-demand tech sectors.
AVGO's RSI(14) is 75.1, indicating strong momentum with price > MA20 > MA50 > MA200, a bullish alignment. The stock is 0.0% below its 52-Week high, nearing a potential breakout, with a 94.3% 52-Week return, reinforcing its uptrend.
Related headlines
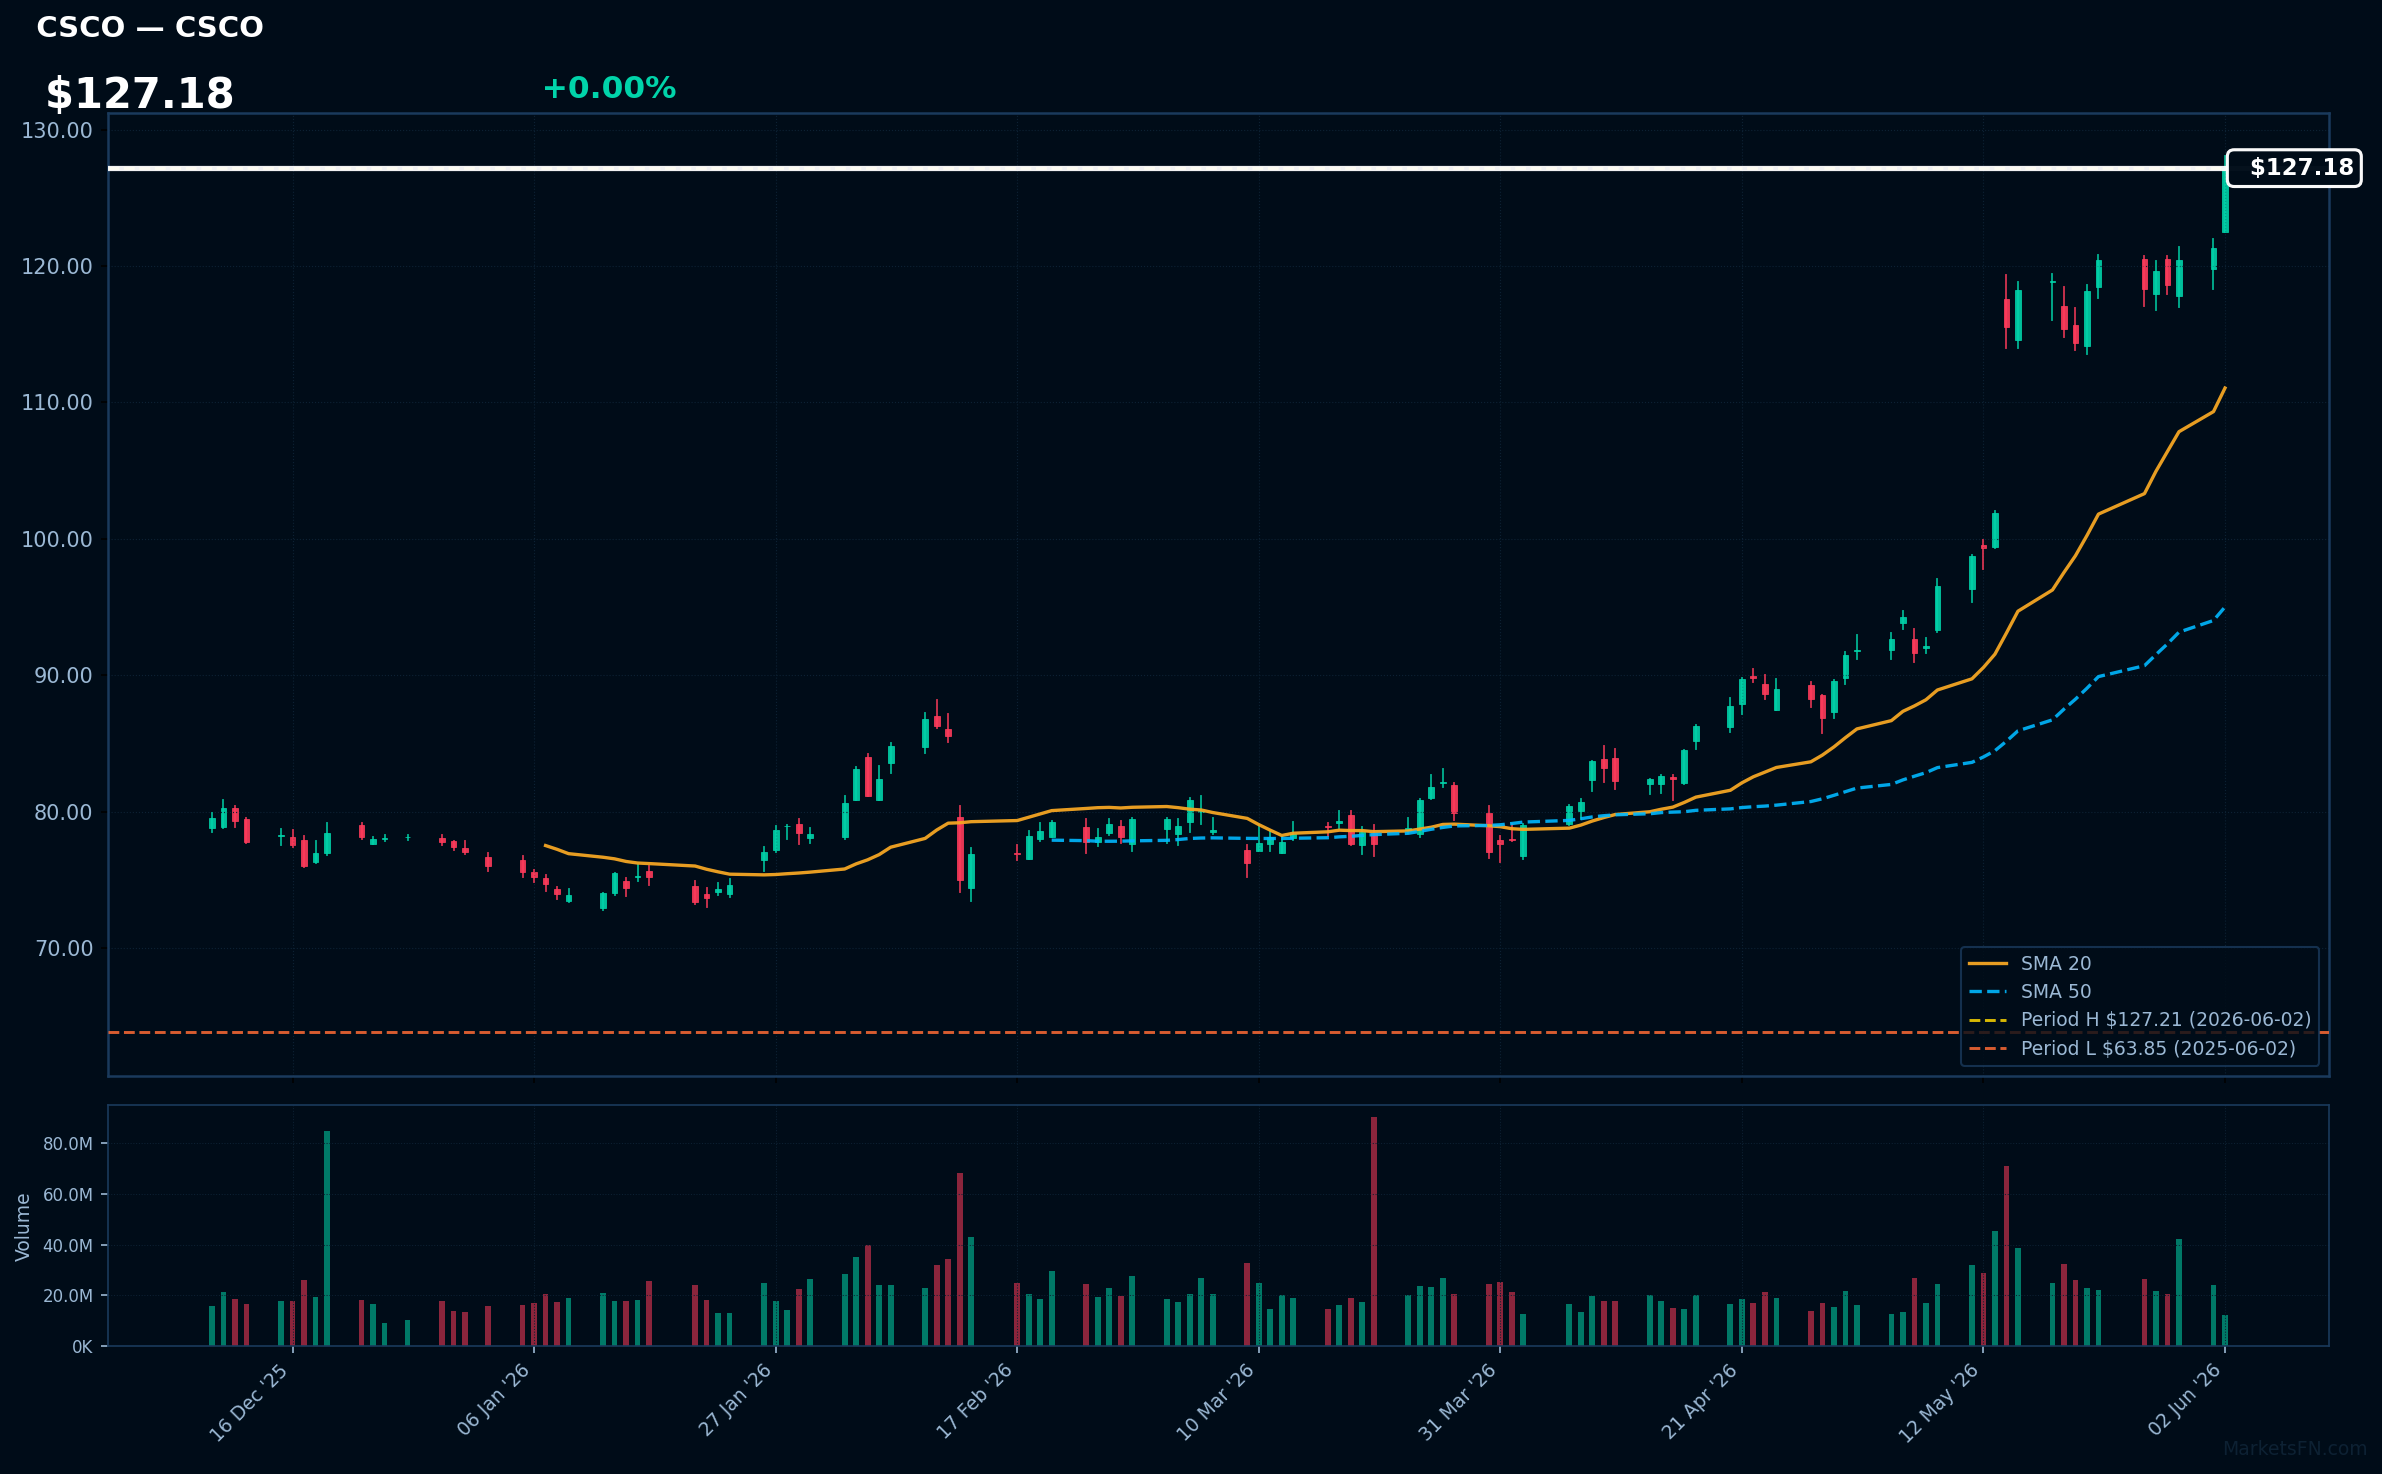
CSCO | Cisco Systems, Inc | Technology | Price Last: $127.21 | % Realized: +99.23% | RSI: 80.7 | % above MA200: +60.2% | Trend: Above MA20, MA50, MA200
Cisco Systems, Inc designs, manufactures, and sells networking hardware, software, and telecommunications equipment. Investors should care because its products are crucial for the infrastructure of the internet and cloud computing, driving demand for its solutions.
Cisco's RSI is 80.7, indicating overbought conditions. The MA alignment is bullish with price > MA20 > MA50 > MA200, suggesting a sustained uptrend. The stock is 0.0% below its 52-Week high, near a potential breakout level, with a 99.2% return over the 52-Week period.
Related headlines
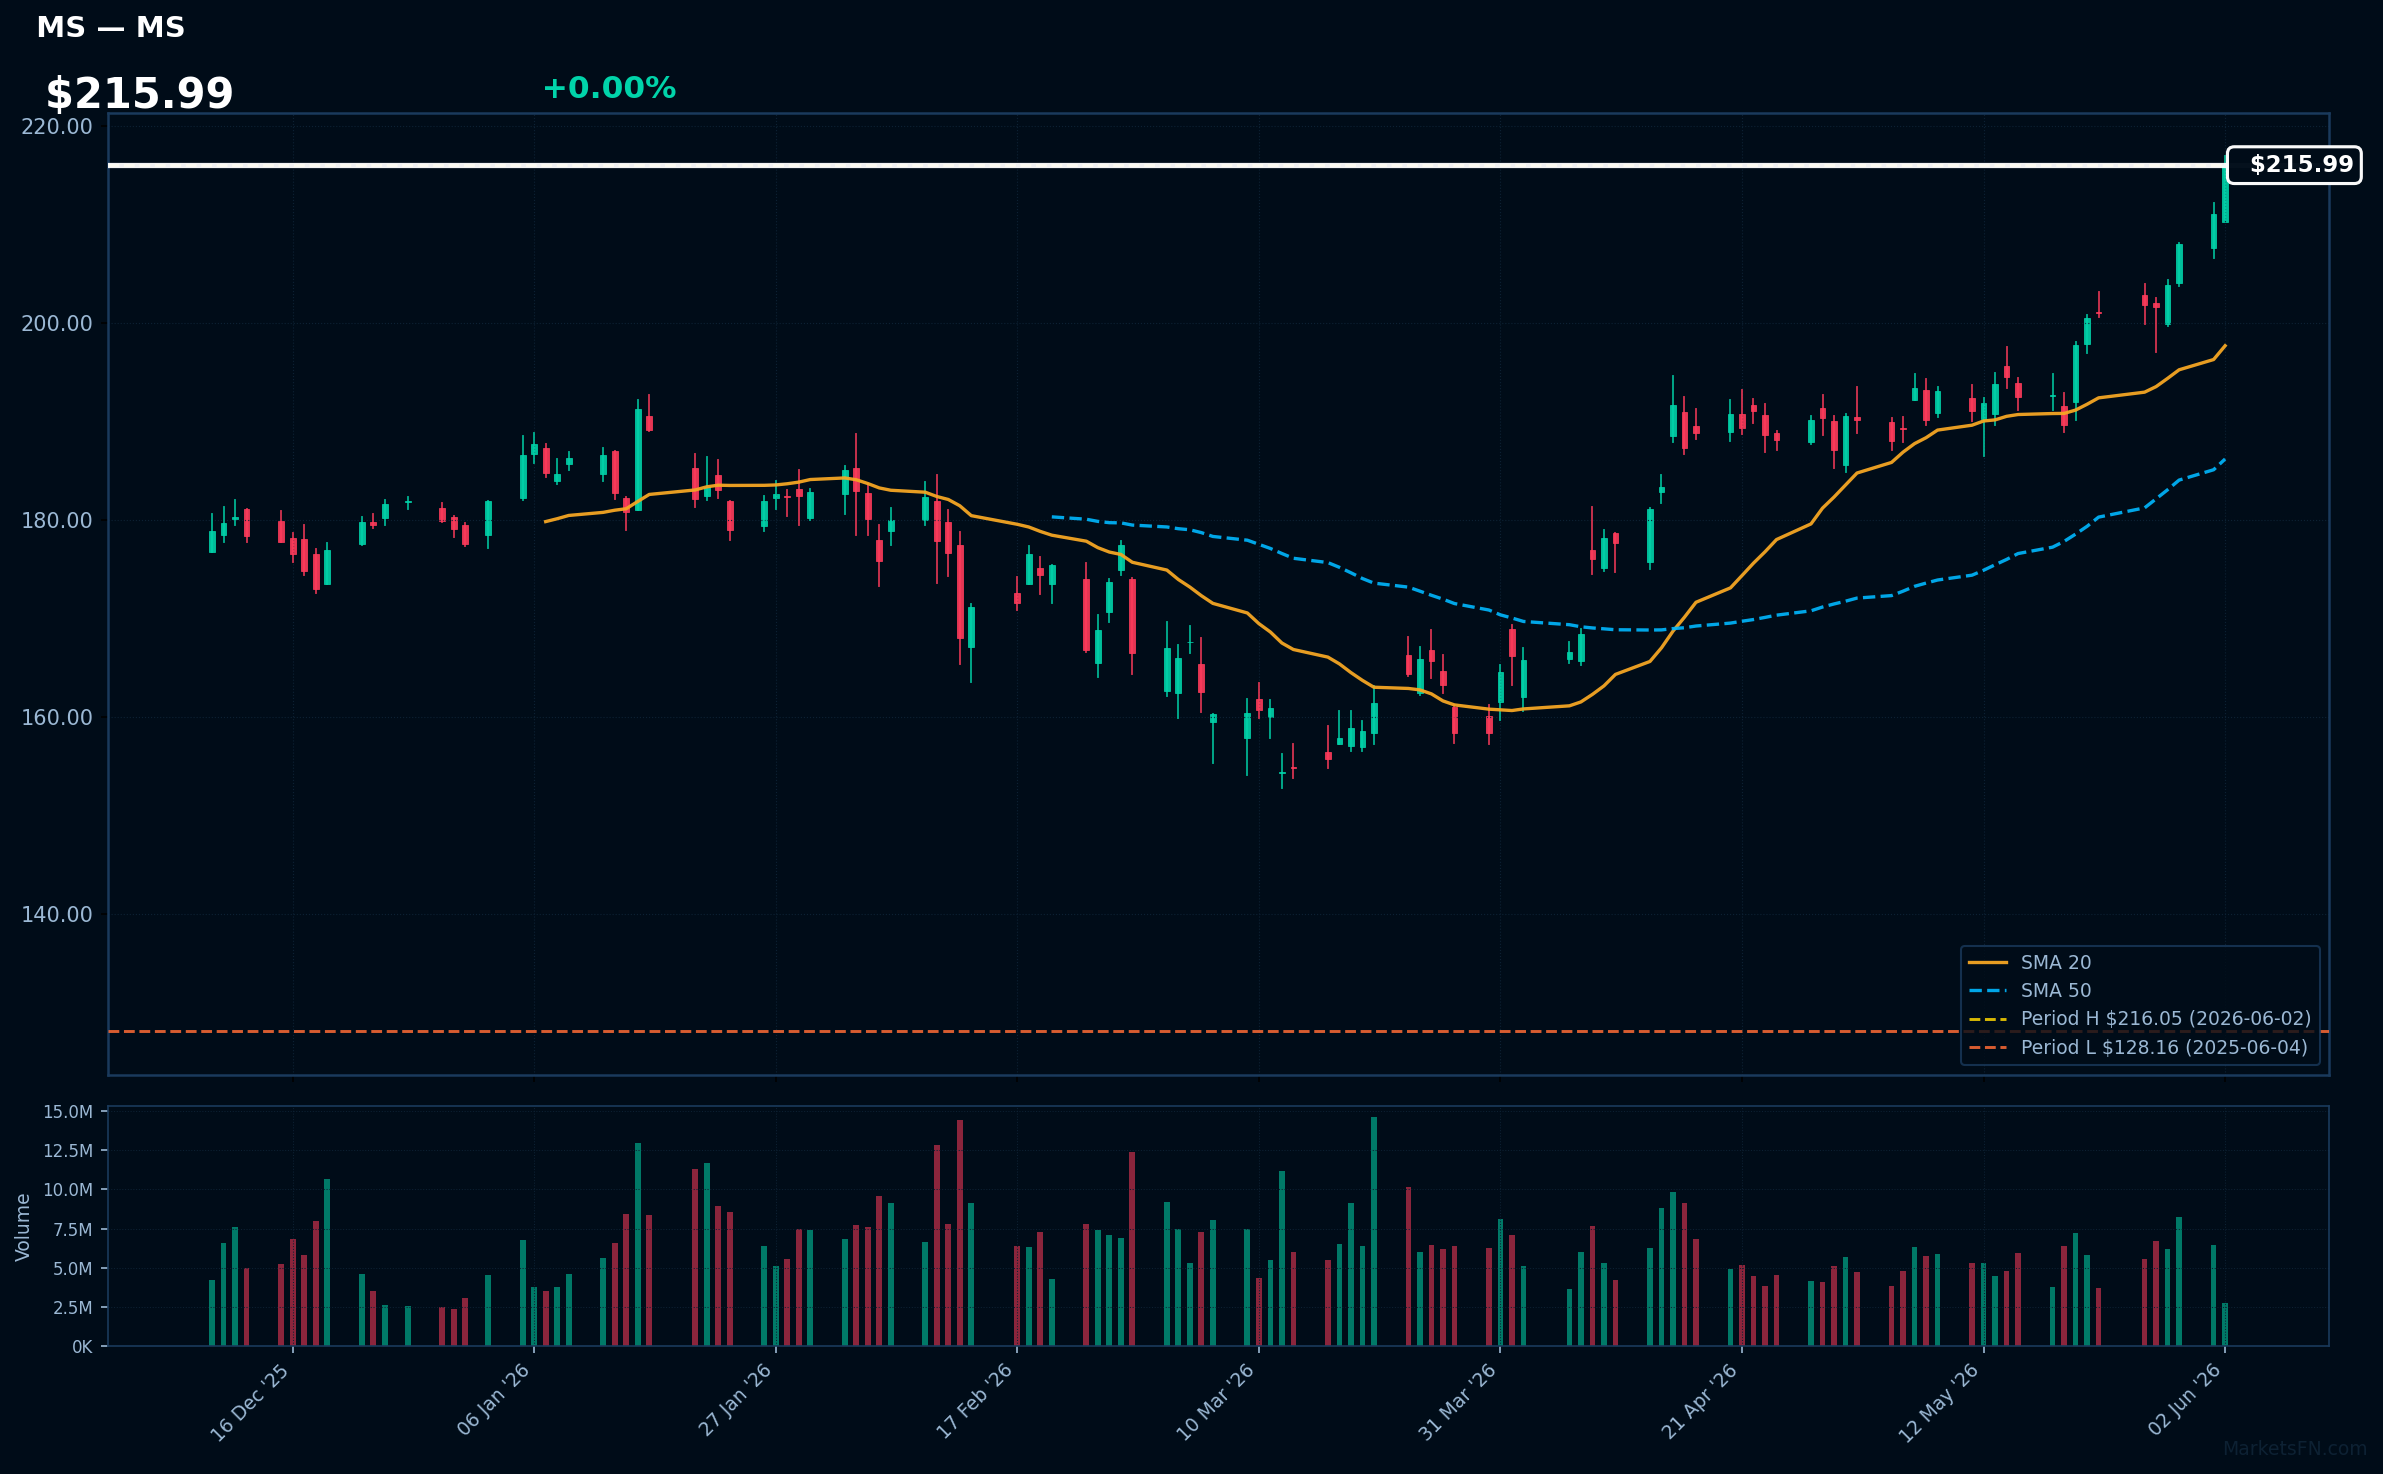
MS | Morgan Stanley | Financial | Price Last: $216.05 | % Realized: +68.26% | RSI: 79.9 | % above MA200: +26.0% | Trend: Above MA20, MA50, MA200
Morgan Stanley is a global financial services firm providing investment banking, wealth management, and investment management services. Investors should care about its diversified revenue streams and market position, which drive long-term growth.
Morgan Stanley's RSI(14) is 79.9, indicating overbought conditions. The bullish MA alignment (price > MA20 > MA50 > MA200) suggests a sustained uptrend. With the stock 0.0% below its 52-Week high, it nears a potential breakout level, signaling strong momentum.
Related headlines
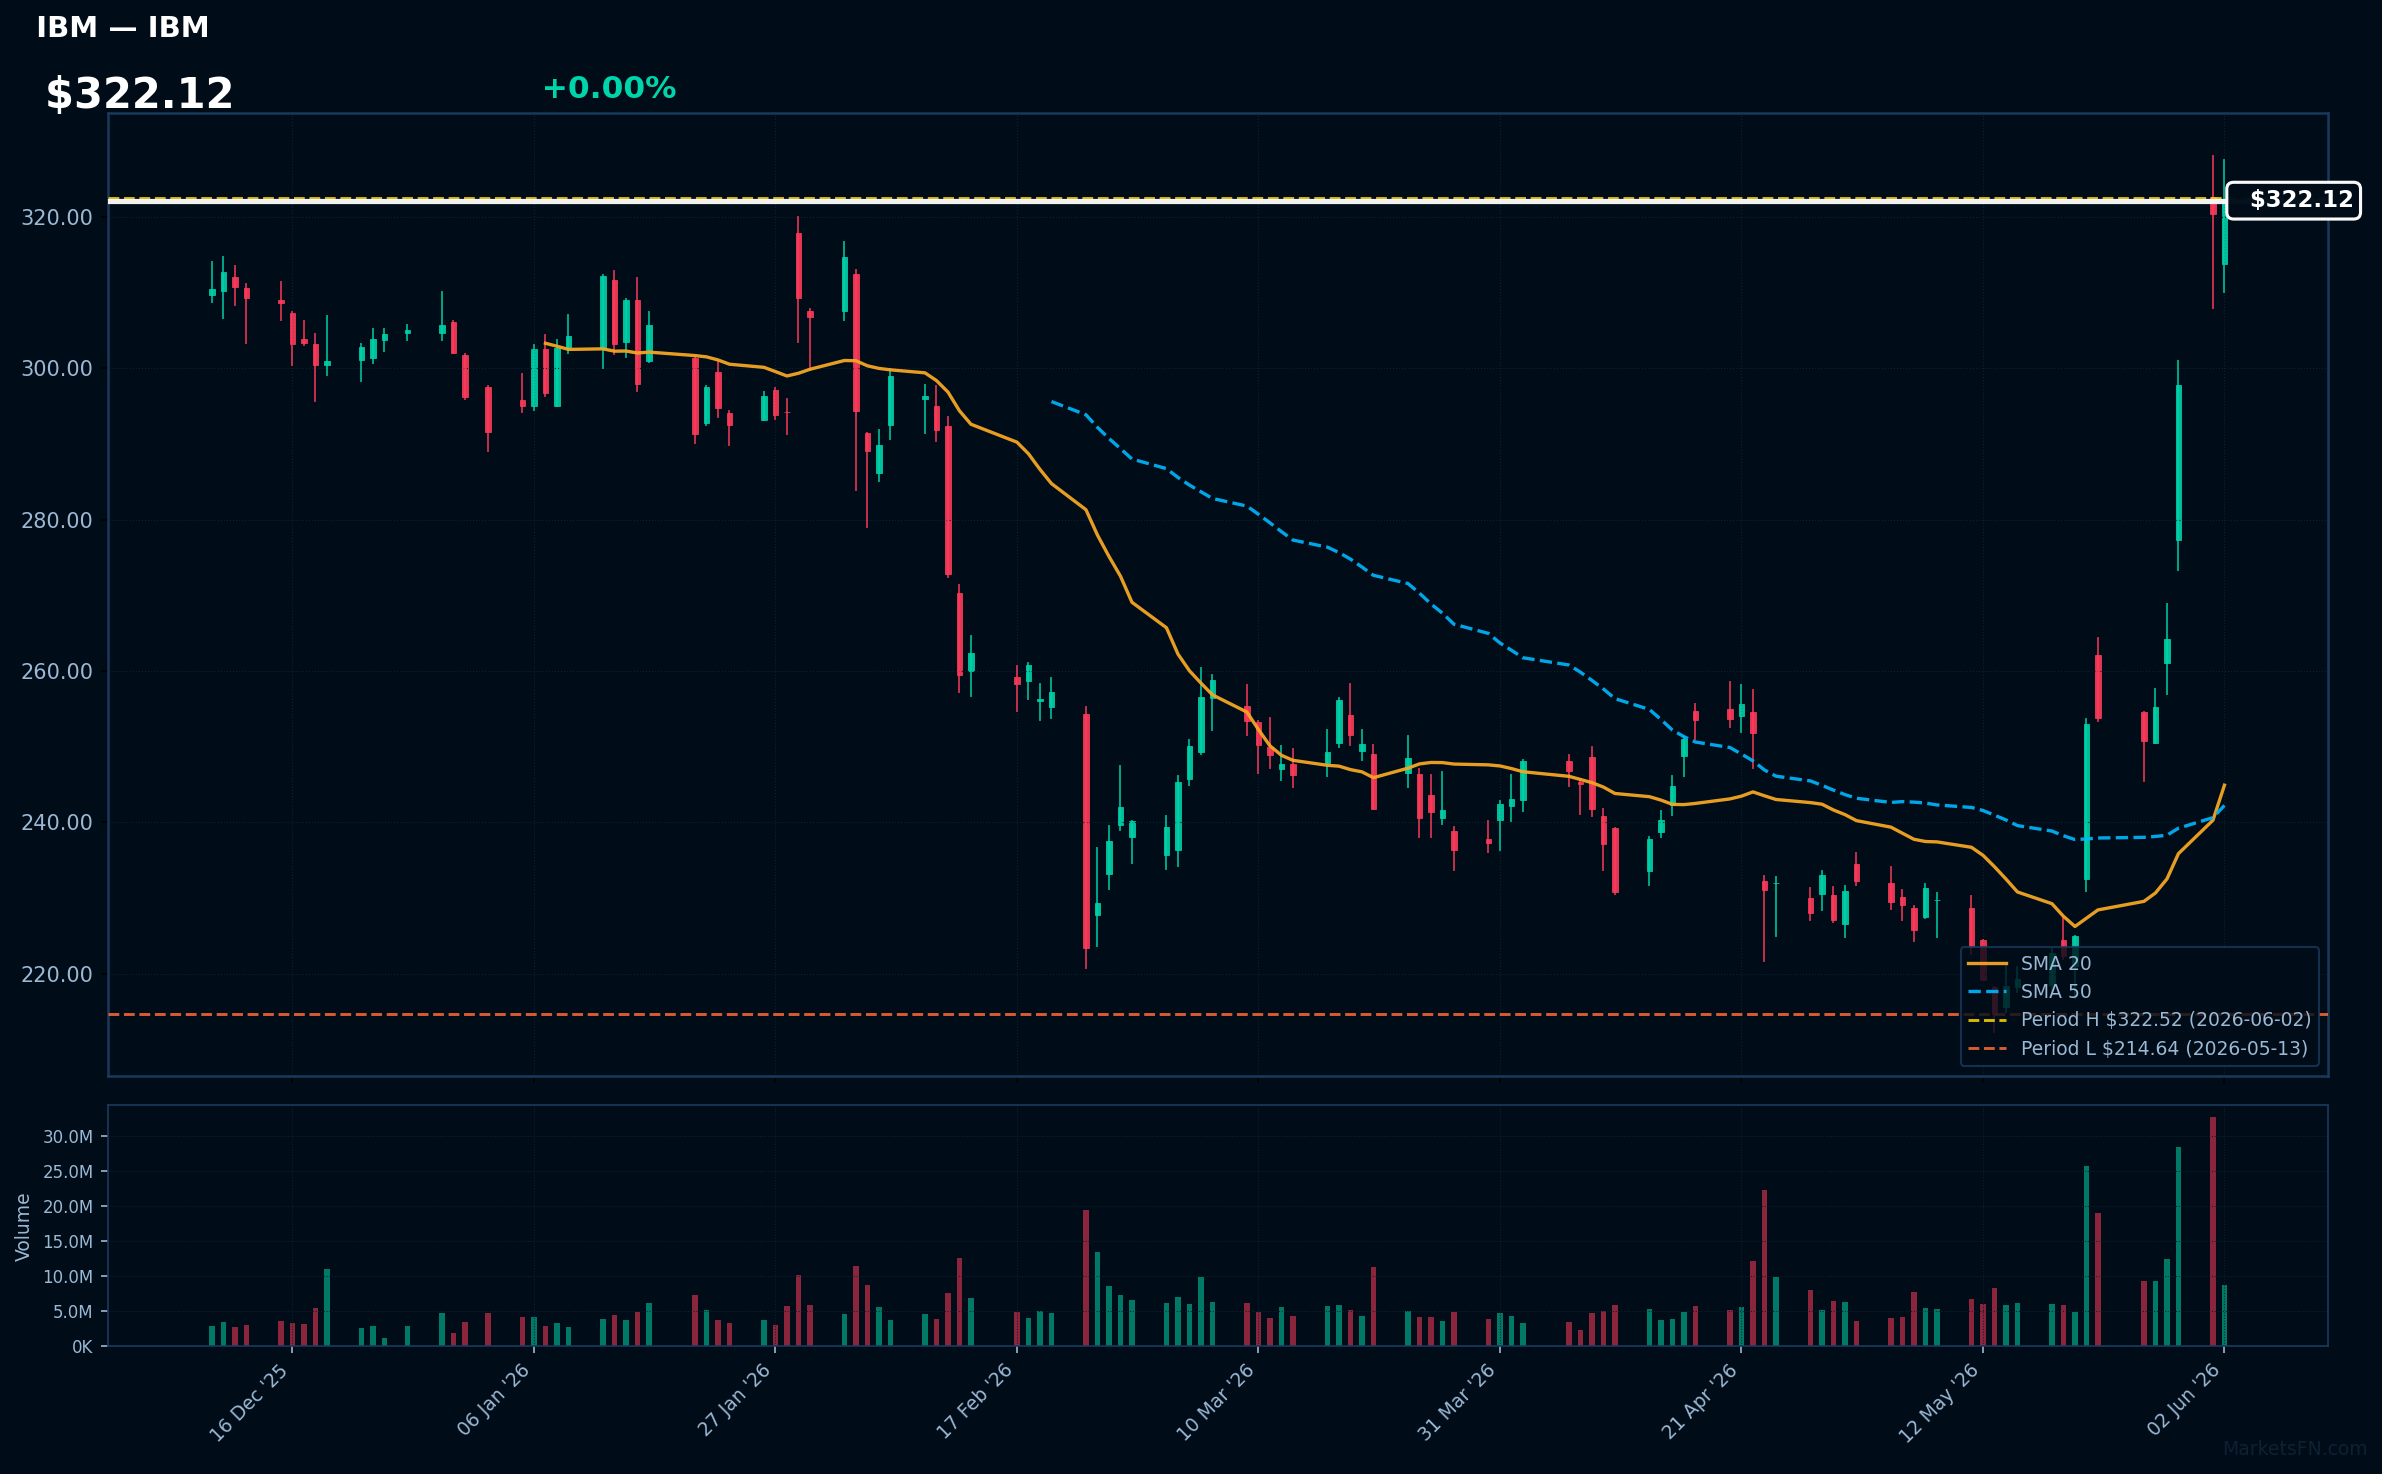
IBM | International Business Machines Corp | Technology | Price Last: $322.52 | % Realized: +22.21% | RSI: 84.1 | % above MA200: +18.9% | Trend: Above MA20, MA50, MA200
International Business Machines Corp (IBM) is a technology company that provides a range of services including cloud computing, AI, and IT consulting. Investors should care about its transition towards higher-growth areas like hybrid cloud and AI.
IBM's RSI(14) is 84.1, indicating overbought conditions. The stock is above MA20/MA50/MA200 and 0.0% below its 52-Week high, suggesting strong momentum, but potentially nearing a breakout or reversal level.
Related headlines
- Wedbush lifts IBM price target as AI transformation fears give way to execution confidence
- IBM Commits More Than $10 Billion to Quantum Computing, Funding Its Roadmap from Today's Leading Systems to the World's First Fault-Tolerant Quantum Computers
- IBM Stock Jumps Double Digits as Barclays Lifts Price Target to $350
- Did Trump spark an IBM stock rally? It's complicated.
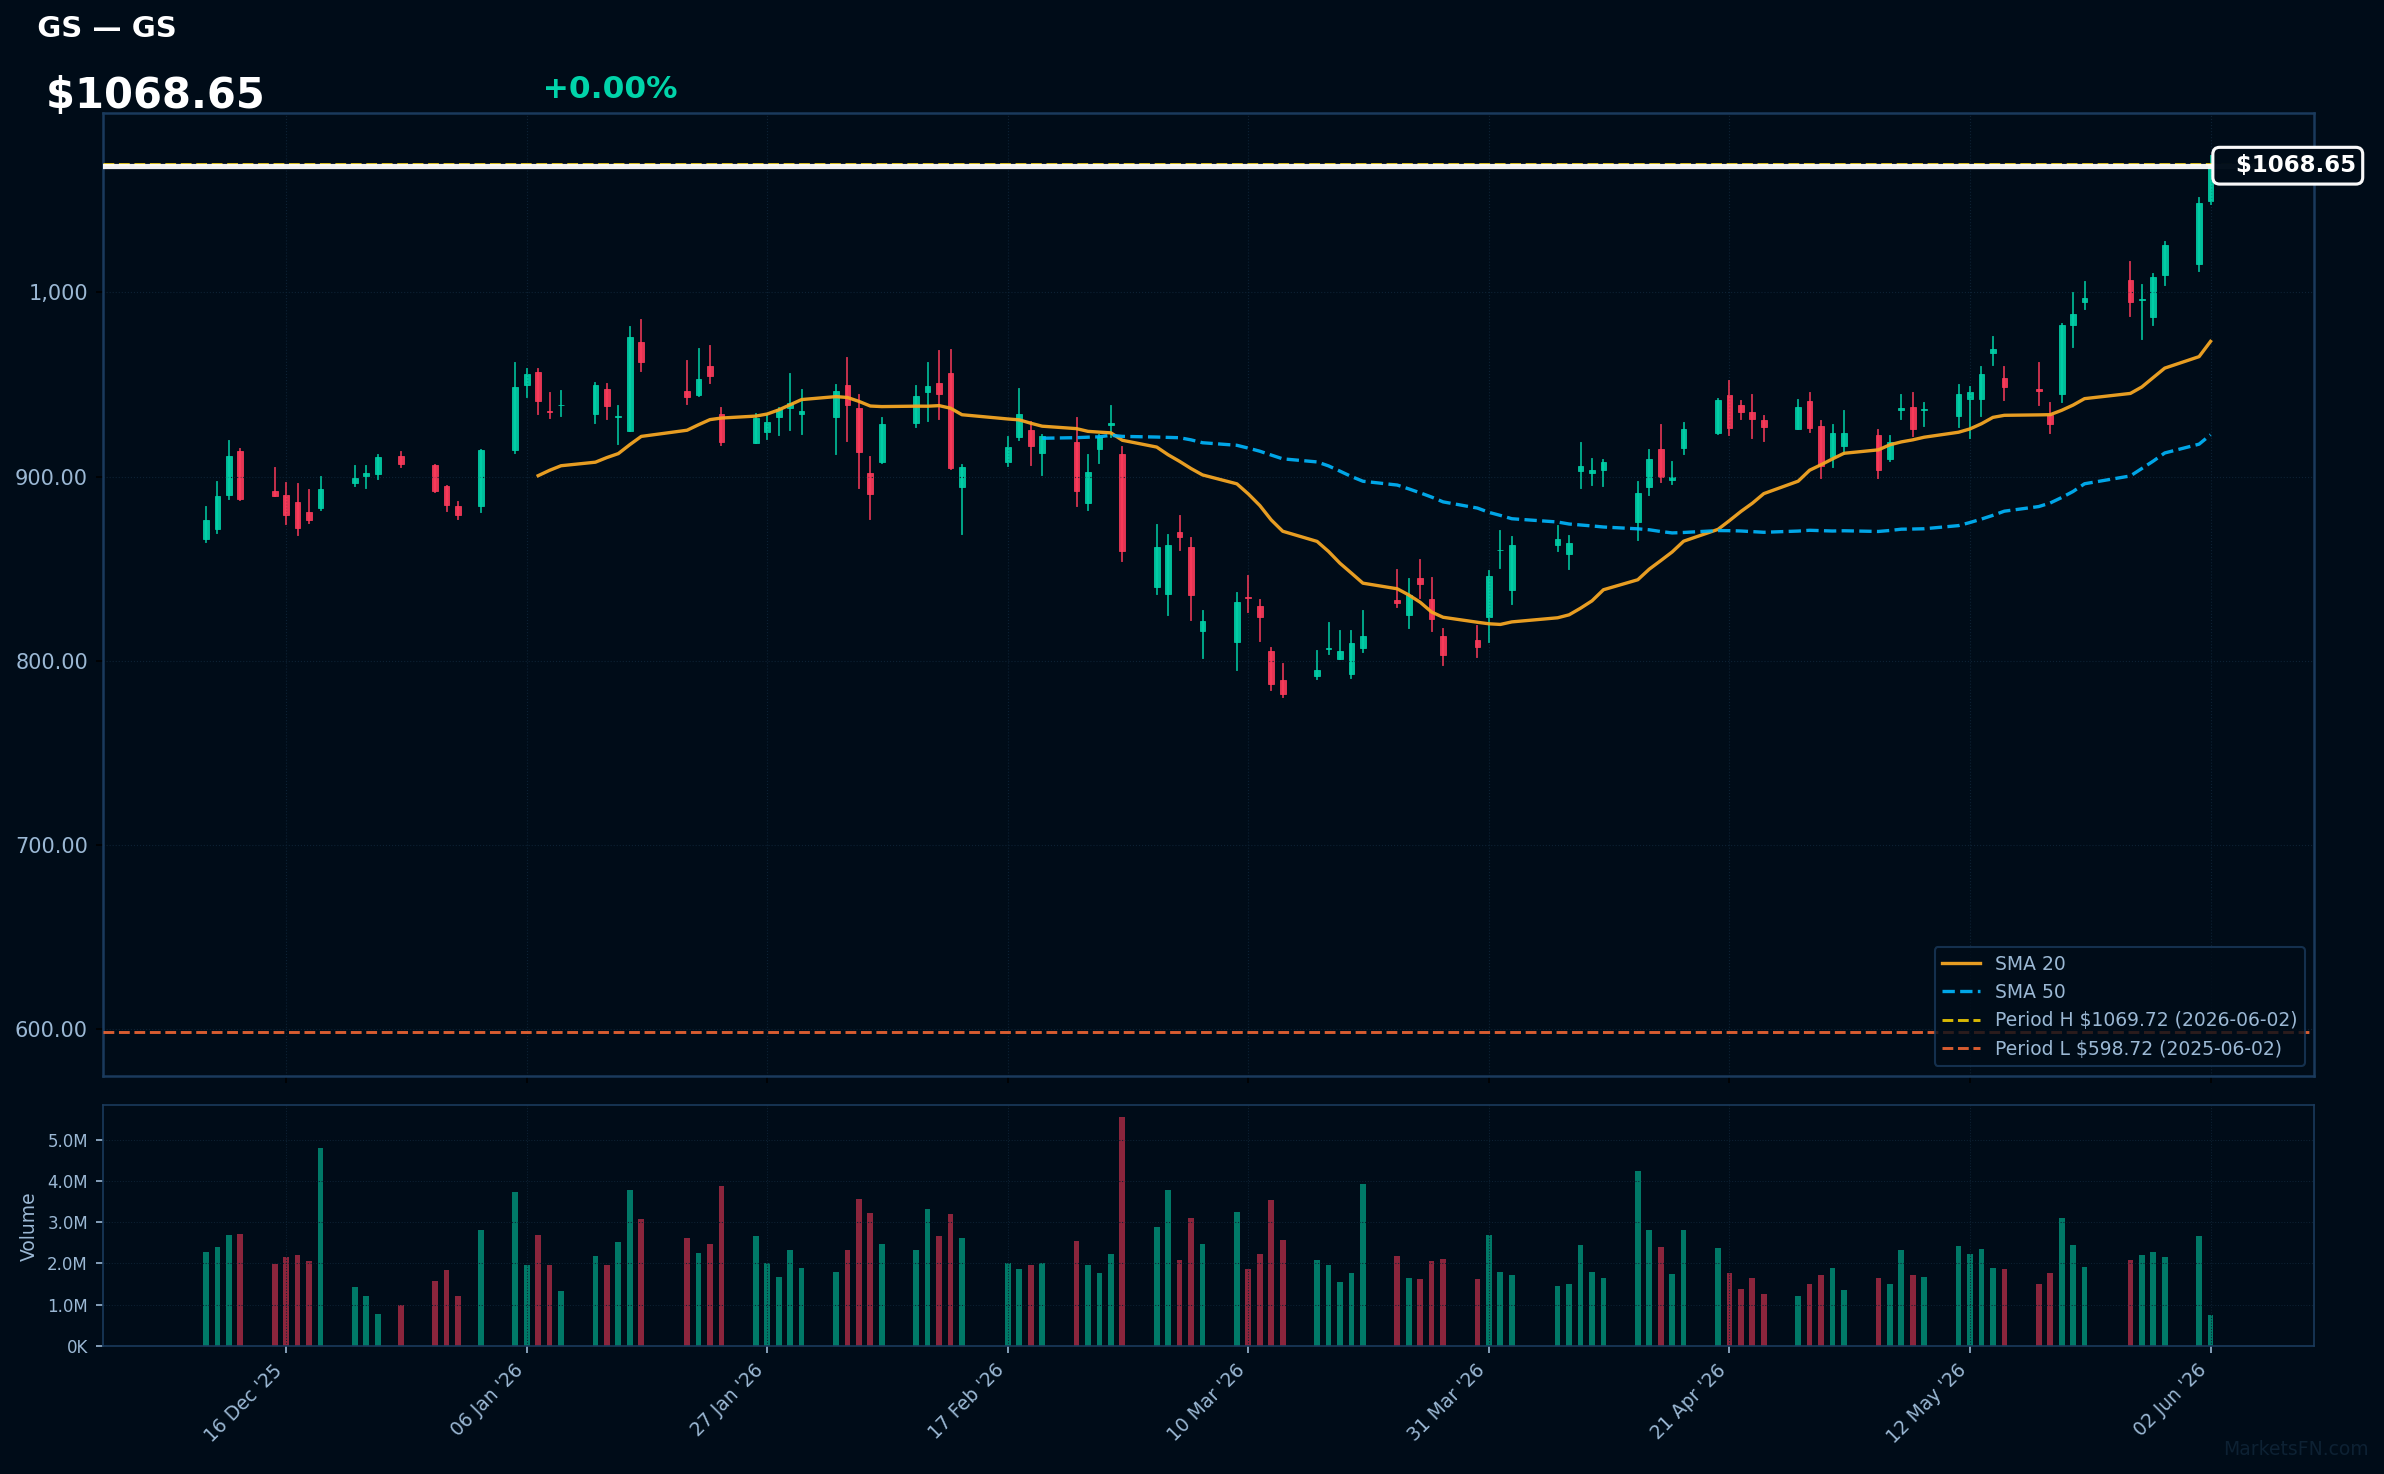
GS | Goldman Sachs Group, Inc | Financial | Price Last: $1069.72 | % Realized: +78.67% | RSI: 77.5 | % above MA200: +24.8% | Trend: Above MA20, MA50, MA200
Goldman Sachs Group, Inc is a global investment bank, providing financial services including investment banking, asset management, and securities trading. Investors care due to its significant role in global financial markets and exposure to various asset classes.
The stock exhibits strong bullish momentum with RSI(14) at 77.5, indicating overbought conditions. MA alignment is bullish as price ($1068.65) > MA20 > MA50 > MA200, and it's 0.0% below its 52-Week high, suggesting a potential breakout.
Related headlines
📉 Nearest to 52-Week Low
Sectors represented: Financial (2), Healthcare (2), Consumer Cyclical (1)
| Ticker | Company | Sector | Price Last | % Realized | 52-Week Low Date | RSI | % above MA200 | Trend |
|---|---|---|---|---|---|---|---|---|
| MA | Mastercard Incorporated | Financial | $482.18 | -17.04% | 2026-06-02 | 37.8 | -10.9% | Below MA20, MA50, MA200 |
| ISRG | Intuitive Surgical Inc | Healthcare | $400.73 | -27.57% | 2026-06-02 | 31.4 | -18.9% | Below MA20, MA50, MA200 |
| BSX | Boston Scientific Corp | Healthcare | $47.81 | -54.10% | 2026-06-02 | 27.8 | -43.5% | Below MA20, MA50, MA200 |
| LOW | Lowe's Cos., Inc | Consumer Cyclical | $205.71 | -8.78% | 2026-06-02 | 30.8 | -17.1% | Below MA20, MA50, MA200 |
| ICE | Intercontinental Exchange Inc | Financial | $140.87 | -21.88% | 2026-06-02 | 24.3 | -12.7% | Below MA20, MA50, MA200 |
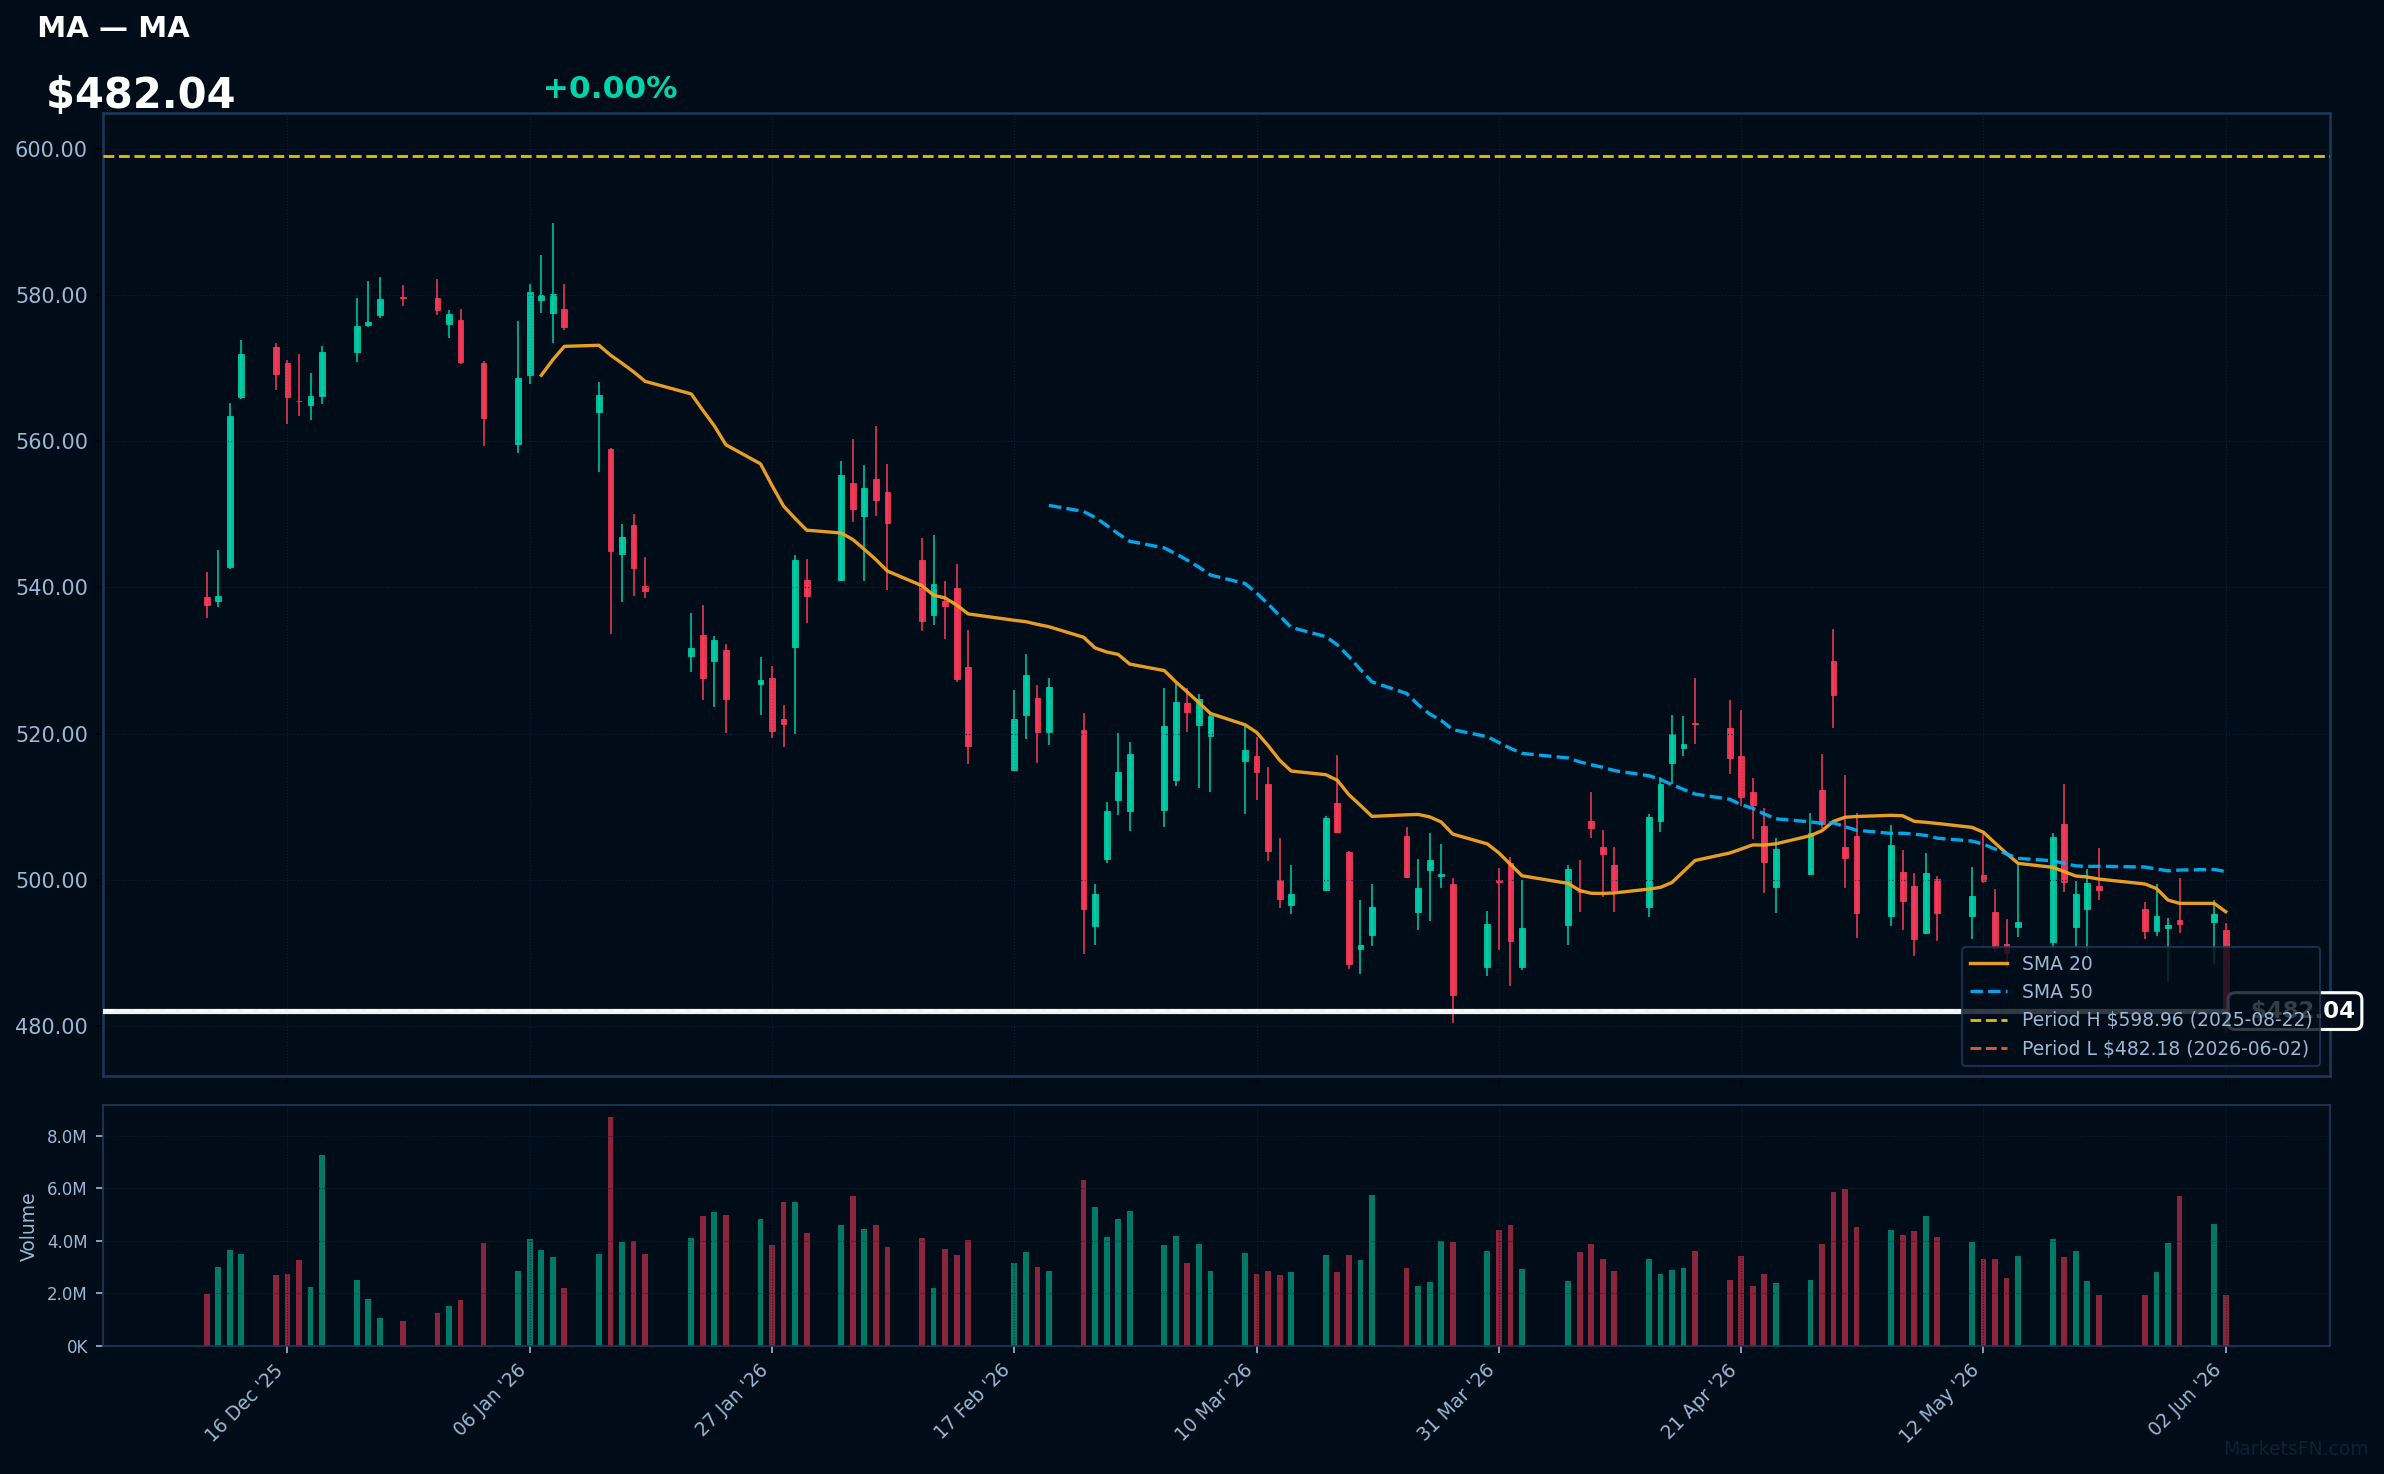
MA | Mastercard Incorporated | Financial | Price Last: $482.18 | % Realized: -17.04% | RSI: 37.8 | % above MA200: -10.9% | Trend: Below MA20, MA50, MA200
Mastercard Incorporated operates a payment processing network, facilitating transactions between consumers, merchants, and financial institutions, generating revenue through transaction fees and other services, making its performance relevant to investors tracking the payments industry's growth and trends.
Mastercard's technical situation is bearish, with an RSI(14) of 37.8, indicating oversold conditions, and a sustained downtrend as price ($482.04) remains below MA20, MA50, and MA200, with the stock testing major support at its 52-Week low.
Related headlines
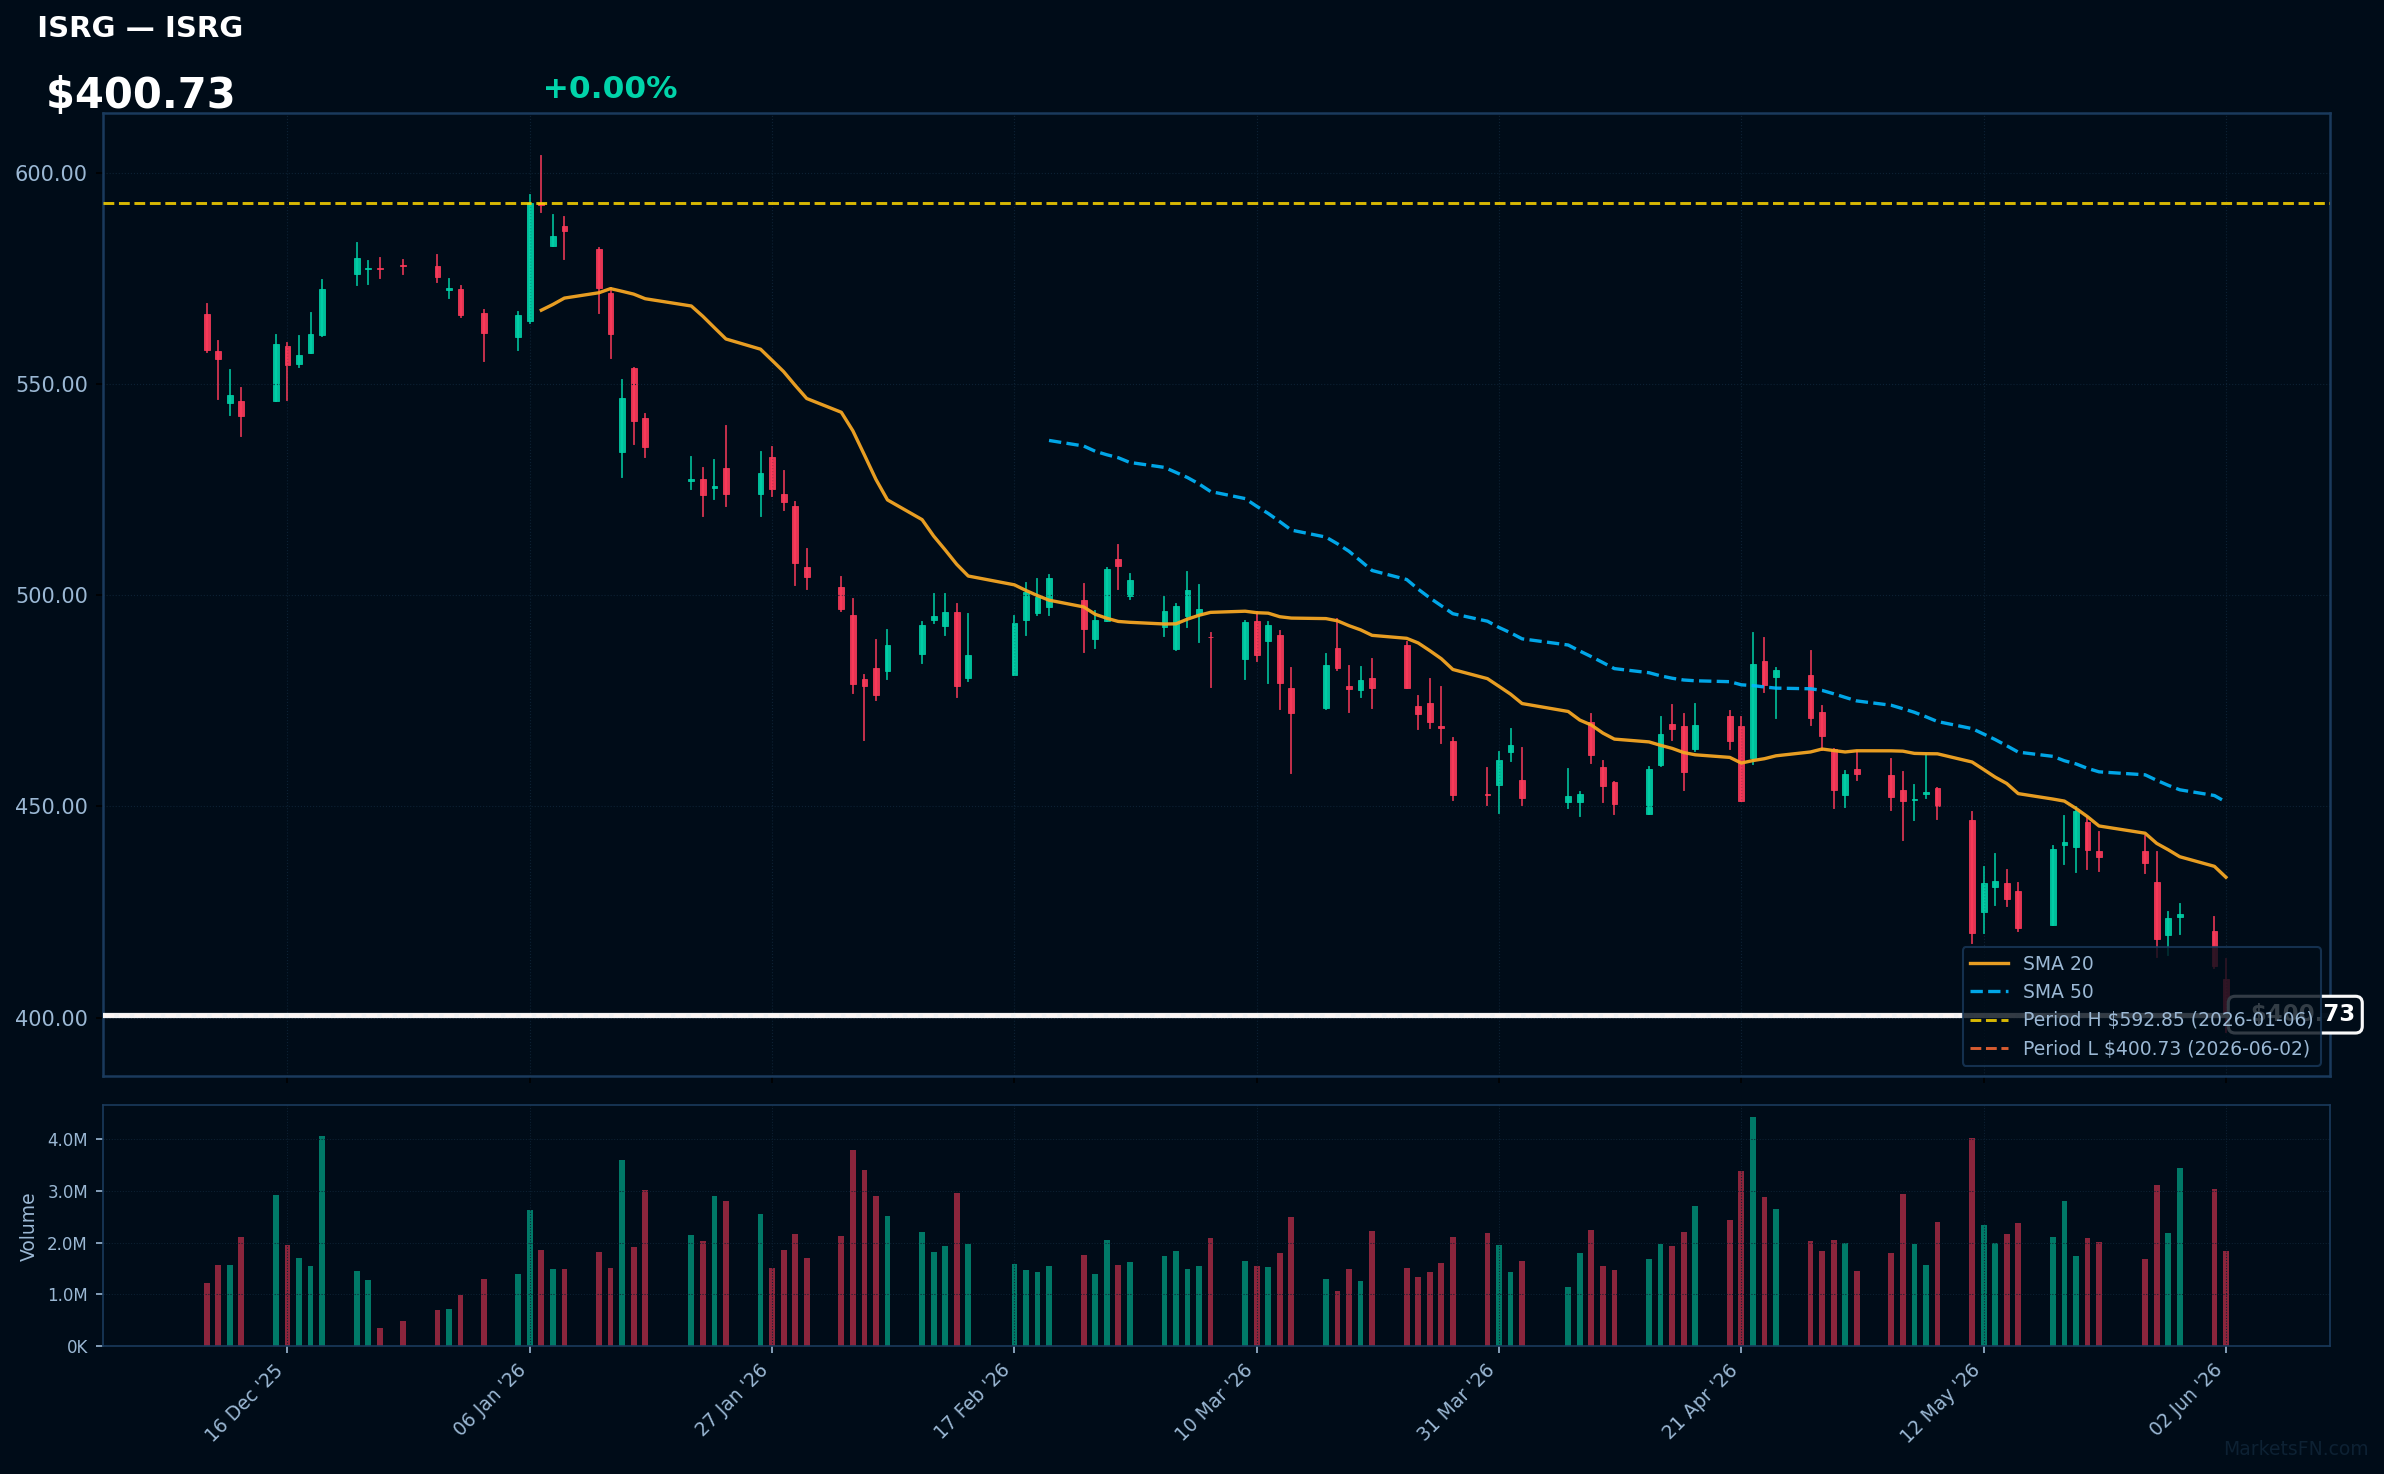
ISRG | Intuitive Surgical Inc | Healthcare | Price Last: $400.73 | % Realized: -27.57% | RSI: 31.4 | % above MA200: -18.9% | Trend: Below MA20, MA50, MA200
Intuitive Surgical Inc develops and markets robotic-assisted surgical systems, primarily the da Vinci Surgical System, enabling minimally invasive surgeries. Investors care due to its market leadership and potential for growth in robotic-assisted surgery adoption.
ISRG's technical situation is bearish, with RSI(14) at 31.4, indicating oversold conditions, and a sustained downtrend as price ($400.73) remains below MA20, MA50, and MA200. The stock is testing major support at its 52-Week low.
Related headlines
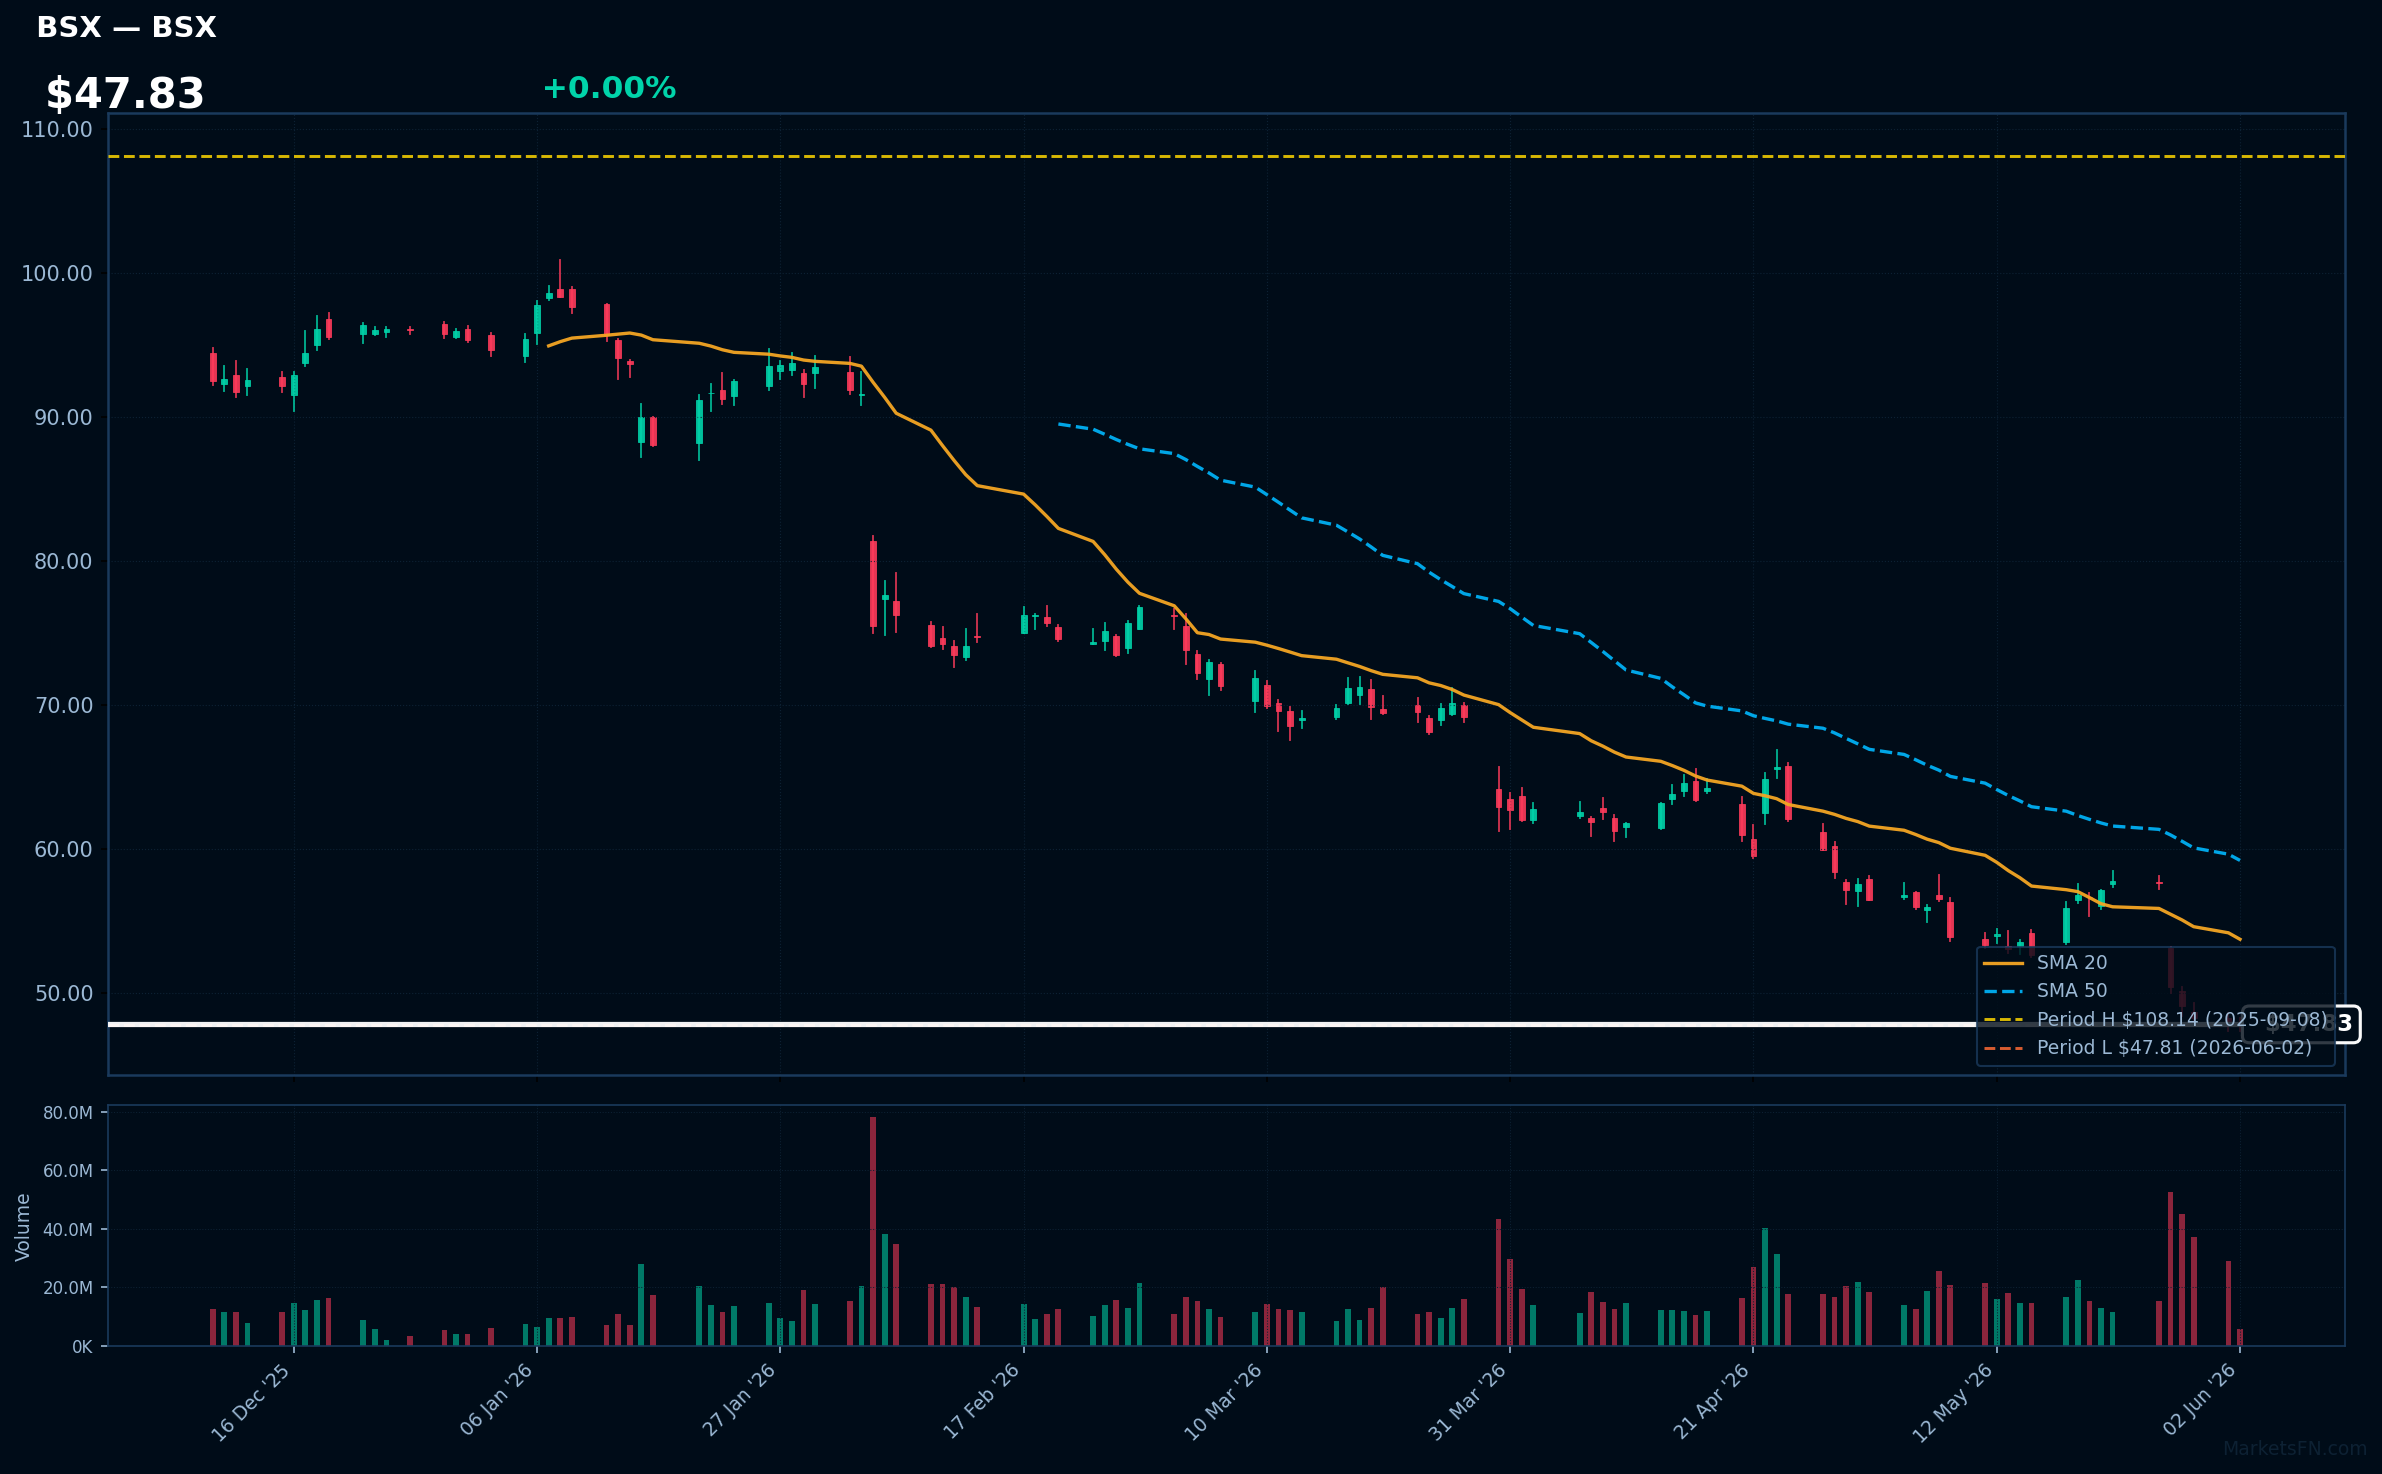
BSX | Boston Scientific Corp | Healthcare | Price Last: $47.81 | % Realized: -54.10% | RSI: 27.8 | % above MA200: -43.5% | Trend: Below MA20, MA50, MA200
Boston Scientific Corp (BSX) develops and manufactures medical devices, including stents, pacemakers, and neurovascular intervention products, addressing cardiovascular and other diseases. Investors should care about its innovation pipeline and market share in the medical device industry.
BSX is in a sustained downtrend with price ($47.83) below MA20, MA50, and MA200. The RSI(14) is 27.8, near oversold territory, and the stock is at its 52-Week low, indicating potential support testing, a warning sign for investors.
Related headlines
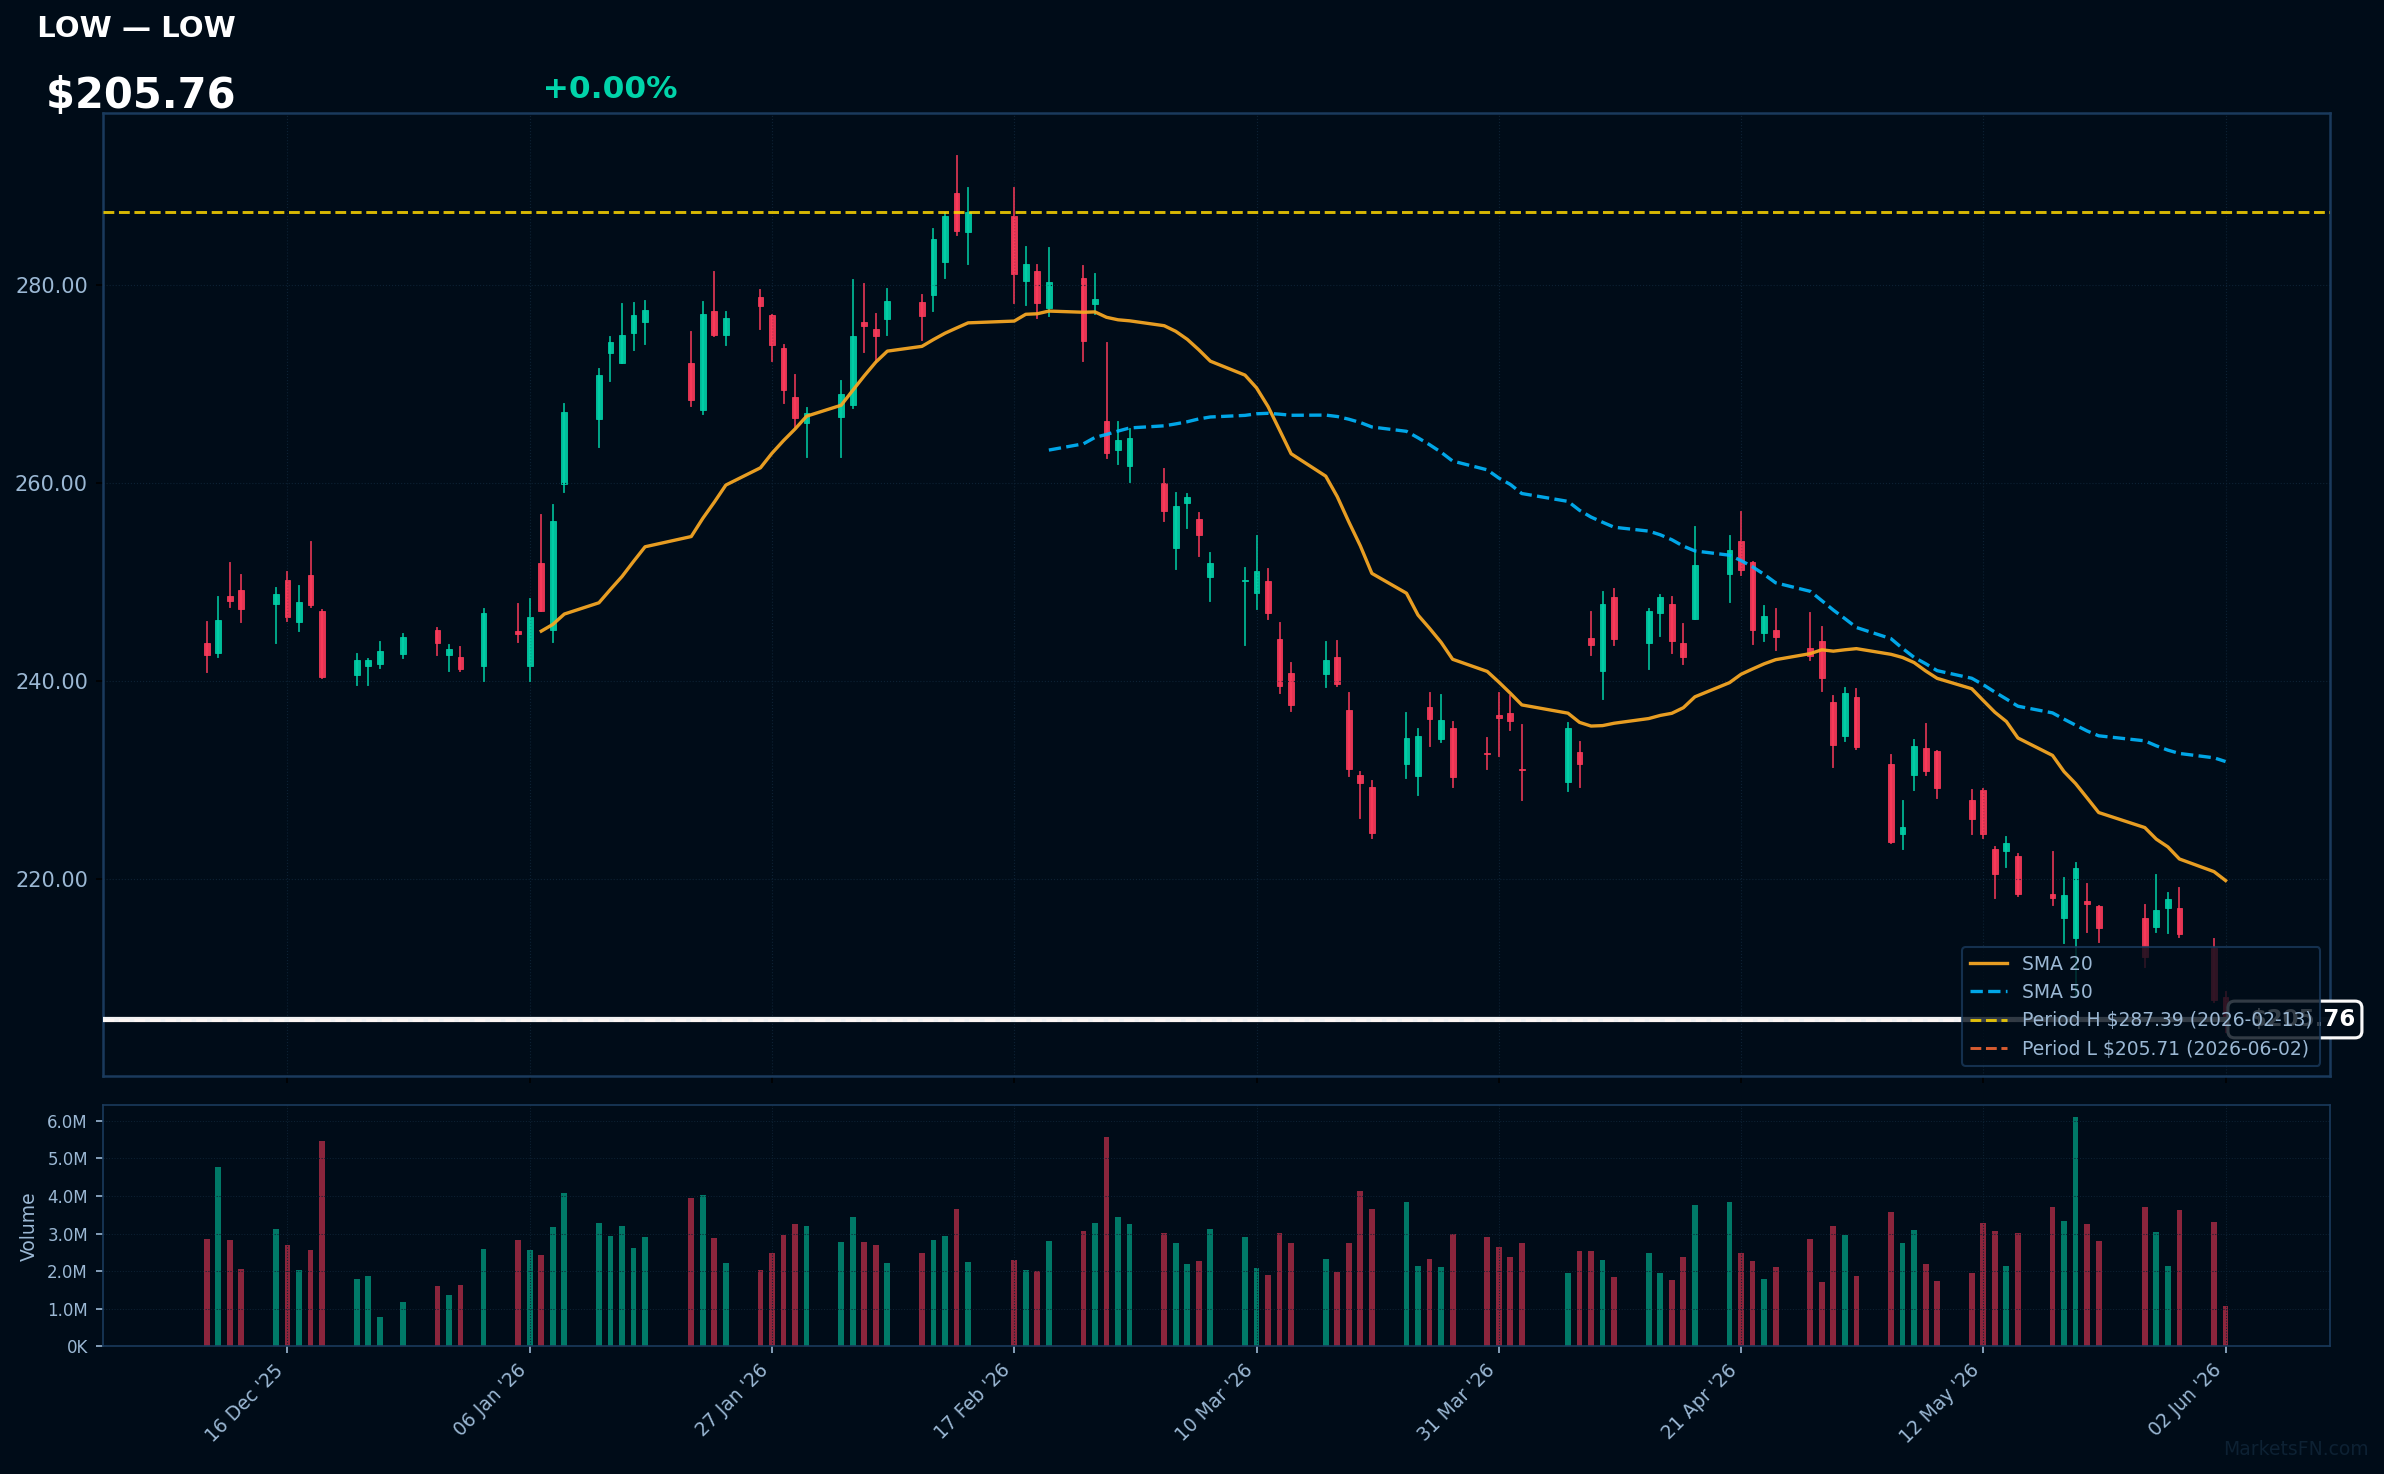
LOW | Lowe's Cos., Inc | Consumer Cyclical | Price Last: $205.71 | % Realized: -8.78% | RSI: 30.8 | % above MA200: -17.1% | Trend: Below MA20, MA50, MA200
Lowe's Cos., Inc operates as a home improvement retailer, selling products such as building materials, tools, and appliances. Investors should care because its performance reflects housing market trends and consumer spending habits.
Lowe's is testing major support with its price 0.0% above 52-Week low. RSI(14) is 30.8, indicating oversold conditions. Bearish MA alignment (price < MA20 < MA50 < MA200) suggests a sustained downtrend, potentially a warning sign.
Related headlines
- Why Did BSX, LOW, CAG Fall To 52-Week Lows Today?
- LOWE'S COMPANIES, INC. ANNOUNCES INCREASE IN QUARTERLY CASH DIVIDEND TO $1.25 PER SHARE
- Lowes courts DIY shoppers as AI tools boost online conversions
- Lowes and Home Depot's new AI-powered license plate readers are meant to catch thieves, but experts worry about privacy
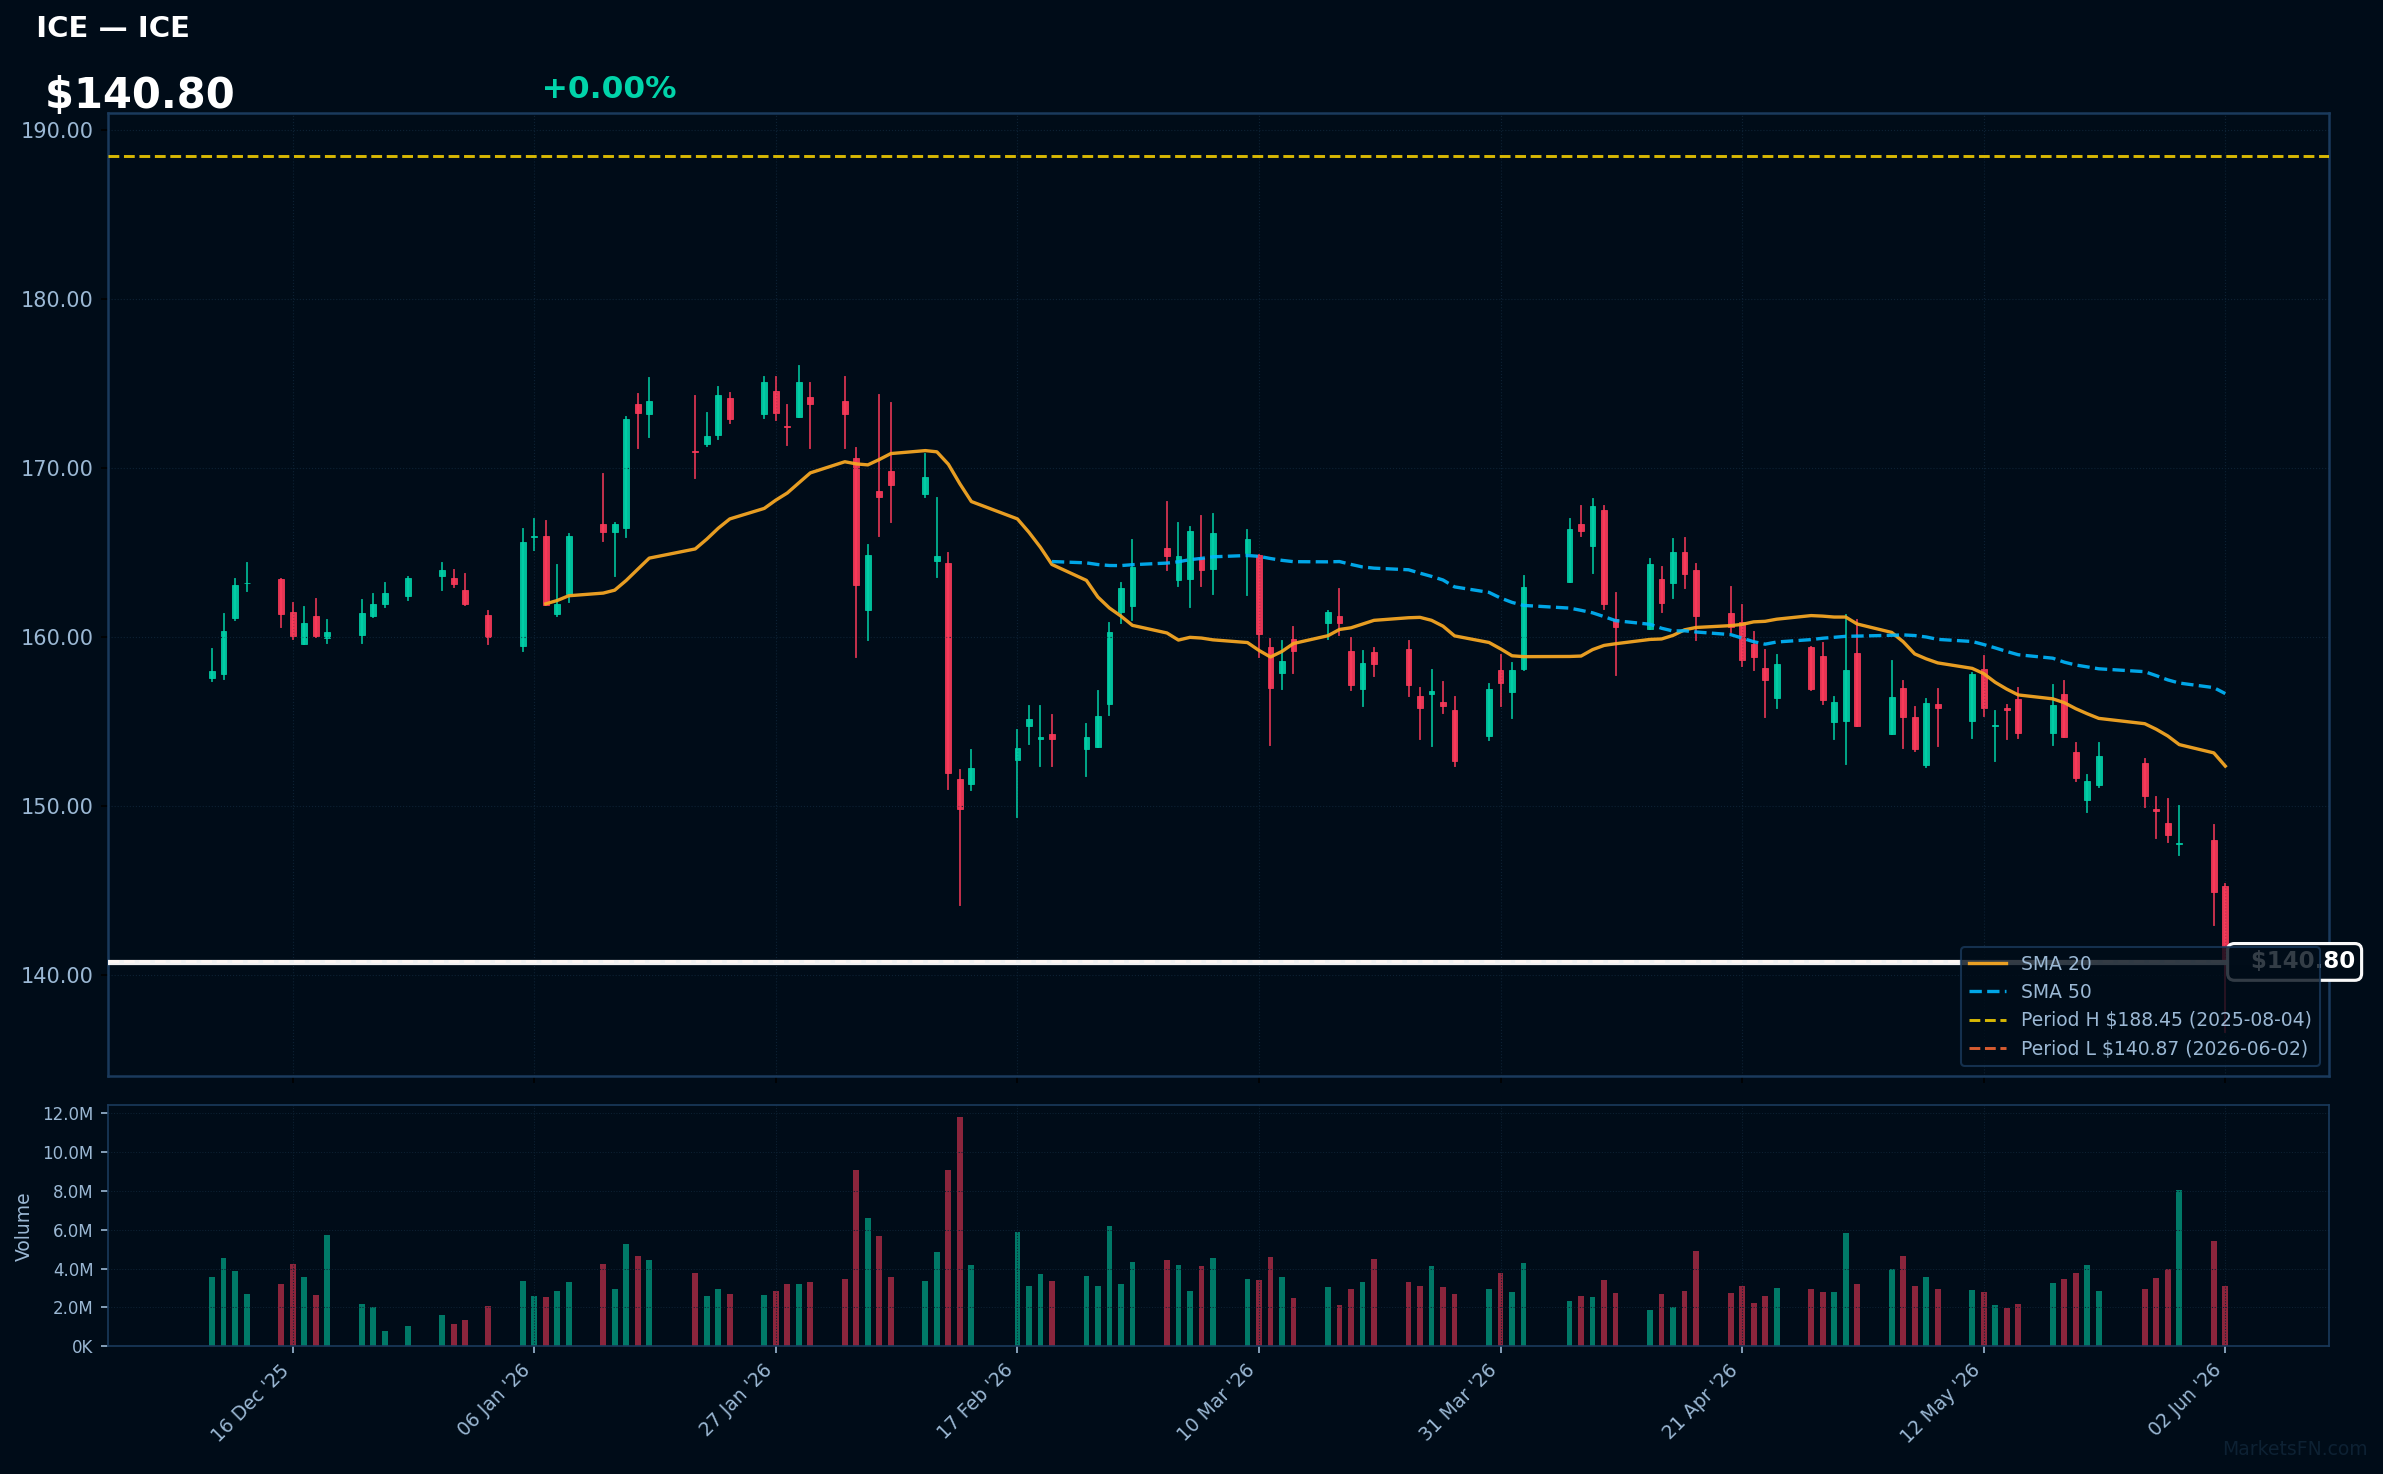
ICE | Intercontinental Exchange Inc | Financial | Price Last: $140.87 | % Realized: -21.88% | RSI: 24.3 | % above MA200: -12.7% | Trend: Below MA20, MA50, MA200
Intercontinental Exchange Inc (ICE) operates global exchanges, clearing houses, and data services, facilitating trading in financial and commodity markets; investors care due to its critical role in global financial infrastructure and potential exposure to market volatility.
ICE's technical situation indicates a sustained downtrend with price ($140.80) below MA20, MA50, and MA200; RSI(14) at 24.3 suggests oversold conditions, and being 0.0% above its 52-Week low signals testing of major support, potentially a warning sign.
Related headlines
- ICE Introduces Fraud Monitor to Help Mortgage Lenders Identify Fraud Risk and Accelerate Underwriting
- ICE's Total Futures and Options at Record Open Interest as Global Natural Gas and Power Markets Reach Record Levels of Liquidity
- ICE First Look at Mortgage Performance: Delinquencies Hold Steady in April as Cures Rebound for the Second Consecutive Month
- ICE ETF Hub Receives Regulatory Approval to Operate in Europe and Australia
Market Commentary
The S&P 500 stocks listed are currently trading near their 52-week extremes, with some at highs and others at lows. Stocks like AVGO, CSCO, MS, IBM, and GS are at their 52-week highs, while MA, ISRG, BSX, LOW, and ICE are at their 52-week lows. This indicates a significant price movement, potentially driven by fundamental factors or market sentiment.
The stocks at 52-week highs are from the technology and financial sectors, suggesting strength in these areas. Conversely, the stocks at 52-week lows span healthcare, consumer staples, and financials, indicating potential weakness or concerns in these sectors. Sector rotation and macro themes, such as interest rate changes or economic outlook, may be driving these price levels.
Key levels to watch include the current prices of these stocks, as a break above or below their 52-week extremes could signal further momentum. Potential catalysts include earnings reports, industry trends, and broader economic indicators. Monitoring these factors will be crucial in understanding the future direction of these stocks and the overall market.
Methodology: All 503 S&P 500 constituents screened. 52-week high = highest daily close over the past 252 trading days (approx. 1 year). 52-week low = lowest daily close over the same period. Distance = (current price / extreme − 1) × 100. Technical indicators computed on up to 1 year of daily OHLCV data.
Disclaimer: For informational purposes only. Not investment advice. Past performance is not indicative of future results.