S&P 500 52-Week Highs & Lows Radar: GE Aerospace (GE), CME (CME) and more
· Stocks · MarketsFN Team
S&P 500 52-Week Highs & Lows Radar: GE Aerospace (GE), CME (CME) and more
Screening all 503 S&P 500 constituents for stocks nearest to their 52-week high and their 52-week low. Data as of June 24, 2026. % Realized = 52-week total return.
Legend: RSI > 70 = overbought · RSI < 30 = oversold · Green % Realized = positive 52W return · Red = negative.
📈 Nearest to 52-Week High
Sectors represented: Financial (2), Industrials (1), Consumer Defensive (1), Utilities (1)
| Ticker | Company | Sector | Price Last | % Realized | 52-Week High Date | RSI | % above MA200 | Trend |
|---|---|---|---|---|---|---|---|---|
| GE | GE Aerospace | Industrials | $357.90 | +43.88% | 2026-06-24 | 70.6 | +16.7% | Above MA20, MA50, MA200 |
| TRV | Travelers Companies Inc | Financial | $317.37 | +19.25% | 2026-06-24 | 68.4 | +9.3% | Above MA20, MA50, MA200 |
| MNST | Monster Beverage Corp | Consumer Defensive | $94.49 | +48.64% | 2026-06-24 | 70.5 | +23.4% | Above MA20, MA50, MA200 |
| ALL | Allstate Corp | Financial | $232.71 | +18.70% | 2026-06-24 | 67.6 | +11.9% | Above MA20, MA50, MA200 |
| D | Dominion Energy Inc | Utilities | $68.93 | +23.14% | 2026-06-24 | 62.1 | +11.2% | Above MA20, MA50, MA200 |
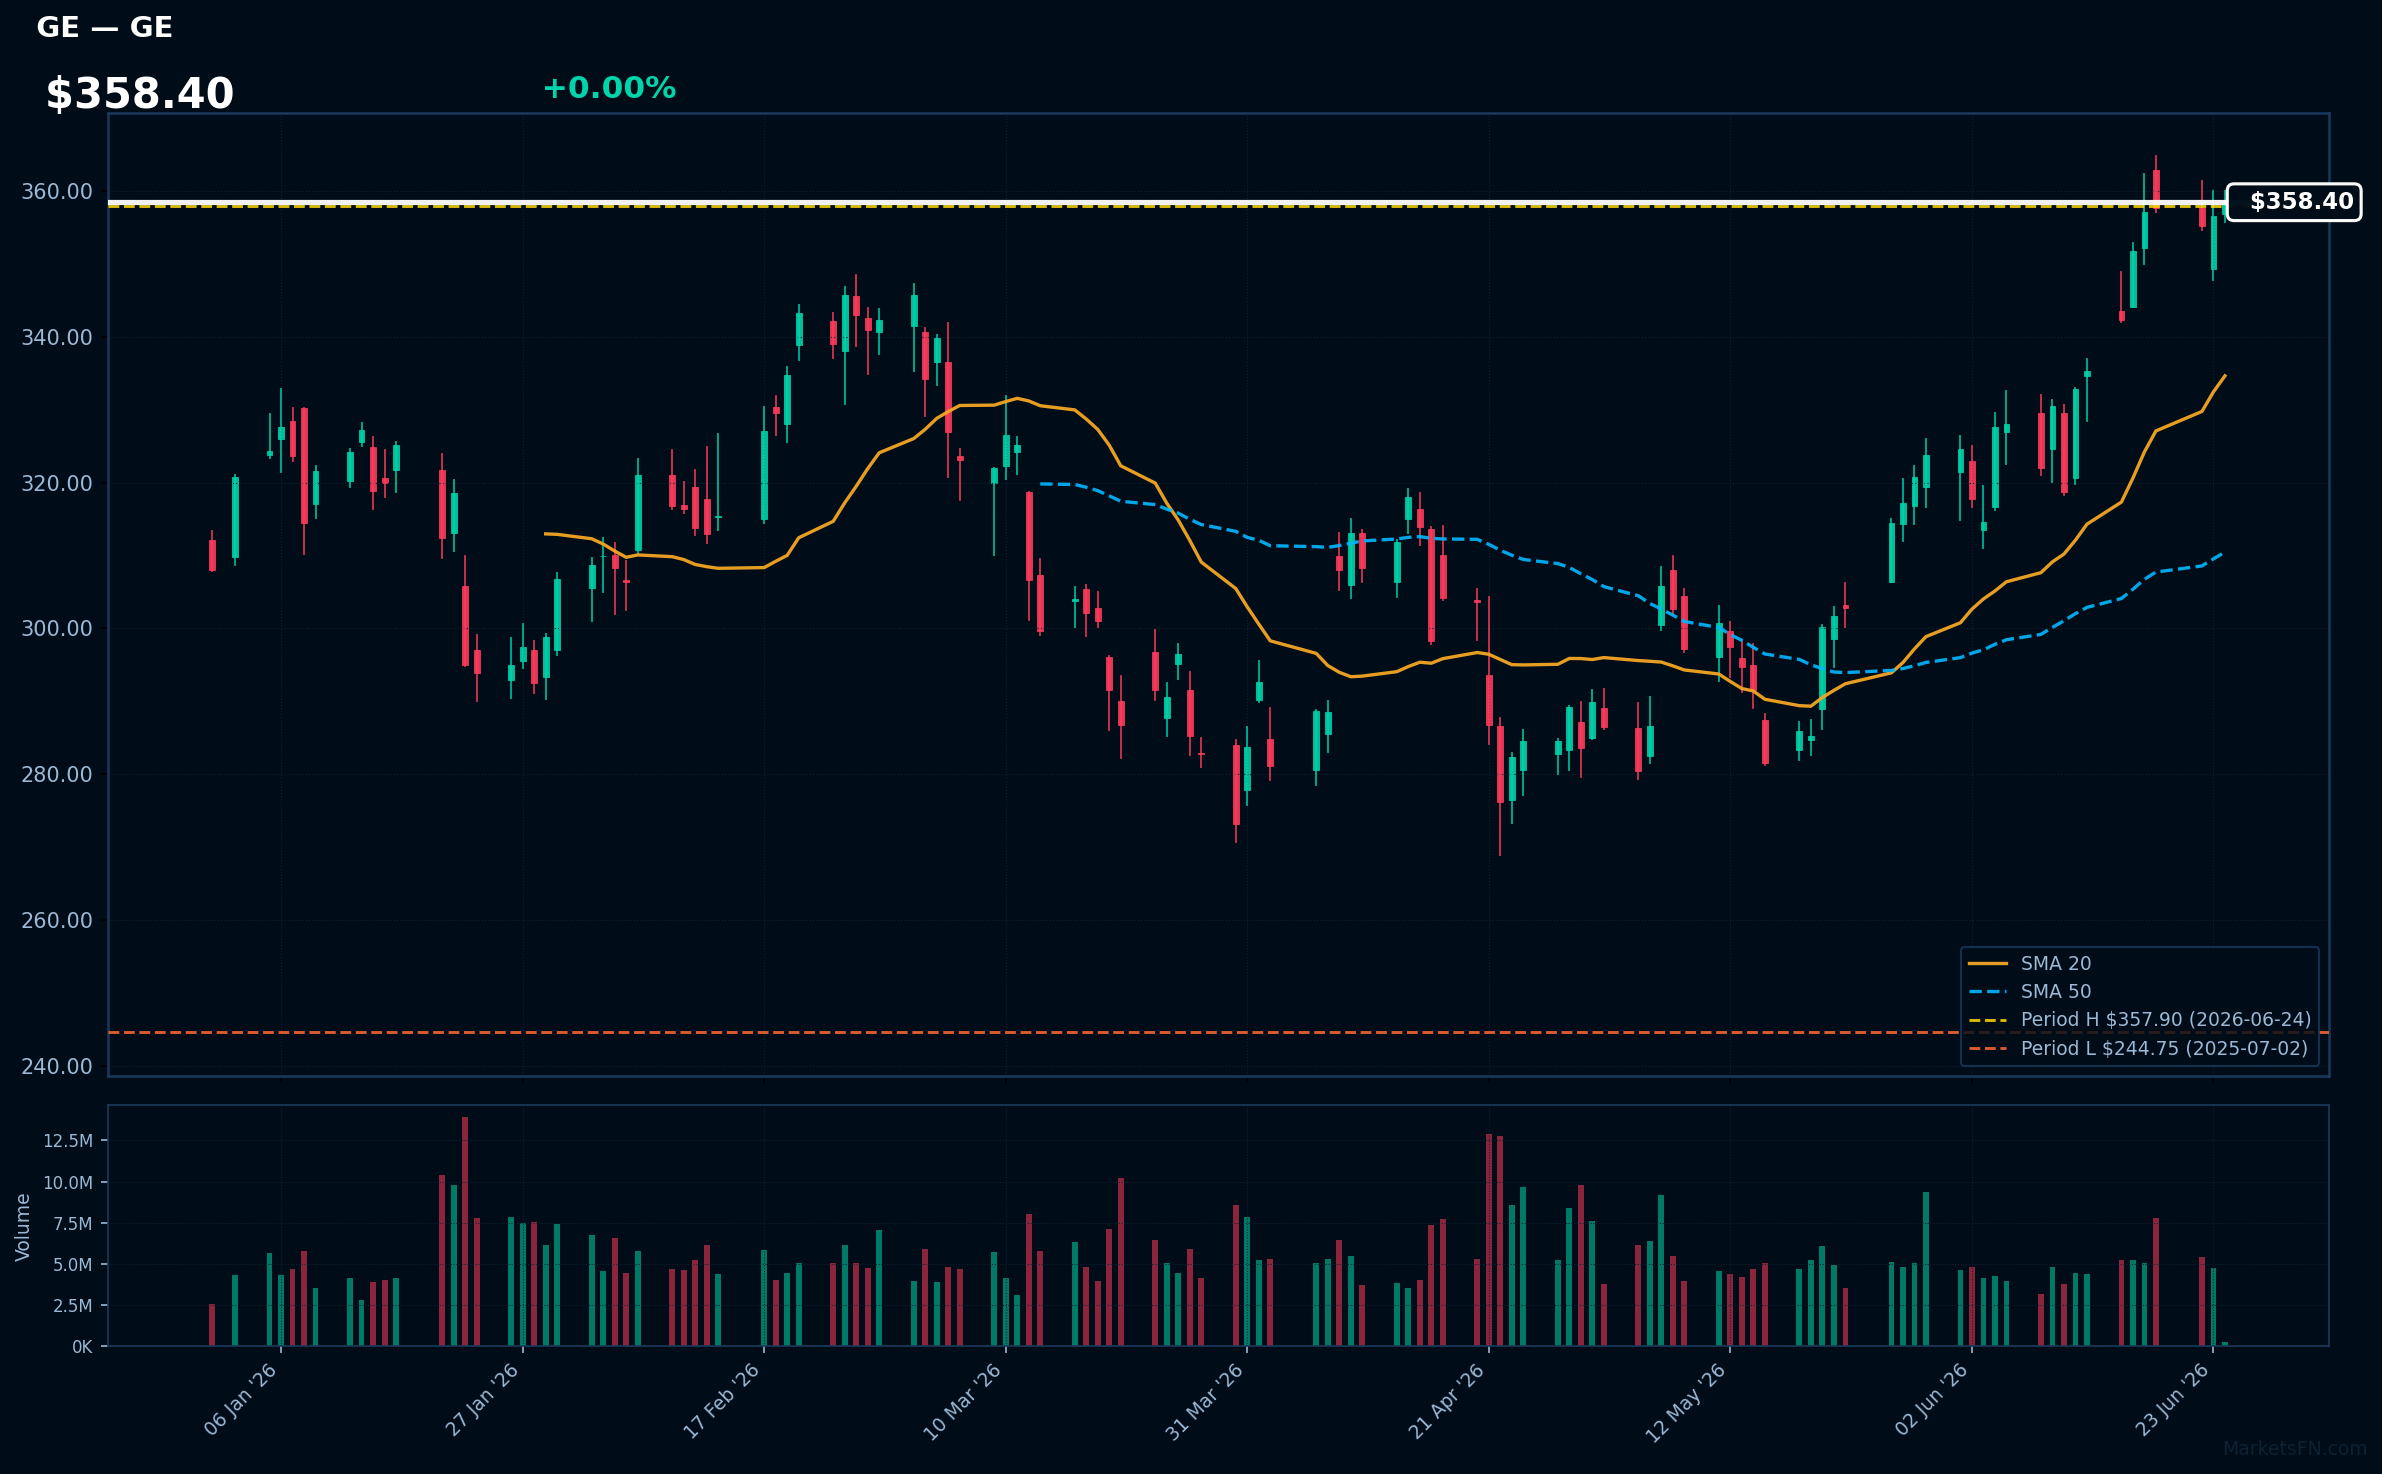
GE | GE Aerospace | Industrials | Price Last: $357.90 | % Realized: +43.88% | RSI: 70.6 | % above MA200: +16.7% | Trend: Above MA20, MA50, MA200
GE Aerospace is a leader in the aerospace industry, manufacturing commercial and military jet engines, and providing related services. Investors should care about its technological advancements, market share, and aftermarket services, which drive revenue and profitability.
GE Aerospace's RSI(14) is 70.6, indicating strong momentum with price > MA20 > MA50 > MA200, a bullish alignment. The stock is 0.0% below its 52-Week high, near a potential breakout, with a 43.9% 52-Week return, suggesting sustained uptrend and potential for further gains.
Related headlines
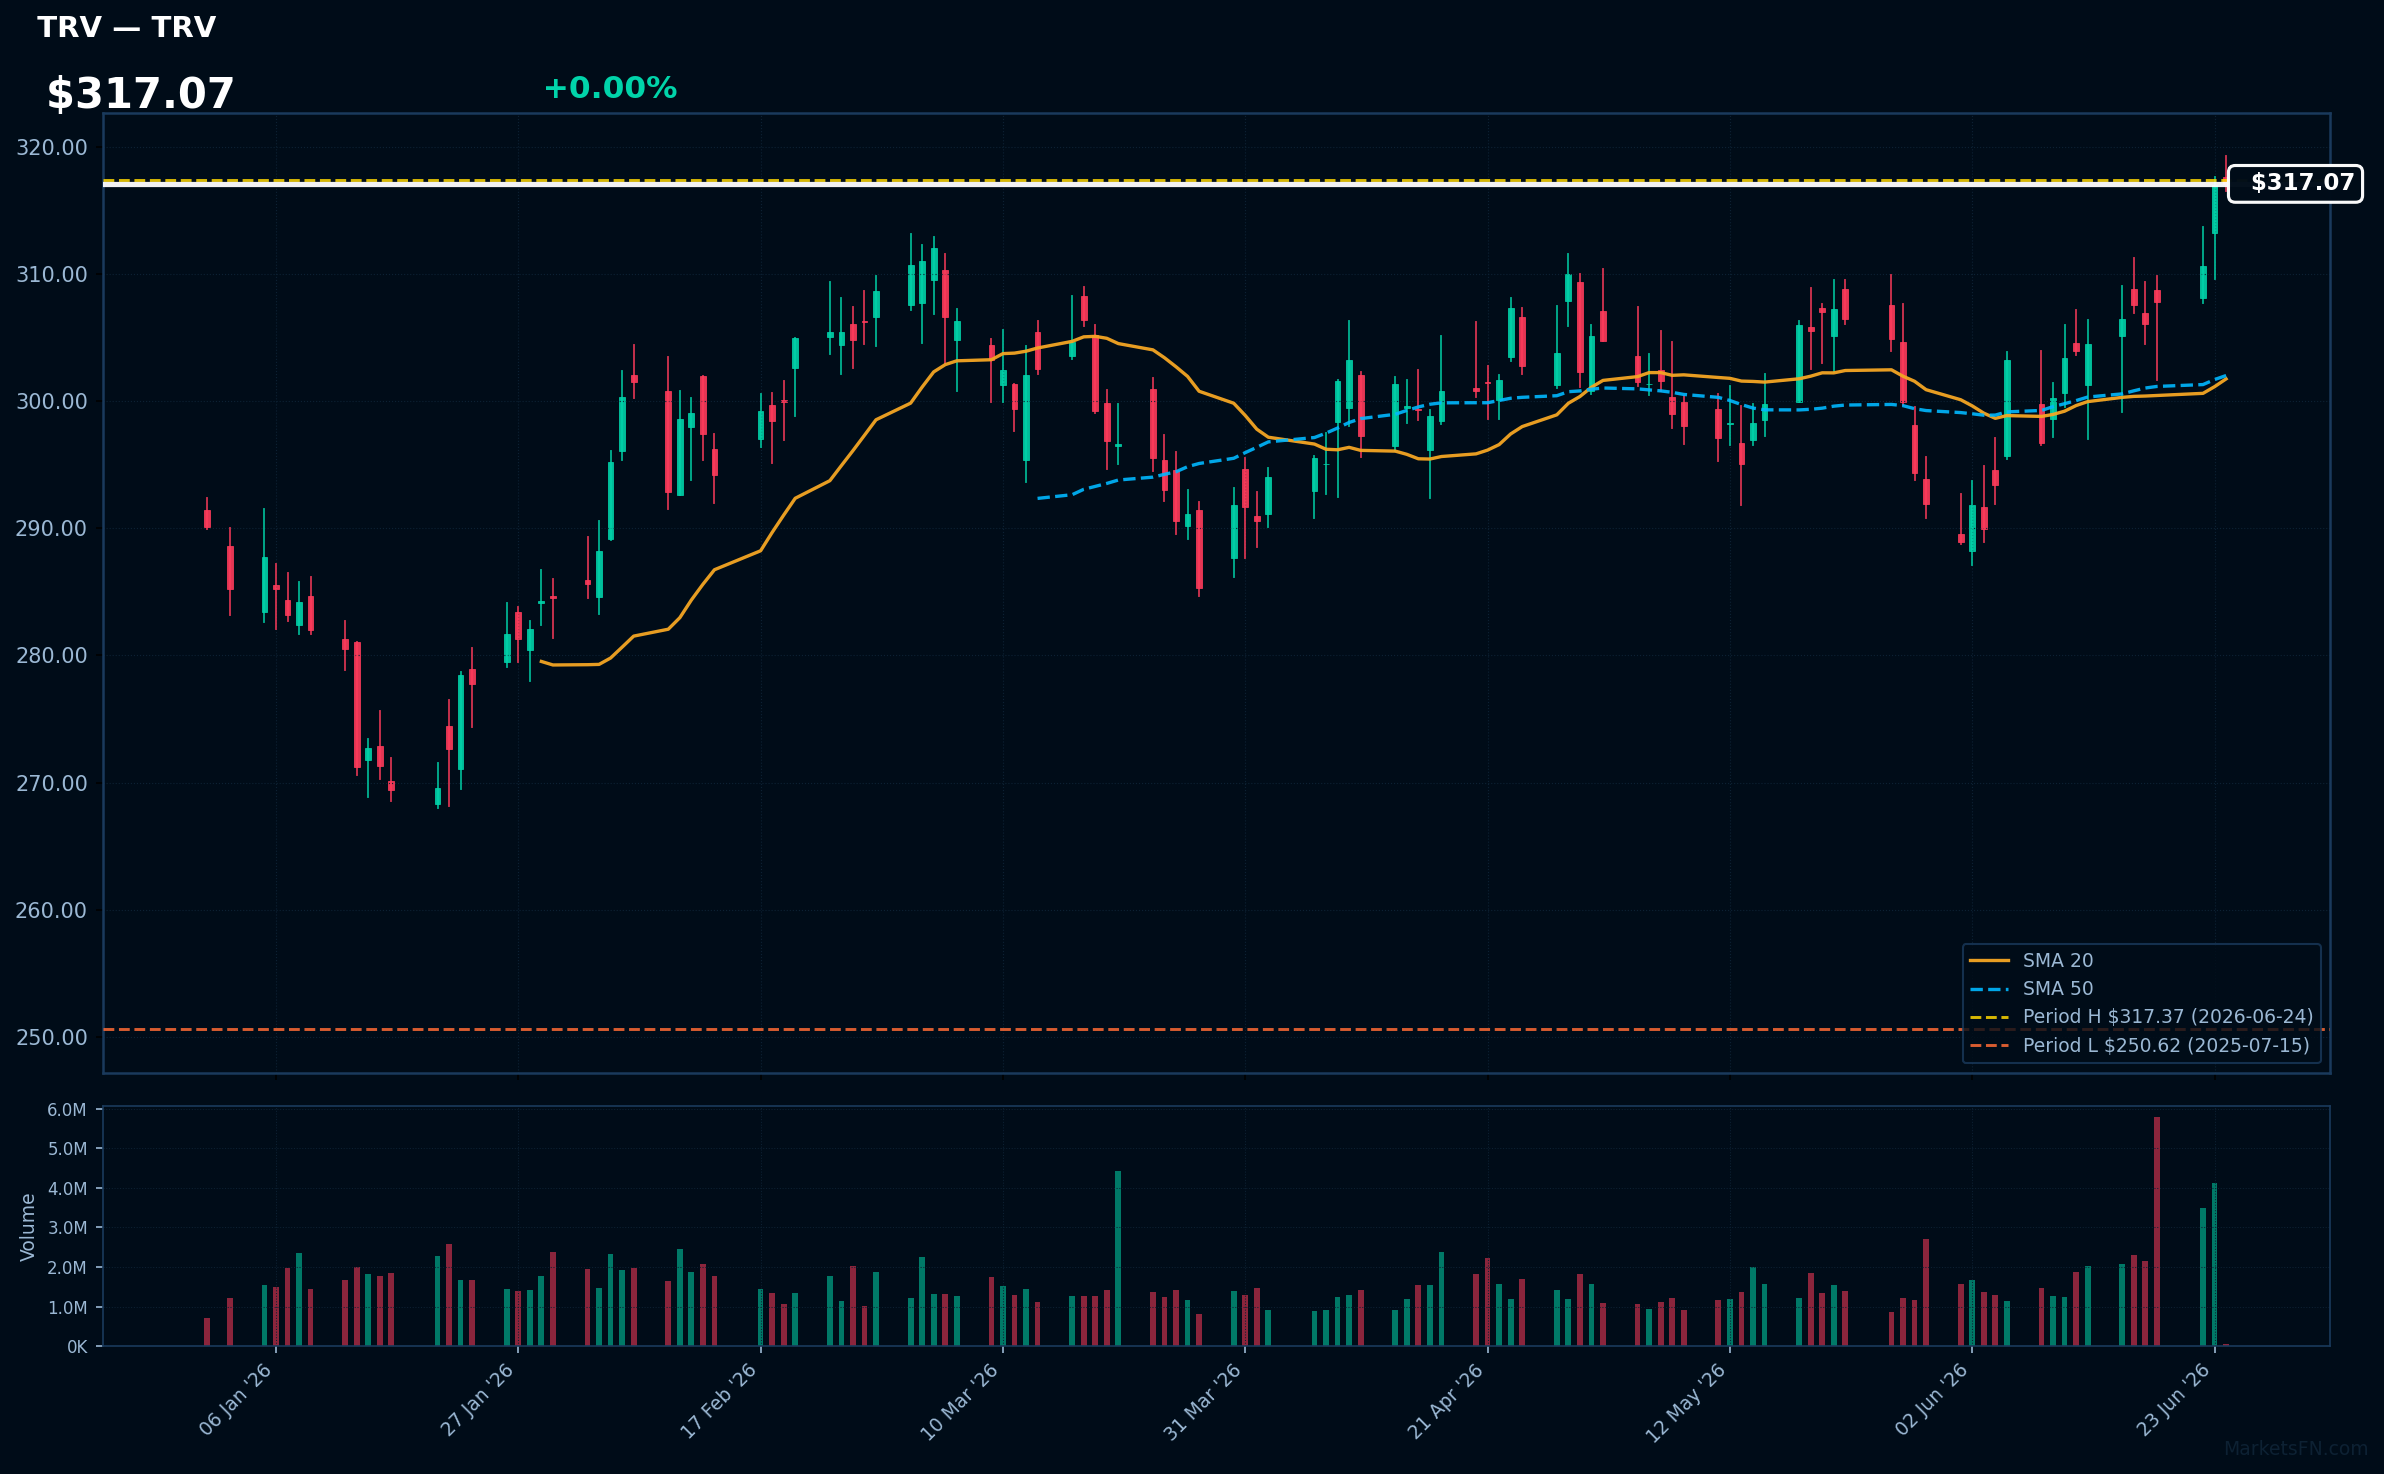
TRV | Travelers Companies Inc | Financial | Price Last: $317.37 | % Realized: +19.25% | RSI: 68.4 | % above MA200: +9.3% | Trend: Above MA20, MA50, MA200
Travelers Companies Inc (TRV) is a property casualty insurer providing various insurance products, including commercial and personal insurance, through independent agencies and brokers. Investors care about its financial performance and risk management due to its exposure to catastrophe risks and market competition.
TRV's RSI(14) is 68.4, indicating rising momentum. The stock is above MA20, MA50, and MA200, showing a strong uptrend. With a 0.0% gap to its 52-Week high and a 19.2% 52-Week return, the stock is near a potential breakout, suggesting continued momentum.
Related headlines
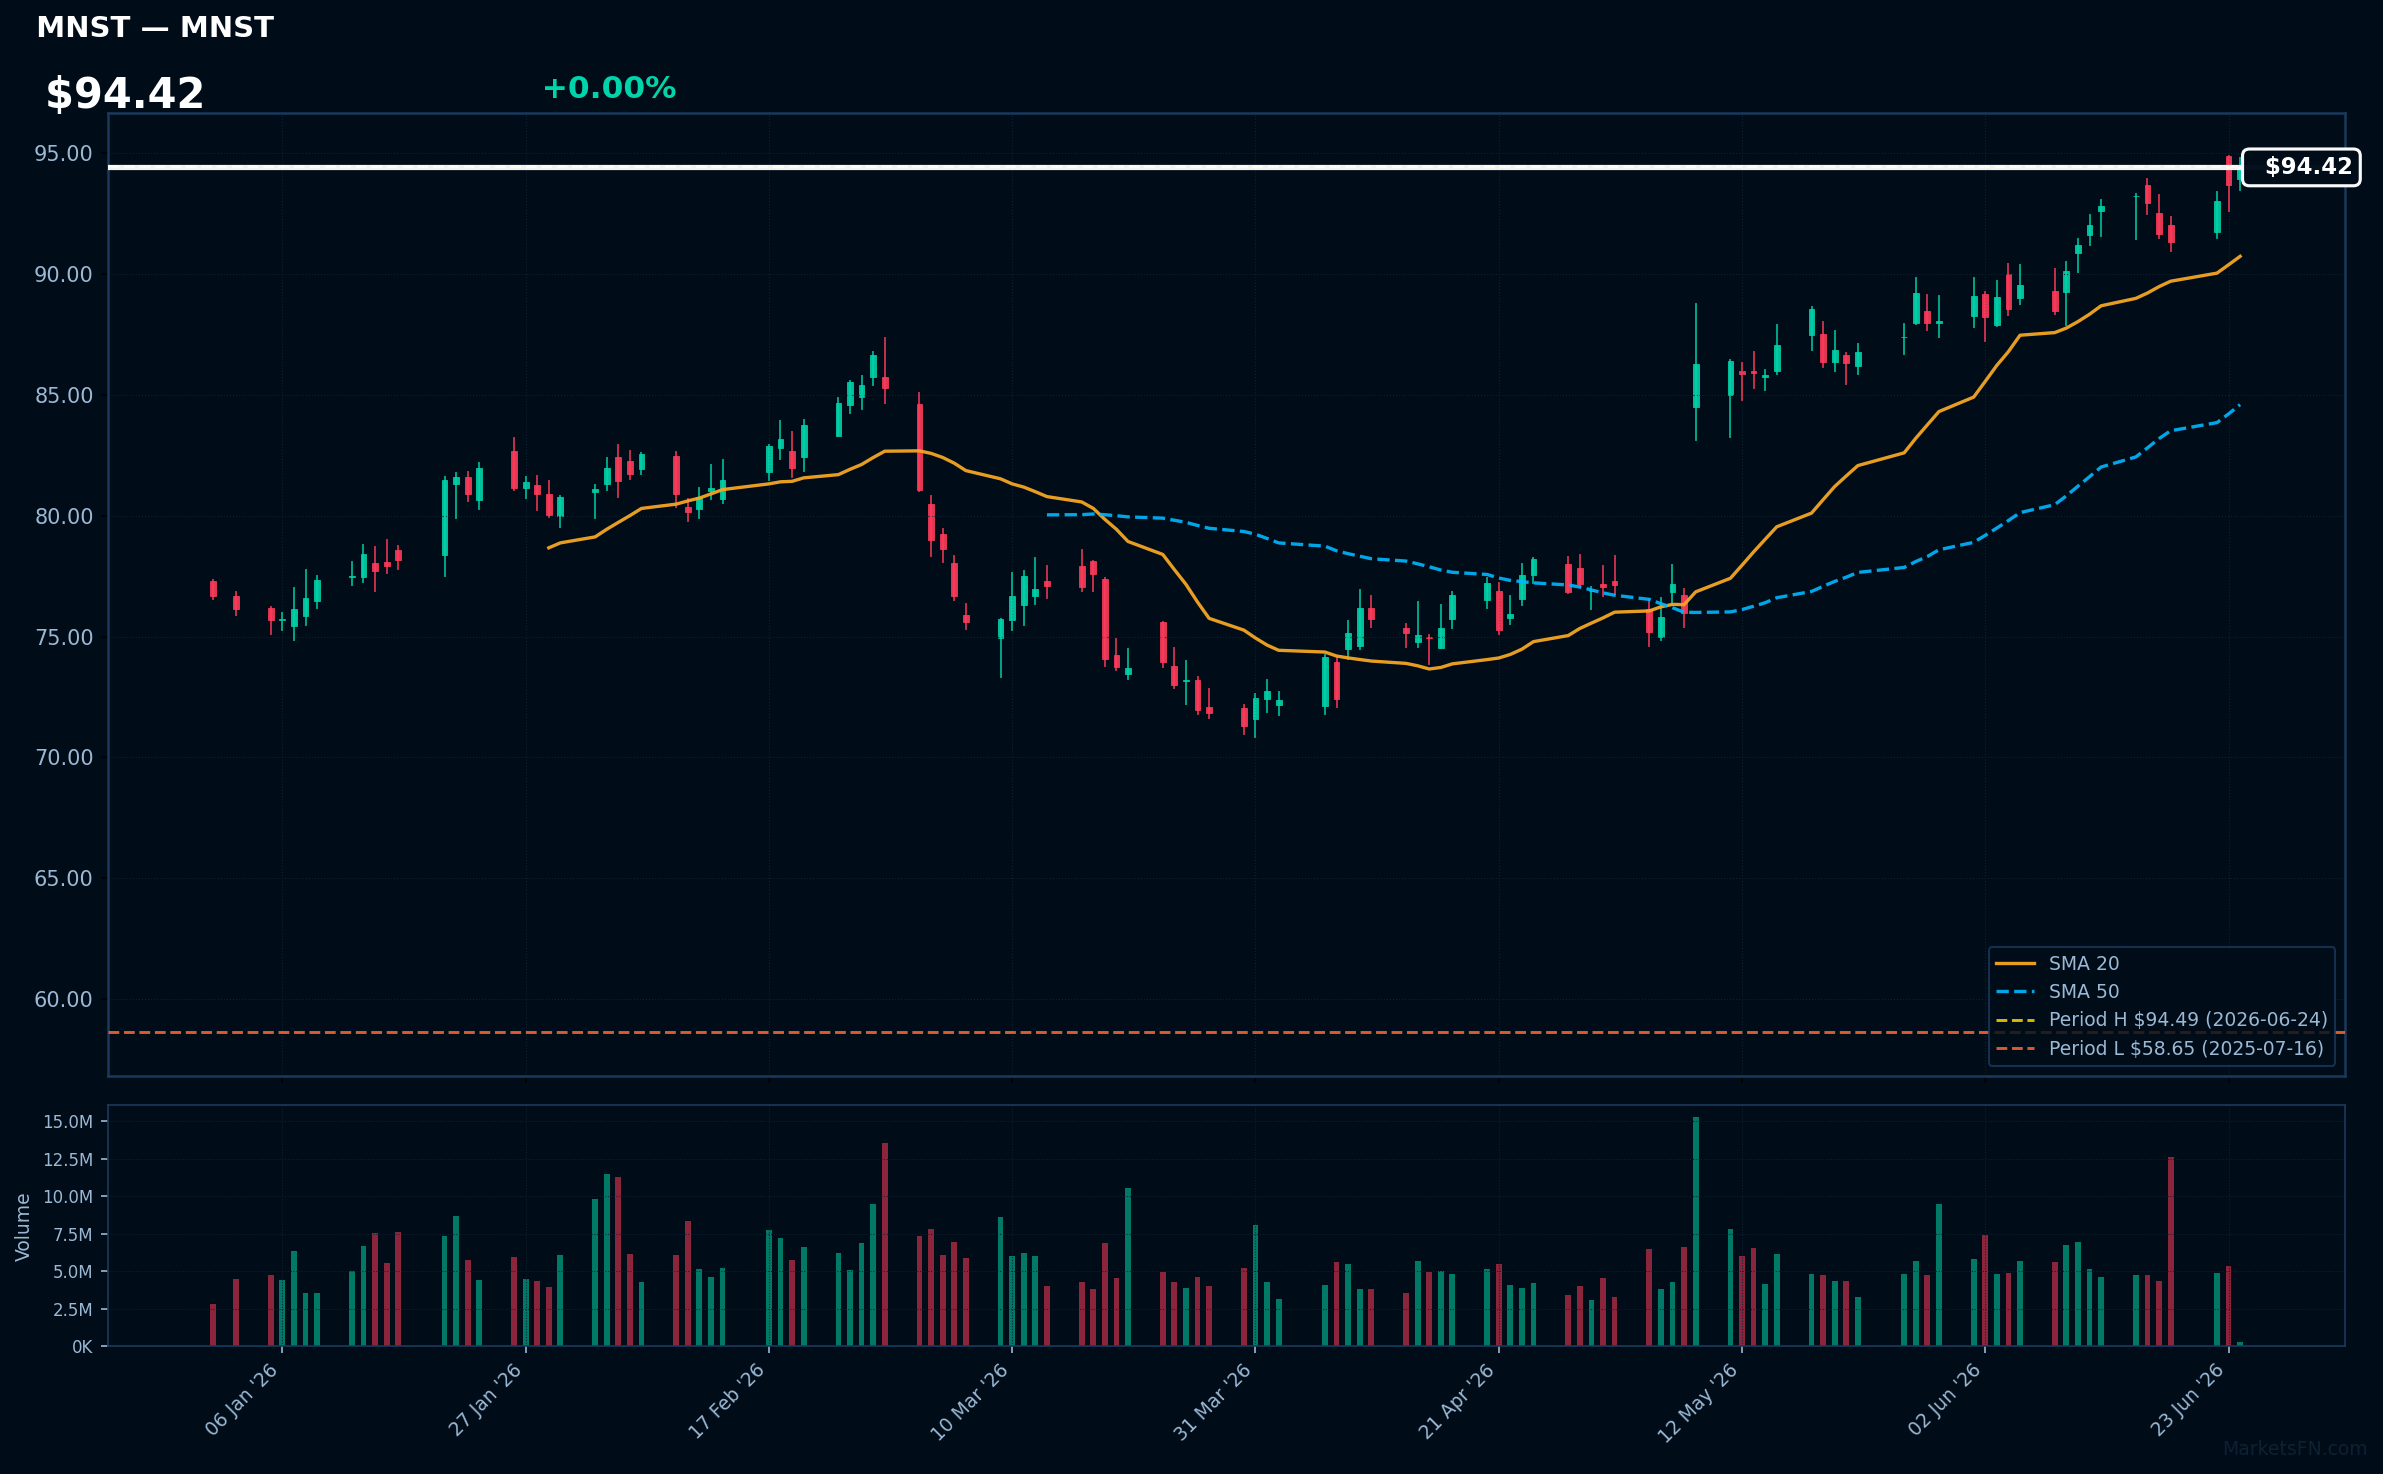
MNST | Monster Beverage Corp | Consumer Defensive | Price Last: $94.49 | % Realized: +48.64% | RSI: 70.5 | % above MA200: +23.4% | Trend: Above MA20, MA50, MA200
Monster Beverage Corp is a leading energy drink manufacturer with popular brands like Monster Energy. Investors should care due to its strong brand portfolio and growth potential in the energy drink market.
The stock shows bullish MA alignment with price > MA20 > MA50 > MA200 and RSI(14) at 70.5, indicating strong momentum; it's near a 52-Week high, 0.0% below, suggesting a potential breakout.
Related headlines
- Massive Gap-Up Propels This Monster To Record High. These Clues Point To More Gains Ahead.
- Monster Beverage Announces Participation in dbAccess Global Consumer Conference 2026
- Dow Jones Leader Amazon, AI Stock Quanta, Monster Beverage In Or Near Buy Zones
- See How Institutions Drive Monster Beverage Shares Higher
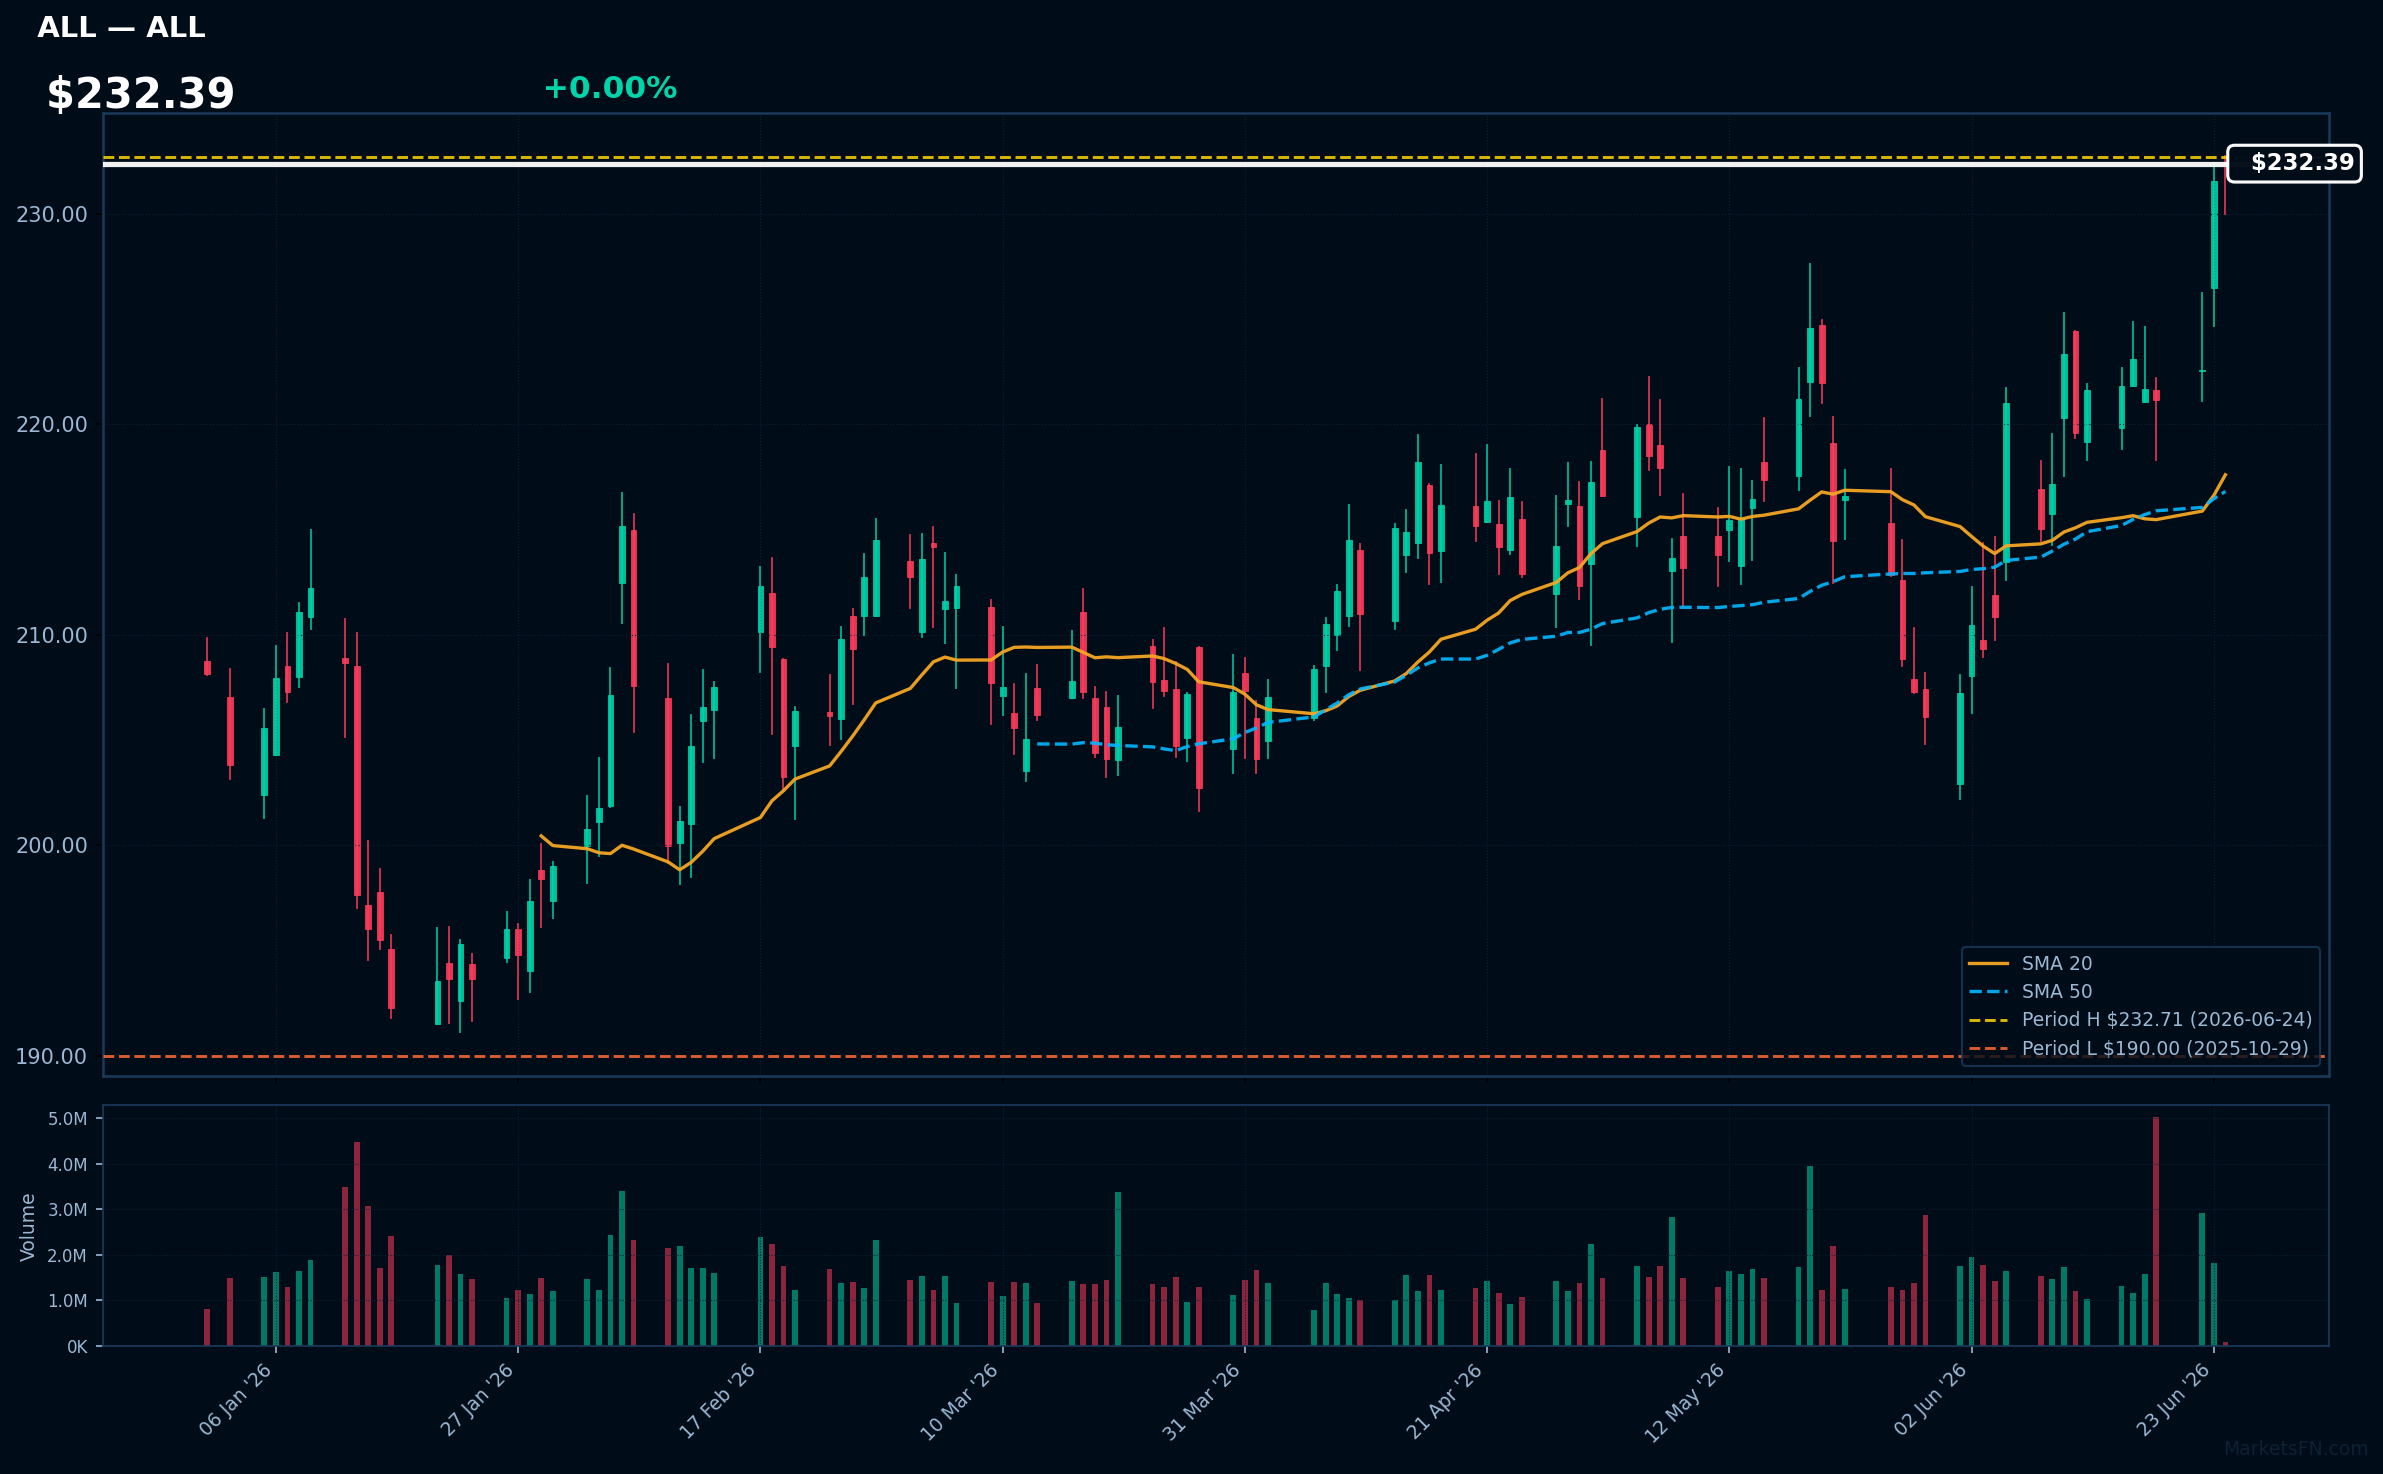
ALL | Allstate Corp | Financial | Price Last: $232.71 | % Realized: +18.70% | RSI: 67.6 | % above MA200: +11.9% | Trend: Above MA20, MA50, MA200
Allstate Corp is a leading personal lines insurer offering auto, home, and life insurance products. Investors should care about its ability to price risk accurately and manage claims effectively, impacting profitability.
Allstate Corp's technicals indicate sustained uptrend with price at $232.39, RSI(14) at 67.6, and MA alignment: price > MA20 > MA50 > MA200. Near its 52-Week high, it shows momentum with 18.7% 52-Week return, but RSI suggests not overbought.
Related headlines
- Cerebras initiated, Crocs upgraded: Wall Street's top analyst calls
- Allstate announces quarterly dividends payable in July 2026
- University of Virginia coxswain and volunteer firefighter and EMT Shelby Bavin named captain of the Allstate NACDA Spring Good Works Team
- The Allstate Corporation Q1 2026 Earnings Call Summary
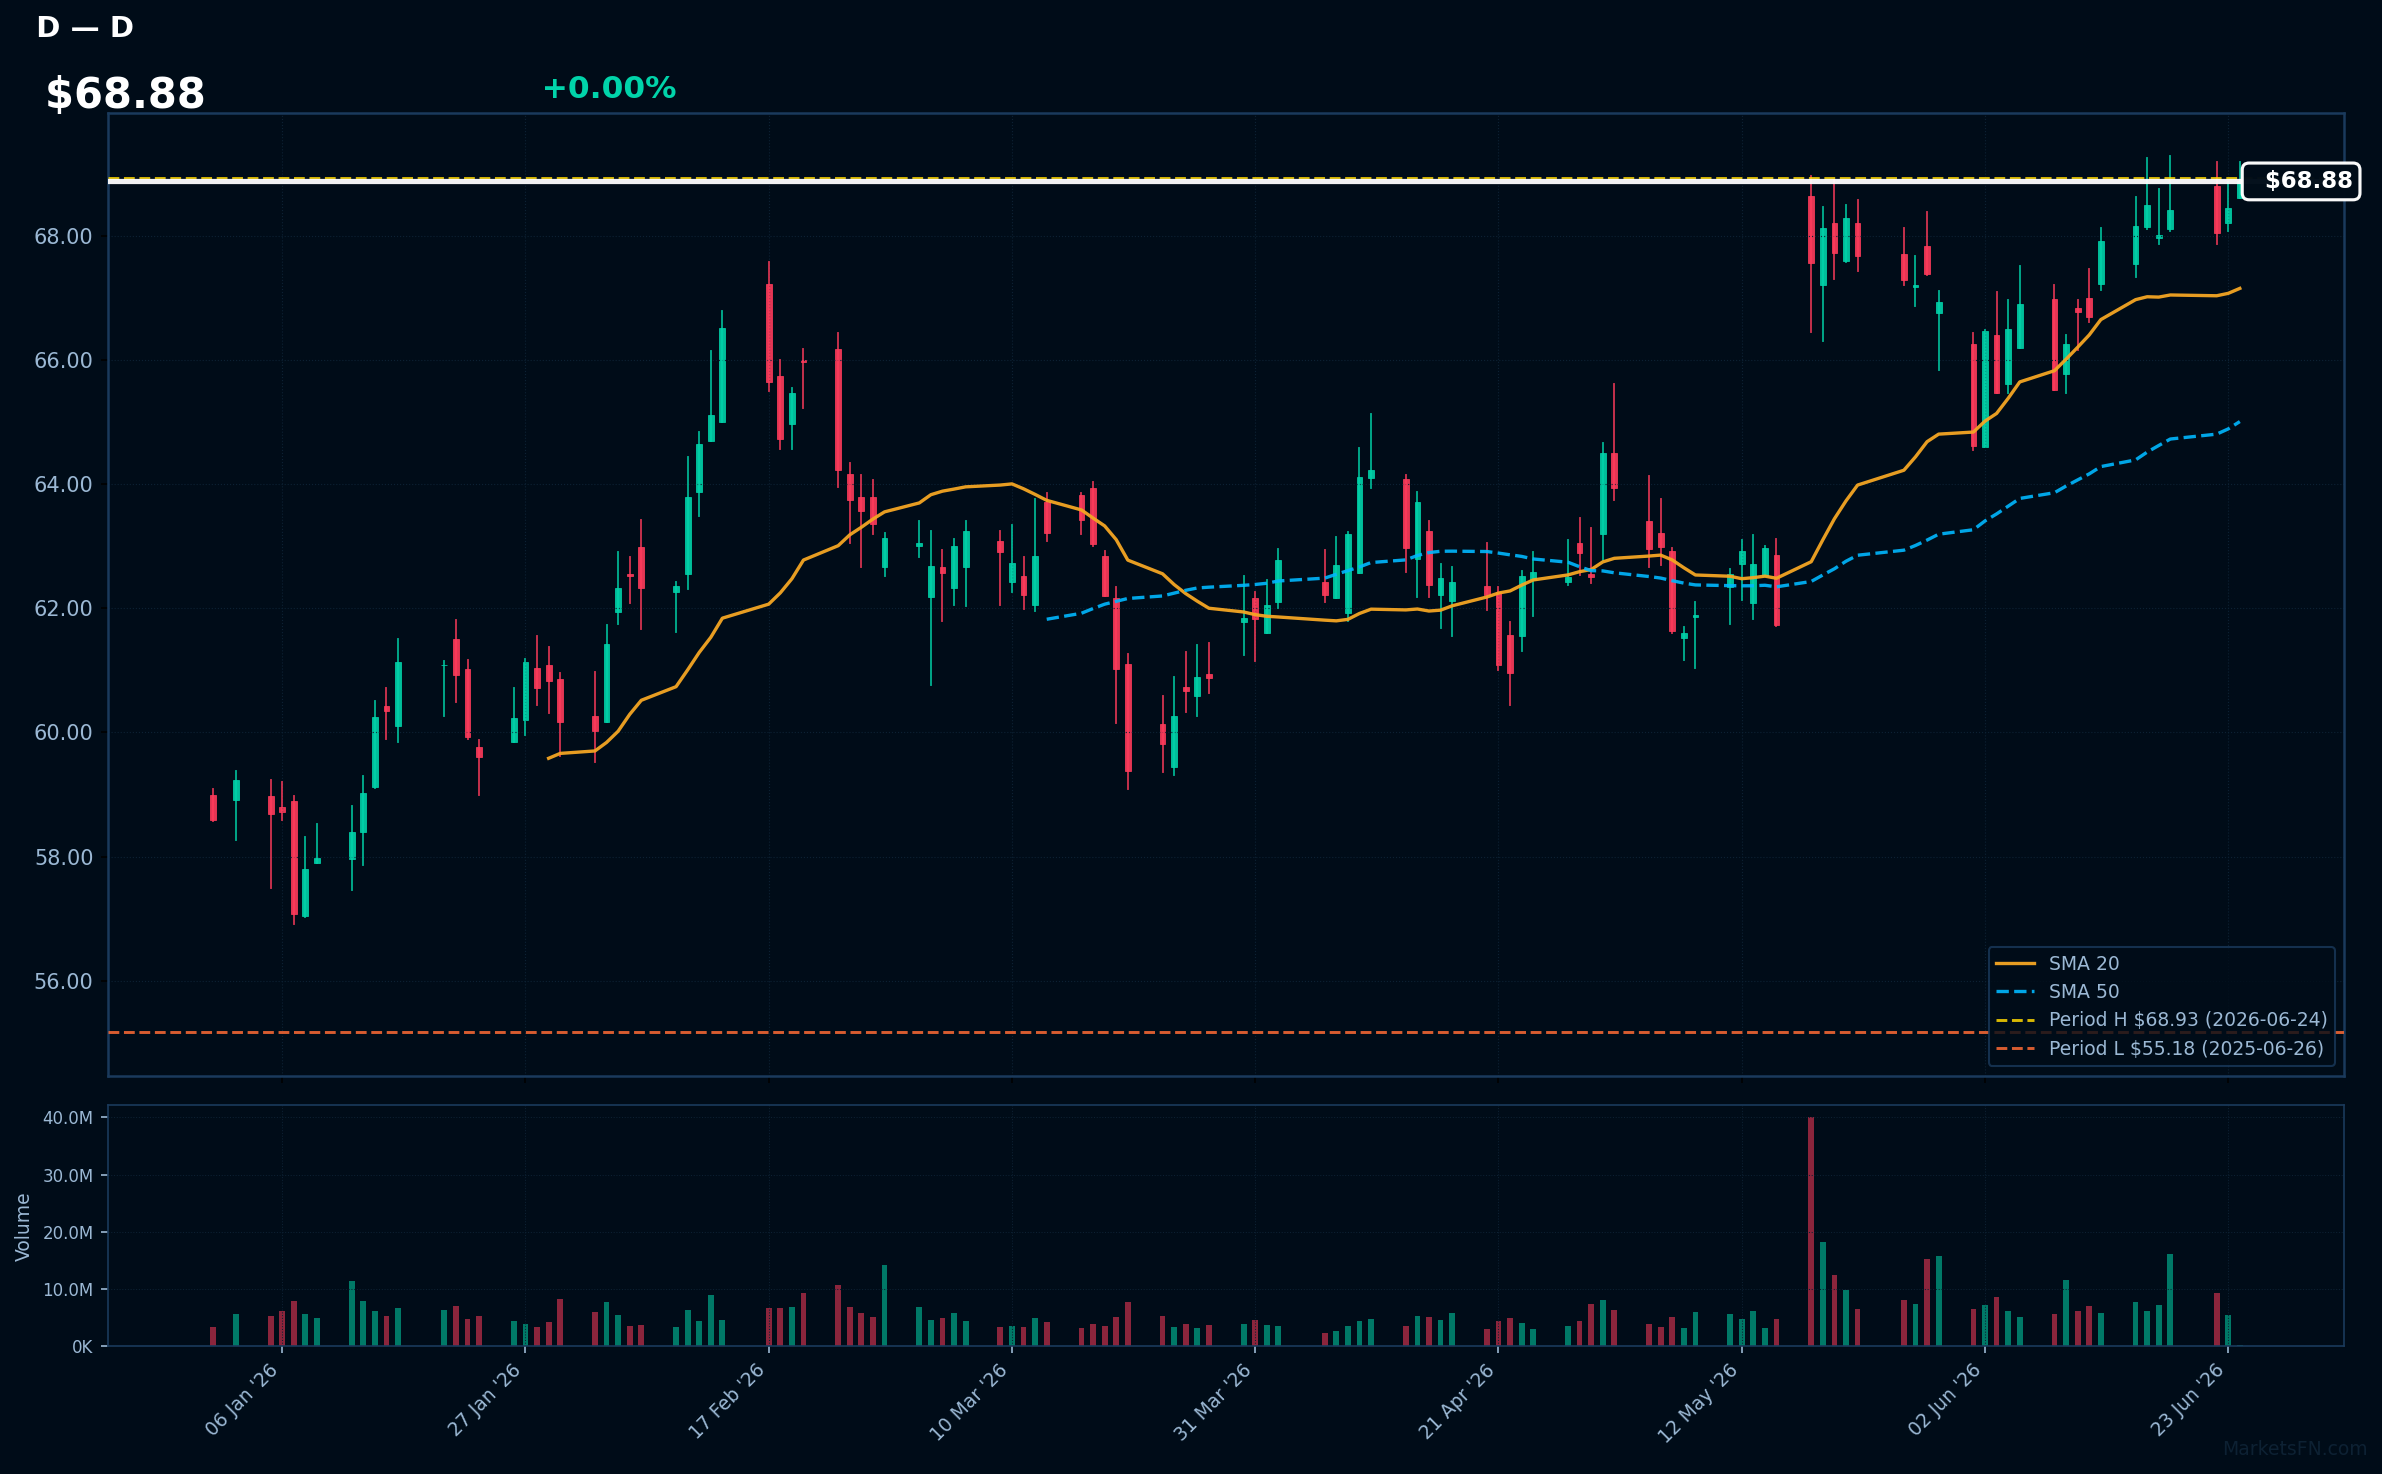
D | Dominion Energy Inc | Utilities | Price Last: $68.93 | % Realized: +23.14% | RSI: 62.1 | % above MA200: +11.2% | Trend: Above MA20, MA50, MA200
Dominion Energy Inc is a utility company that generates and distributes electricity and natural gas. Investors should care because its stable cash flows and dividend yield can provide a defensive component to a portfolio, especially during economic downturns.
Dominion Energy Inc is in a sustained uptrend with price > MA20 > MA50 > MA200, and an RSI(14) of 62.1, indicating momentum. The stock is 0.0% below its 52-Week high, near a potential breakout level, with a 23.1% return over the 52-Week period.
Related headlines
- U.S. Bets Billions of Dollars in Low-Cost Loans Can Revive Nuclear Power
- NextEra to pay $150M to settle charges related to Florida political misconduct allegations
- NextEra agrees to pay $150M to settle charges officials lied about Florida political misconduct
- Dominion to buy land for North Carolina offshore wind project
📉 Nearest to 52-Week Low
Sectors represented: Financial (2), Consumer Cyclical (1), Communication Services (1), Technology (1)
| Ticker | Company | Sector | Price Last | % Realized | 52-Week Low Date | RSI | % above MA200 | Trend |
|---|---|---|---|---|---|---|---|---|
| CME | CME Group Inc | Financial | $240.70 | -11.31% | 2026-06-24 | 29.4 | -14.4% | Below MA20, MA50, MA200 |
| NKE | Nike, Inc | Consumer Cyclical | $42.03 | -31.58% | 2026-05-15 | 39.0 | -27.9% | Below MA20, MA50, MA200 |
| NFLX | Netflix Inc | Communication Services | $73.09 | -42.86% | 2026-06-23 | 21.5 | -25.1% | Below MA20, MA50, MA200 |
| ICE | Intercontinental Exchange Inc | Financial | $131.88 | -27.07% | 2026-06-22 | 29.3 | -16.8% | Below MA20, MA50, MA200 |
| PLTR | Palantir Technologies Inc | Technology | $117.69 | -17.83% | 2026-06-23 | 33.7 | -26.1% | Below MA20, MA50, MA200 |
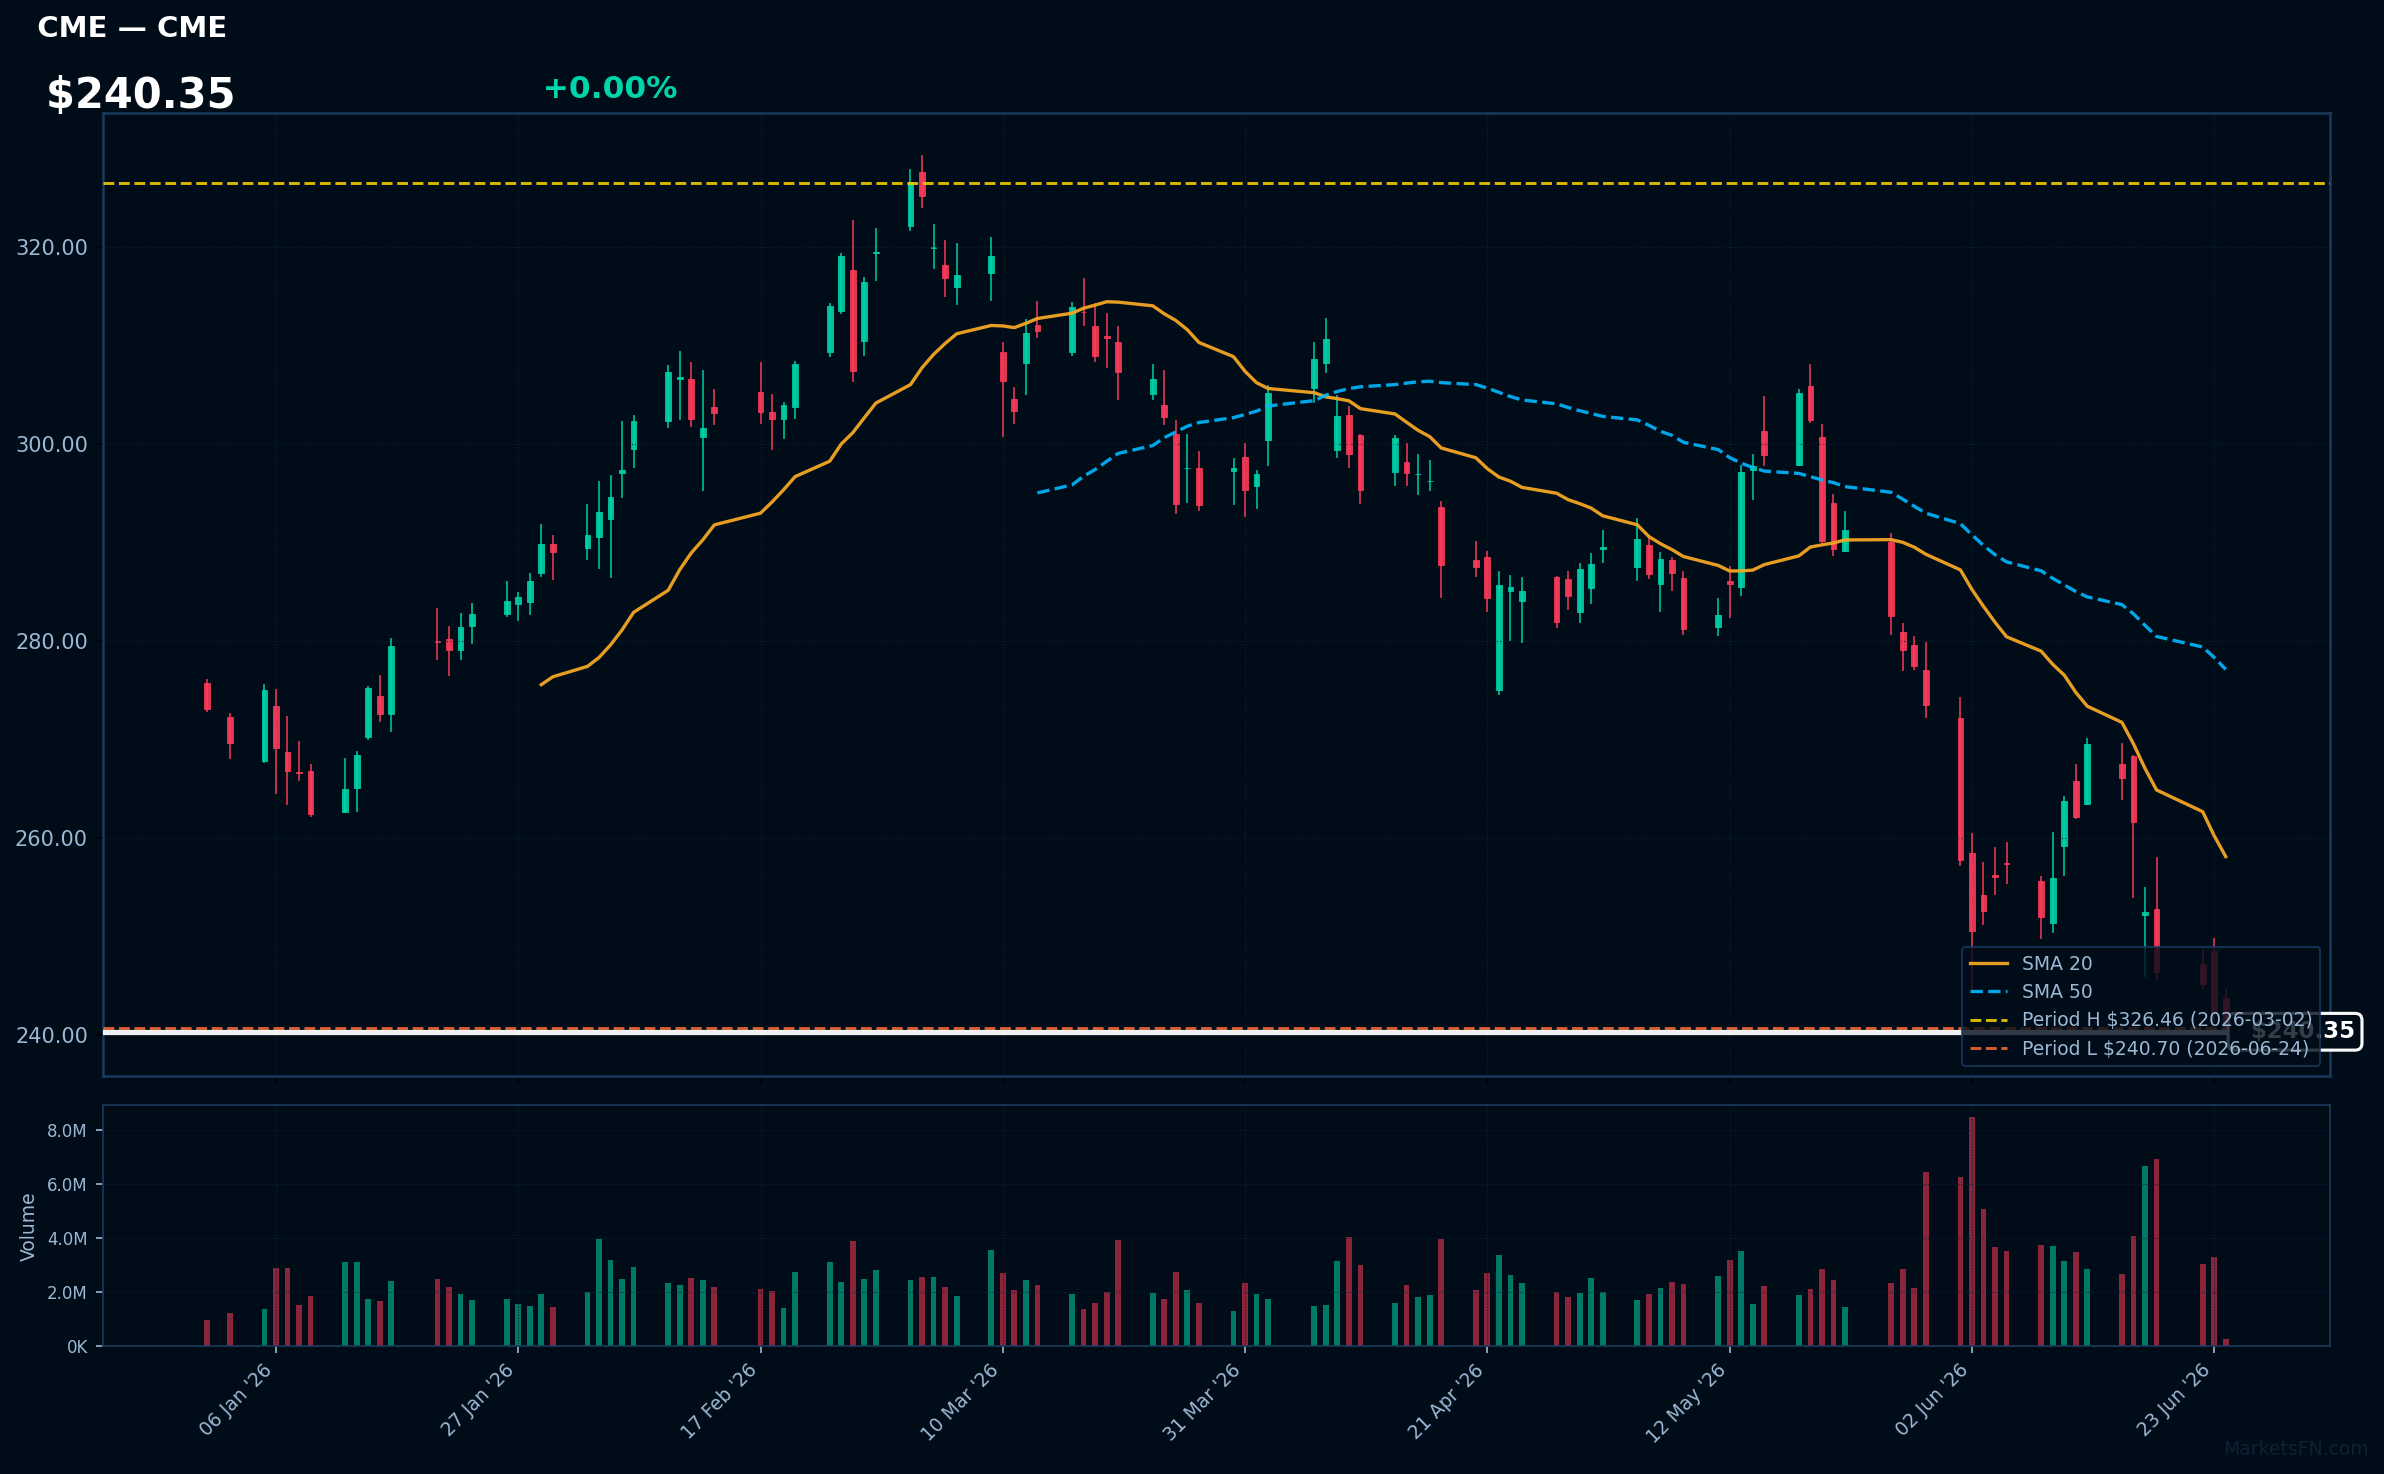
CME | CME Group Inc | Financial | Price Last: $240.70 | % Realized: -11.31% | RSI: 29.4 | % above MA200: -14.4% | Trend: Below MA20, MA50, MA200
CME Group Inc operates global derivatives markets, facilitating risk management and price discovery for commodities, interest rates, and equities; investors care due to its critical role in hedging and speculation, influencing financial markets' stability and liquidity.
CME is in a sustained downtrend with price ($240.35) below MA20, MA50, and MA200; RSI(14) at 29.4 indicates oversold conditions, and being 0.0% above its 52-Week low suggests testing major support, potentially a warning sign for further decline.
Related headlines
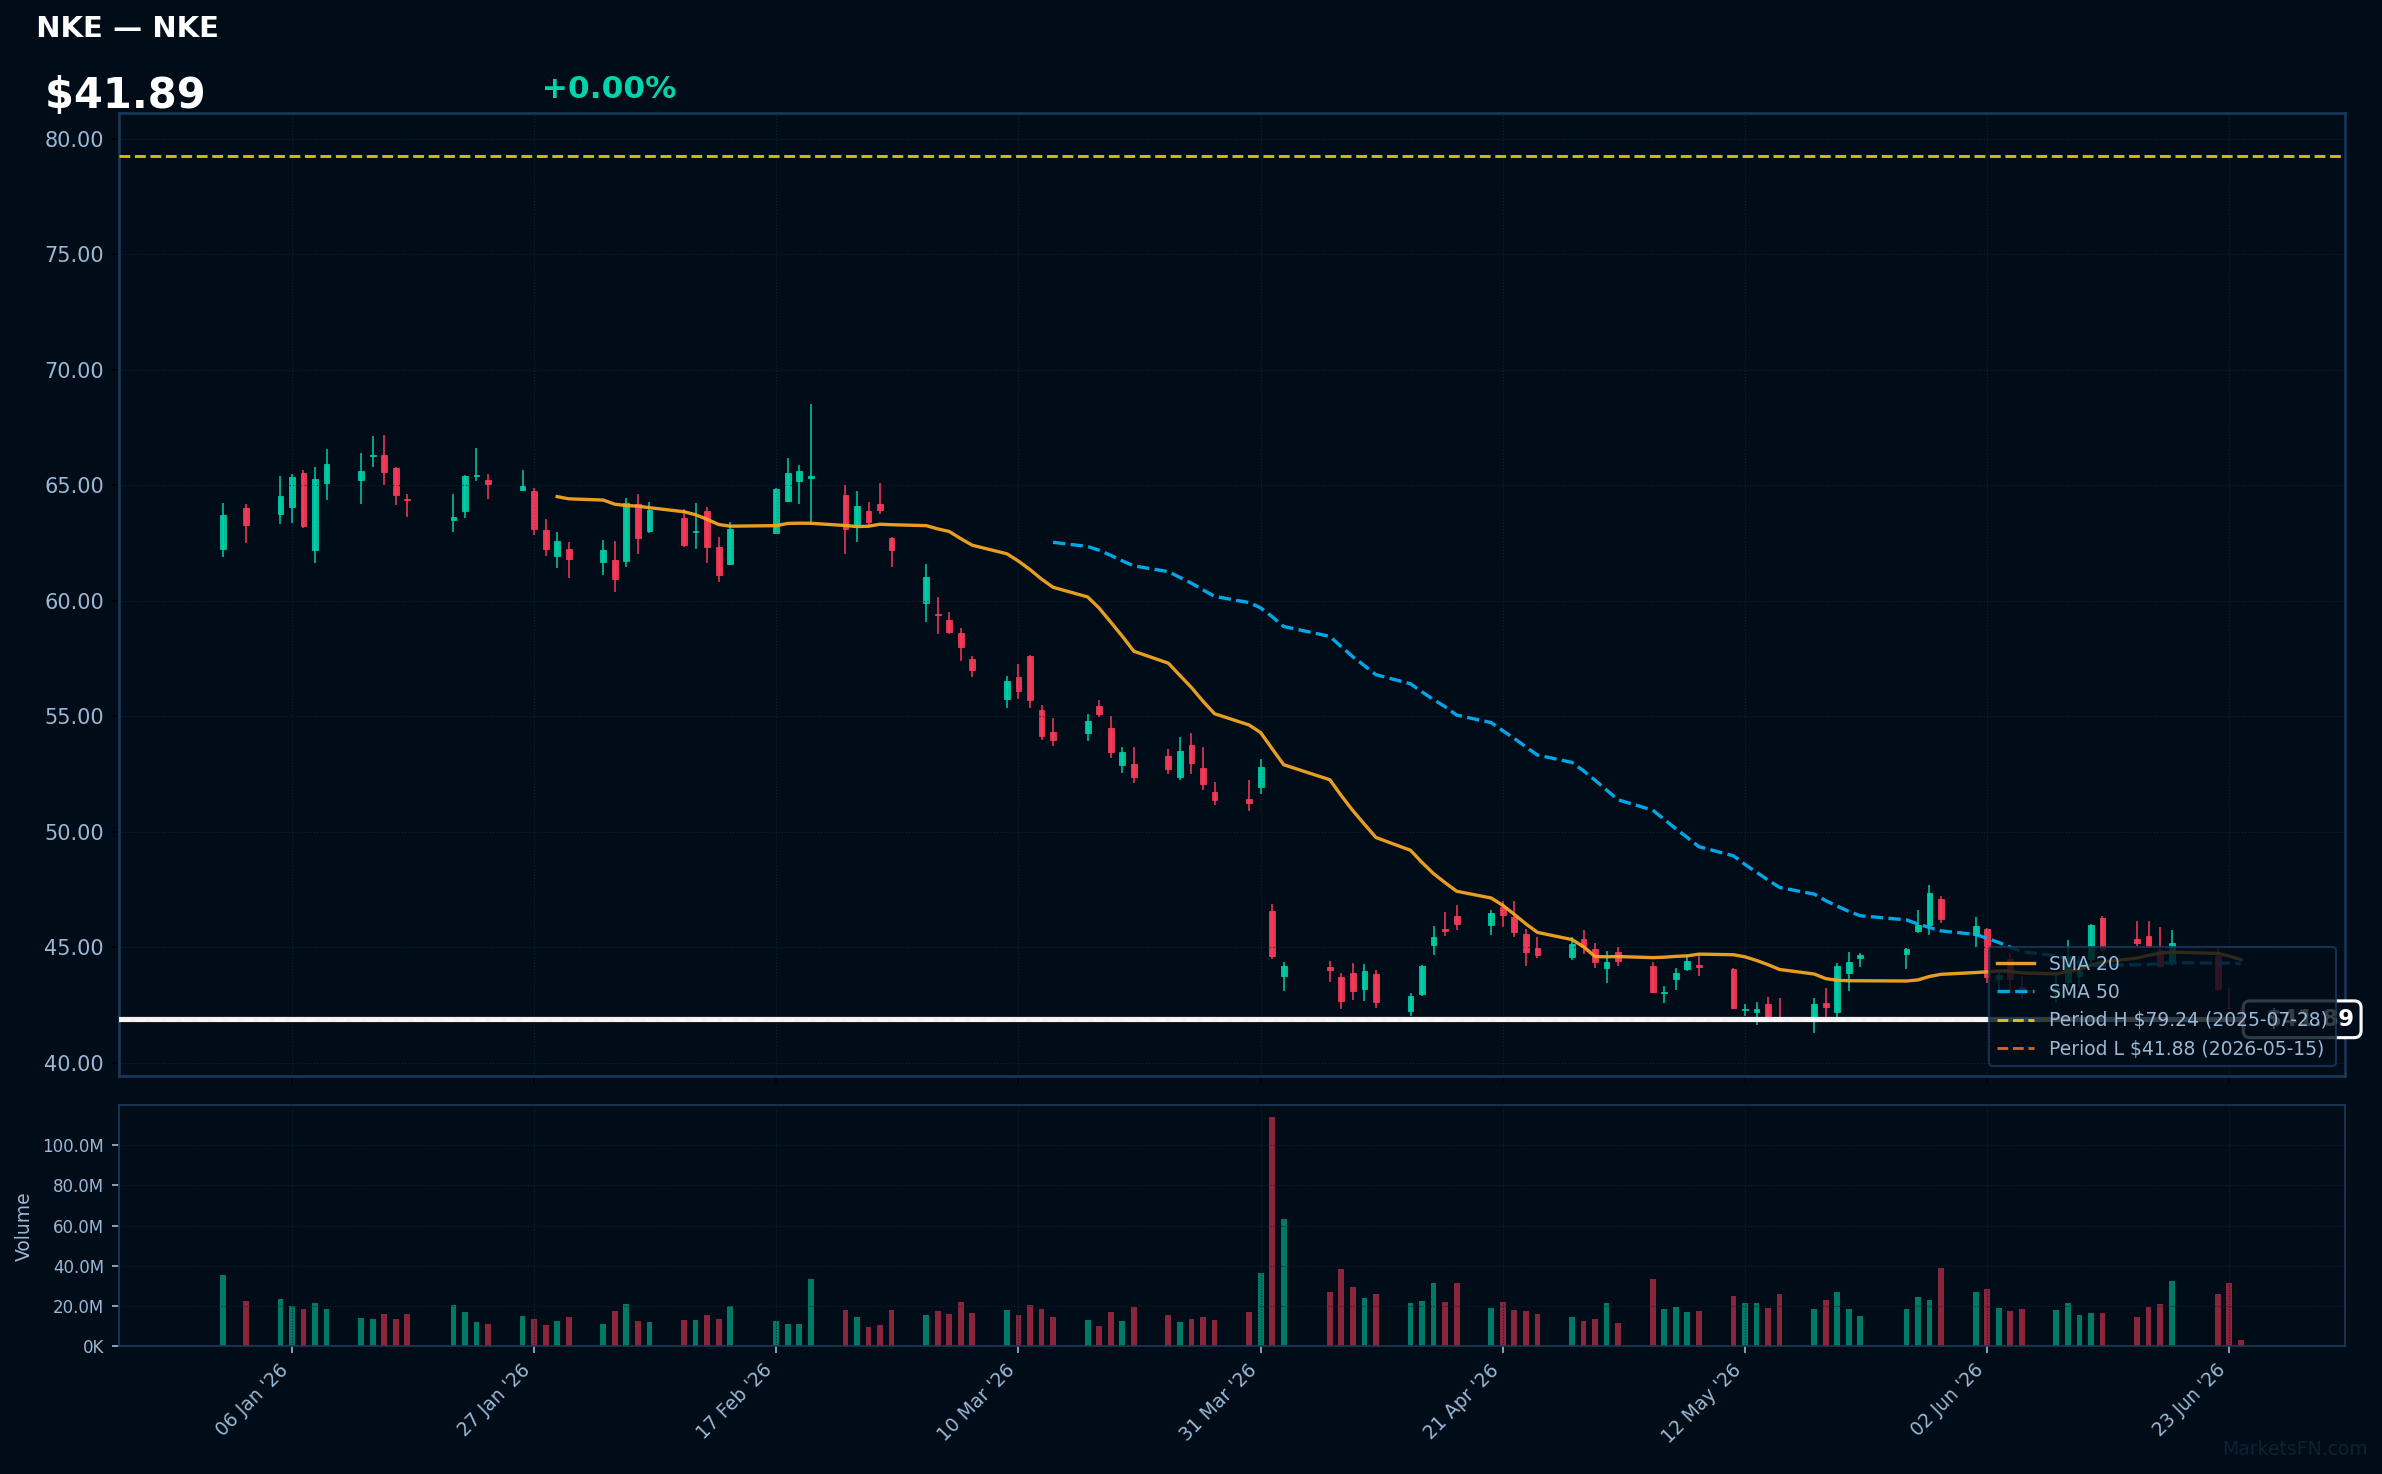
NKE | Nike, Inc | Consumer Cyclical | Price Last: $42.03 | % Realized: -31.58% | RSI: 39.0 | % above MA200: -27.9% | Trend: Below MA20, MA50, MA200
Nike, Inc designs and sells athletic footwear, apparel, and equipment. Investors should care about its brand strength, product innovation, and global distribution network, which drive revenue growth and profitability.
Nike's technicals indicate a warning sign: RSI(14) is 39.0, below MA20/MA50/MA200, and the stock is 0.3% above its 52-Week low, suggesting major support is being tested after a -31.6% 52-Week return.
Related headlines
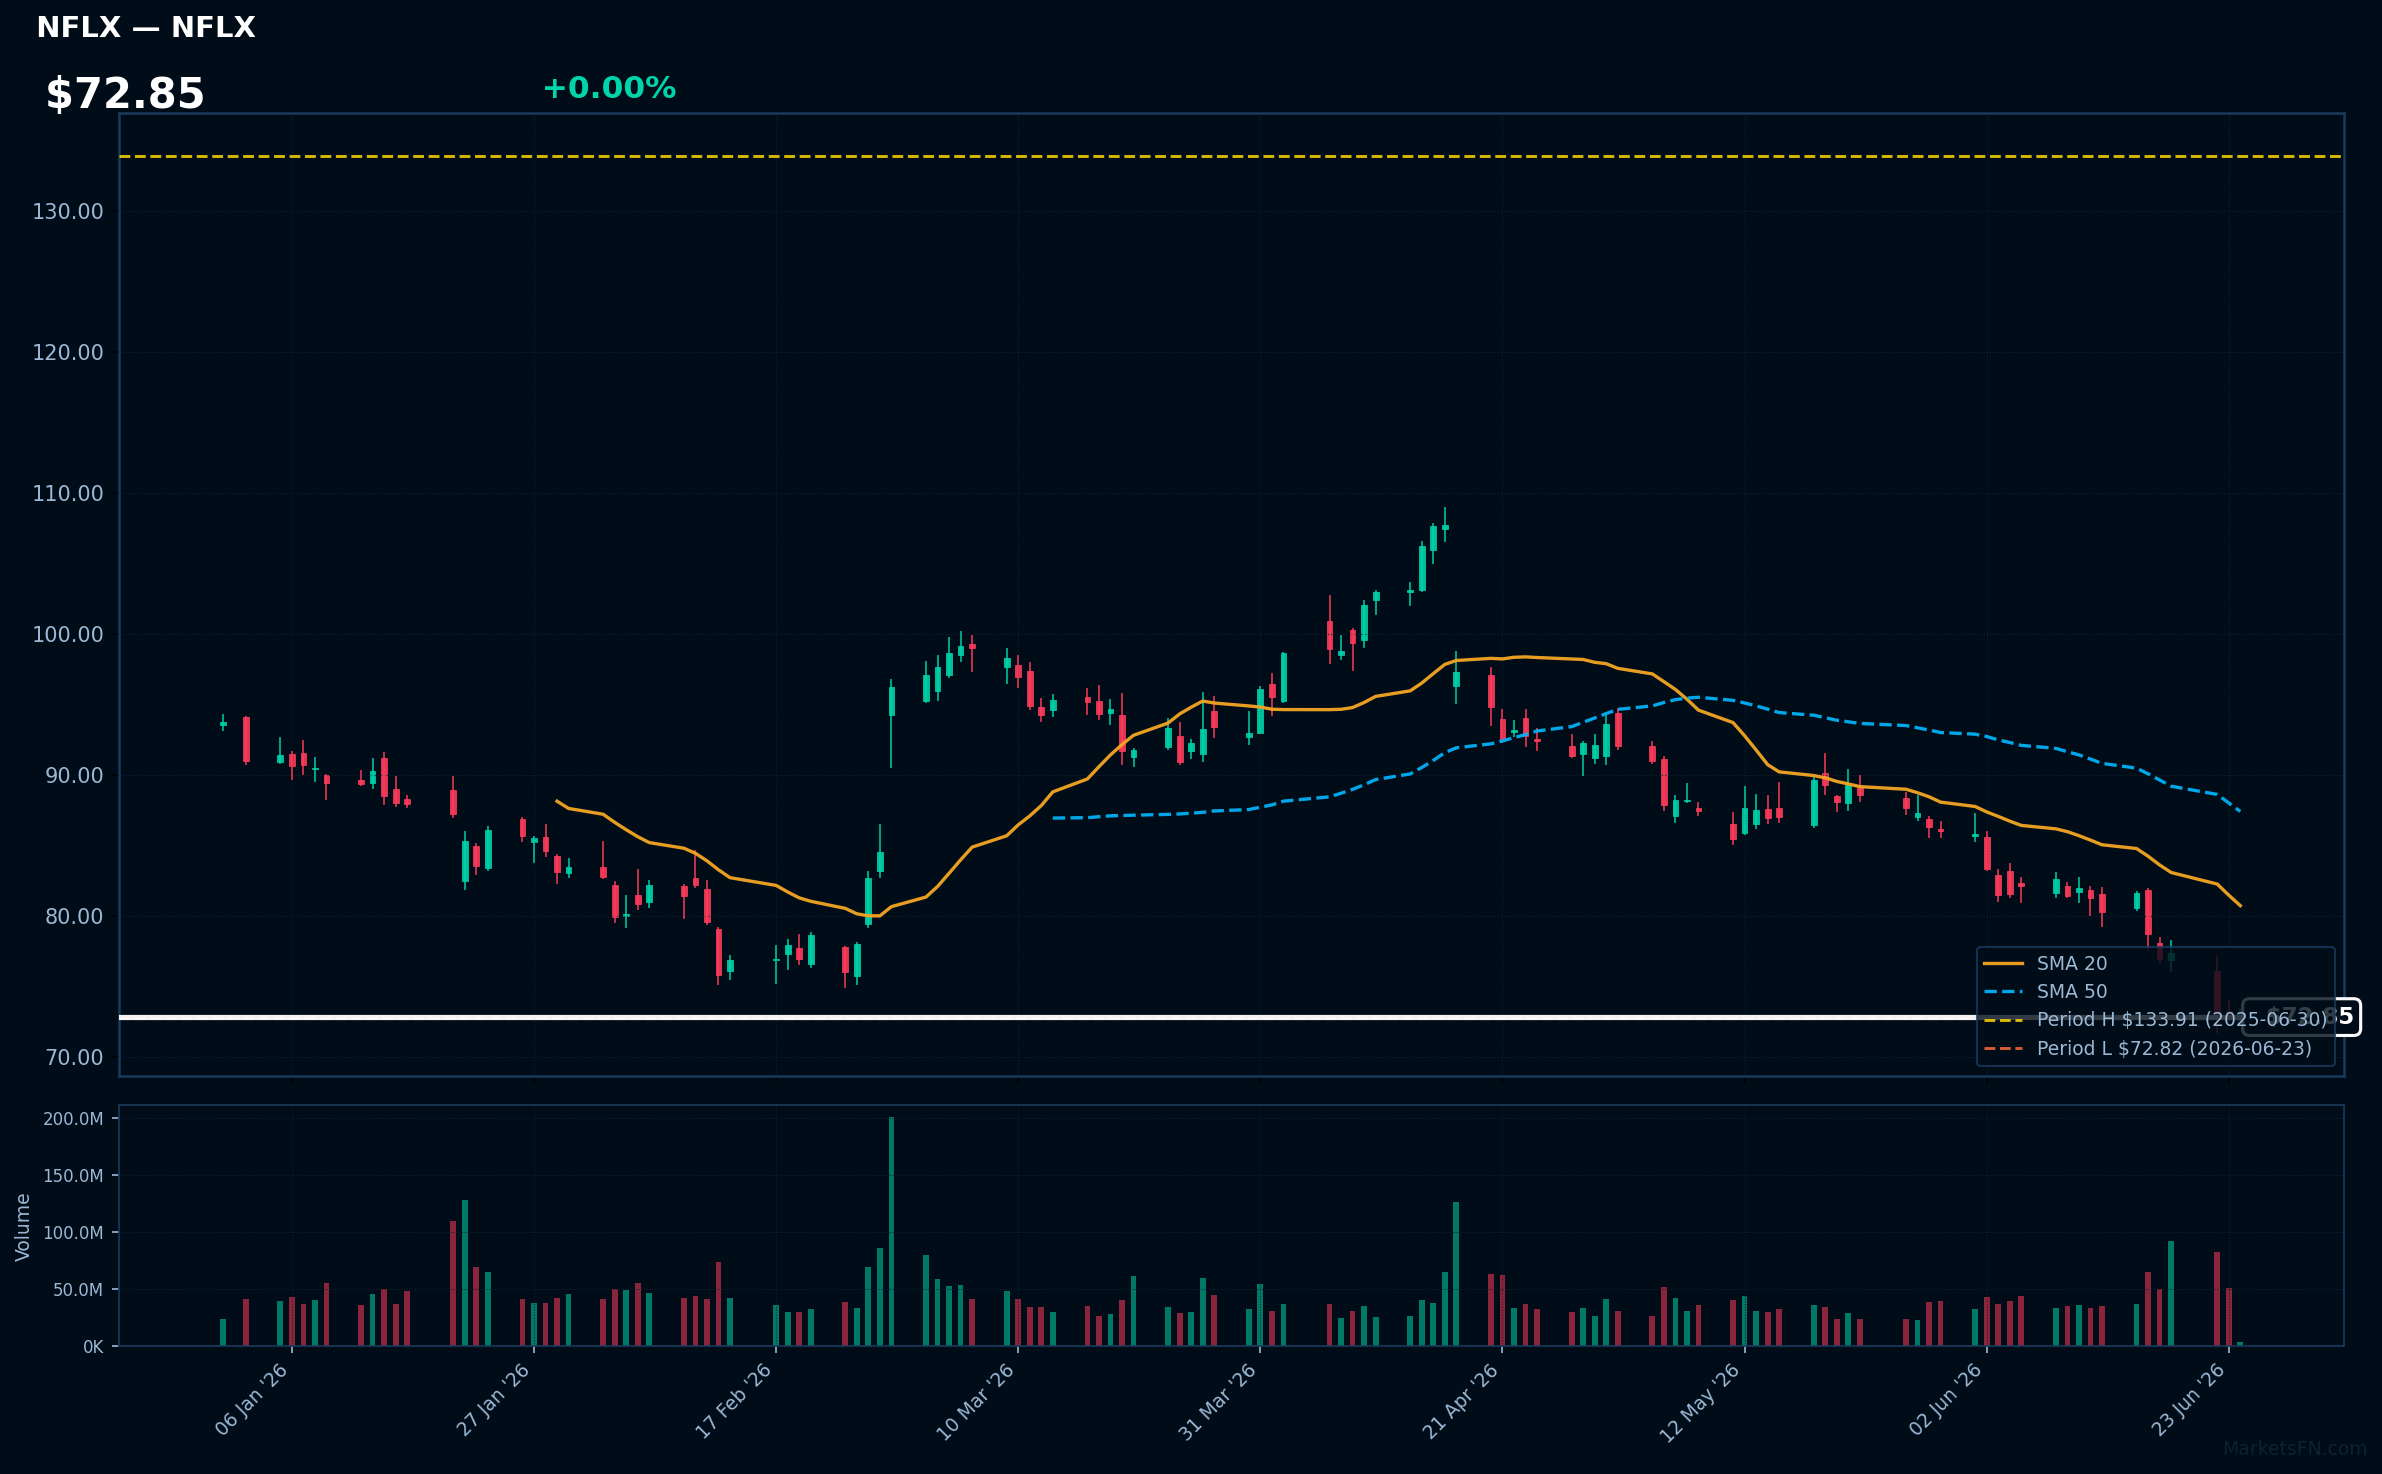
NFLX | Netflix Inc | Communication Services | Price Last: $73.09 | % Realized: -42.86% | RSI: 21.5 | % above MA200: -25.1% | Trend: Below MA20, MA50, MA200
Netflix Inc is a global streaming entertainment service offering a wide variety of TV series, documentaries, and films. Investors care about its subscriber growth, content pipeline, and pricing power, which drive revenue and profitability.
NFLX is in a sustained downtrend with RSI(14) at 21.5, indicating oversold conditions. The stock is 0.4% above its 52-Week low, testing major support, with bearish MA alignment: price ($72.85) < MA20 < MA50 < MA200, a warning sign.
Related headlines
- Netflix Struggles to Shift the Narrative After Warner Bros. Fiasco
- Netflix Unveils New Horror Game to Jumpstart Interactive Offerings
- S&P 500, Nasdaq Drop As SpaceX, Broader Tech Weakness Outweighs US-Iran Hopes SPCX, GOOGL, NFLX, COIN, MU In Focus
- NFLX Stock Sinks To Near 52-Week Low: Retail Traders Think It Is A Great Buying Opportunity
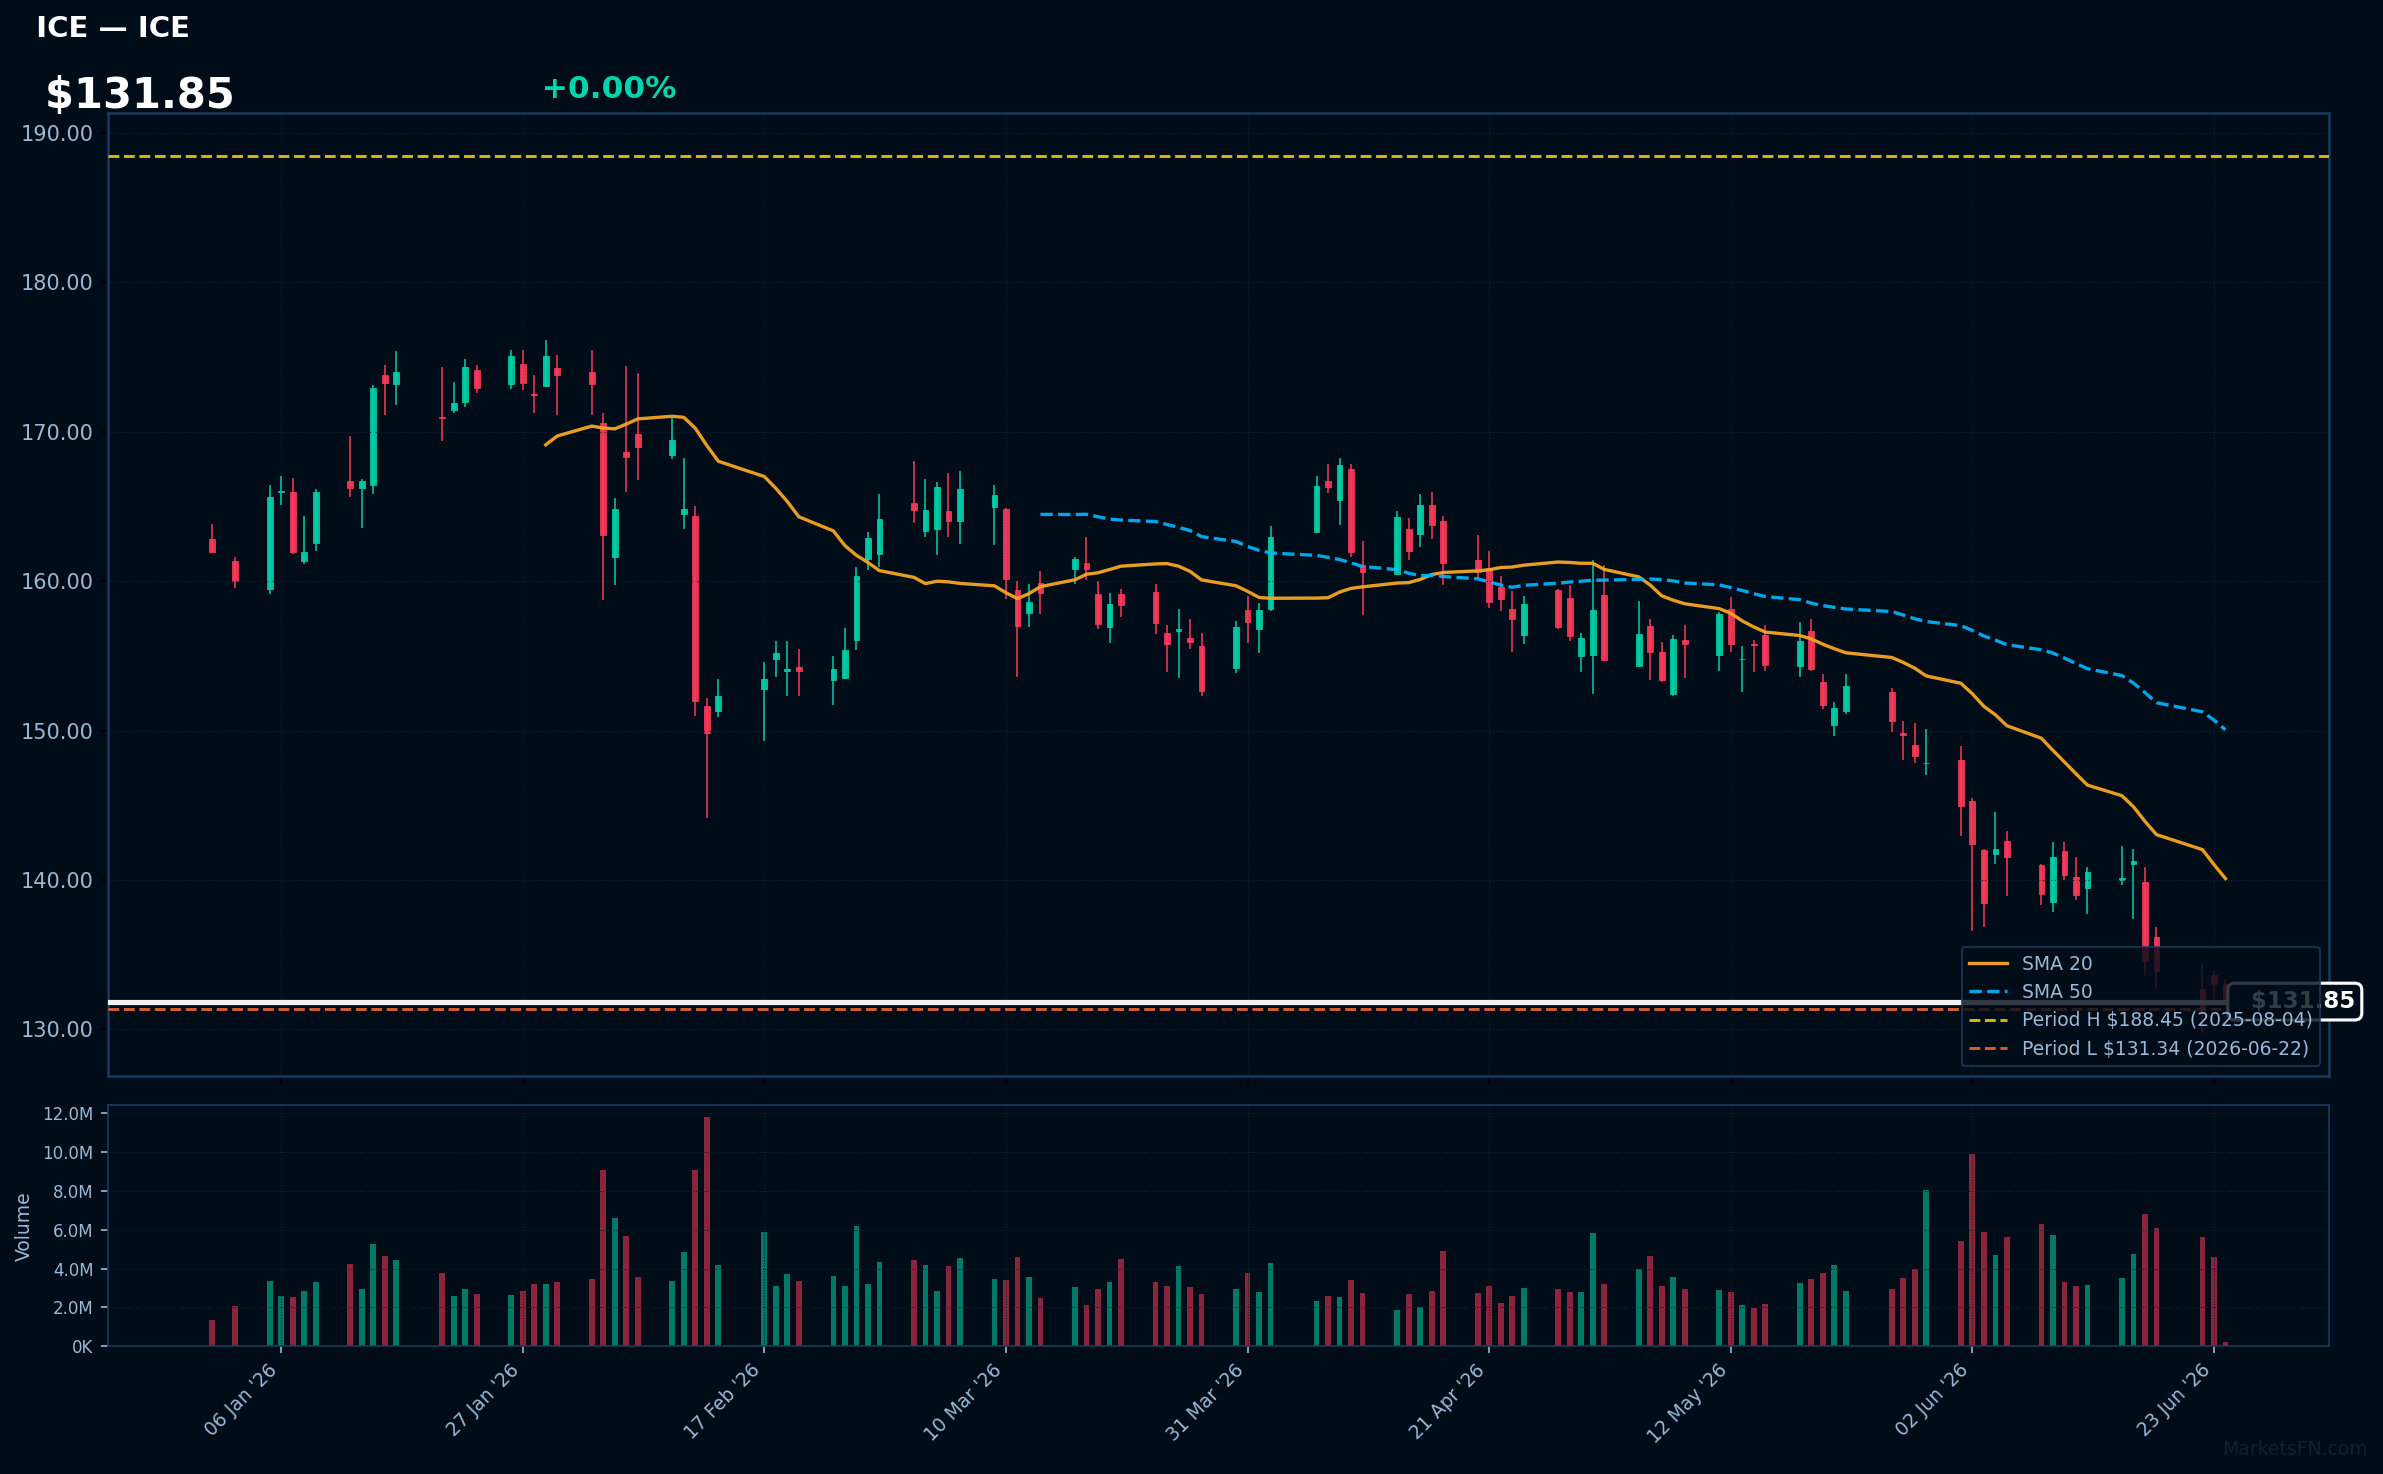
ICE | Intercontinental Exchange Inc | Financial | Price Last: $131.88 | % Realized: -27.07% | RSI: 29.3 | % above MA200: -16.8% | Trend: Below MA20, MA50, MA200
Intercontinental Exchange Inc (ICE) operates global exchanges, clearing houses, and data services, facilitating trading in financial and commodity markets; investors care due to its critical role in global financial infrastructure and potential exposure to market volatility.
ICE's technical situation indicates a sustained downtrend with price ($131.85) below MA20, MA50, and MA200; RSI(14) at 29.3 suggests oversold conditions, and being 0.4% above its 52-Week low signals testing of major support, potentially a warning sign.
Related headlines
- ICE & OKX Are Getting Ready to Drink Coinbases Tokenized Milkshake
- ICE Invests in OKX at $25 Billion to Launch Tokenized NYSE Stocks
- Intercontinental Exchange and OKX Establish Joint Venture to Bridge Traditional and Digital Asset Markets
- ICE Launches ICE GreenTrace its New Environmental Registry Technology Service
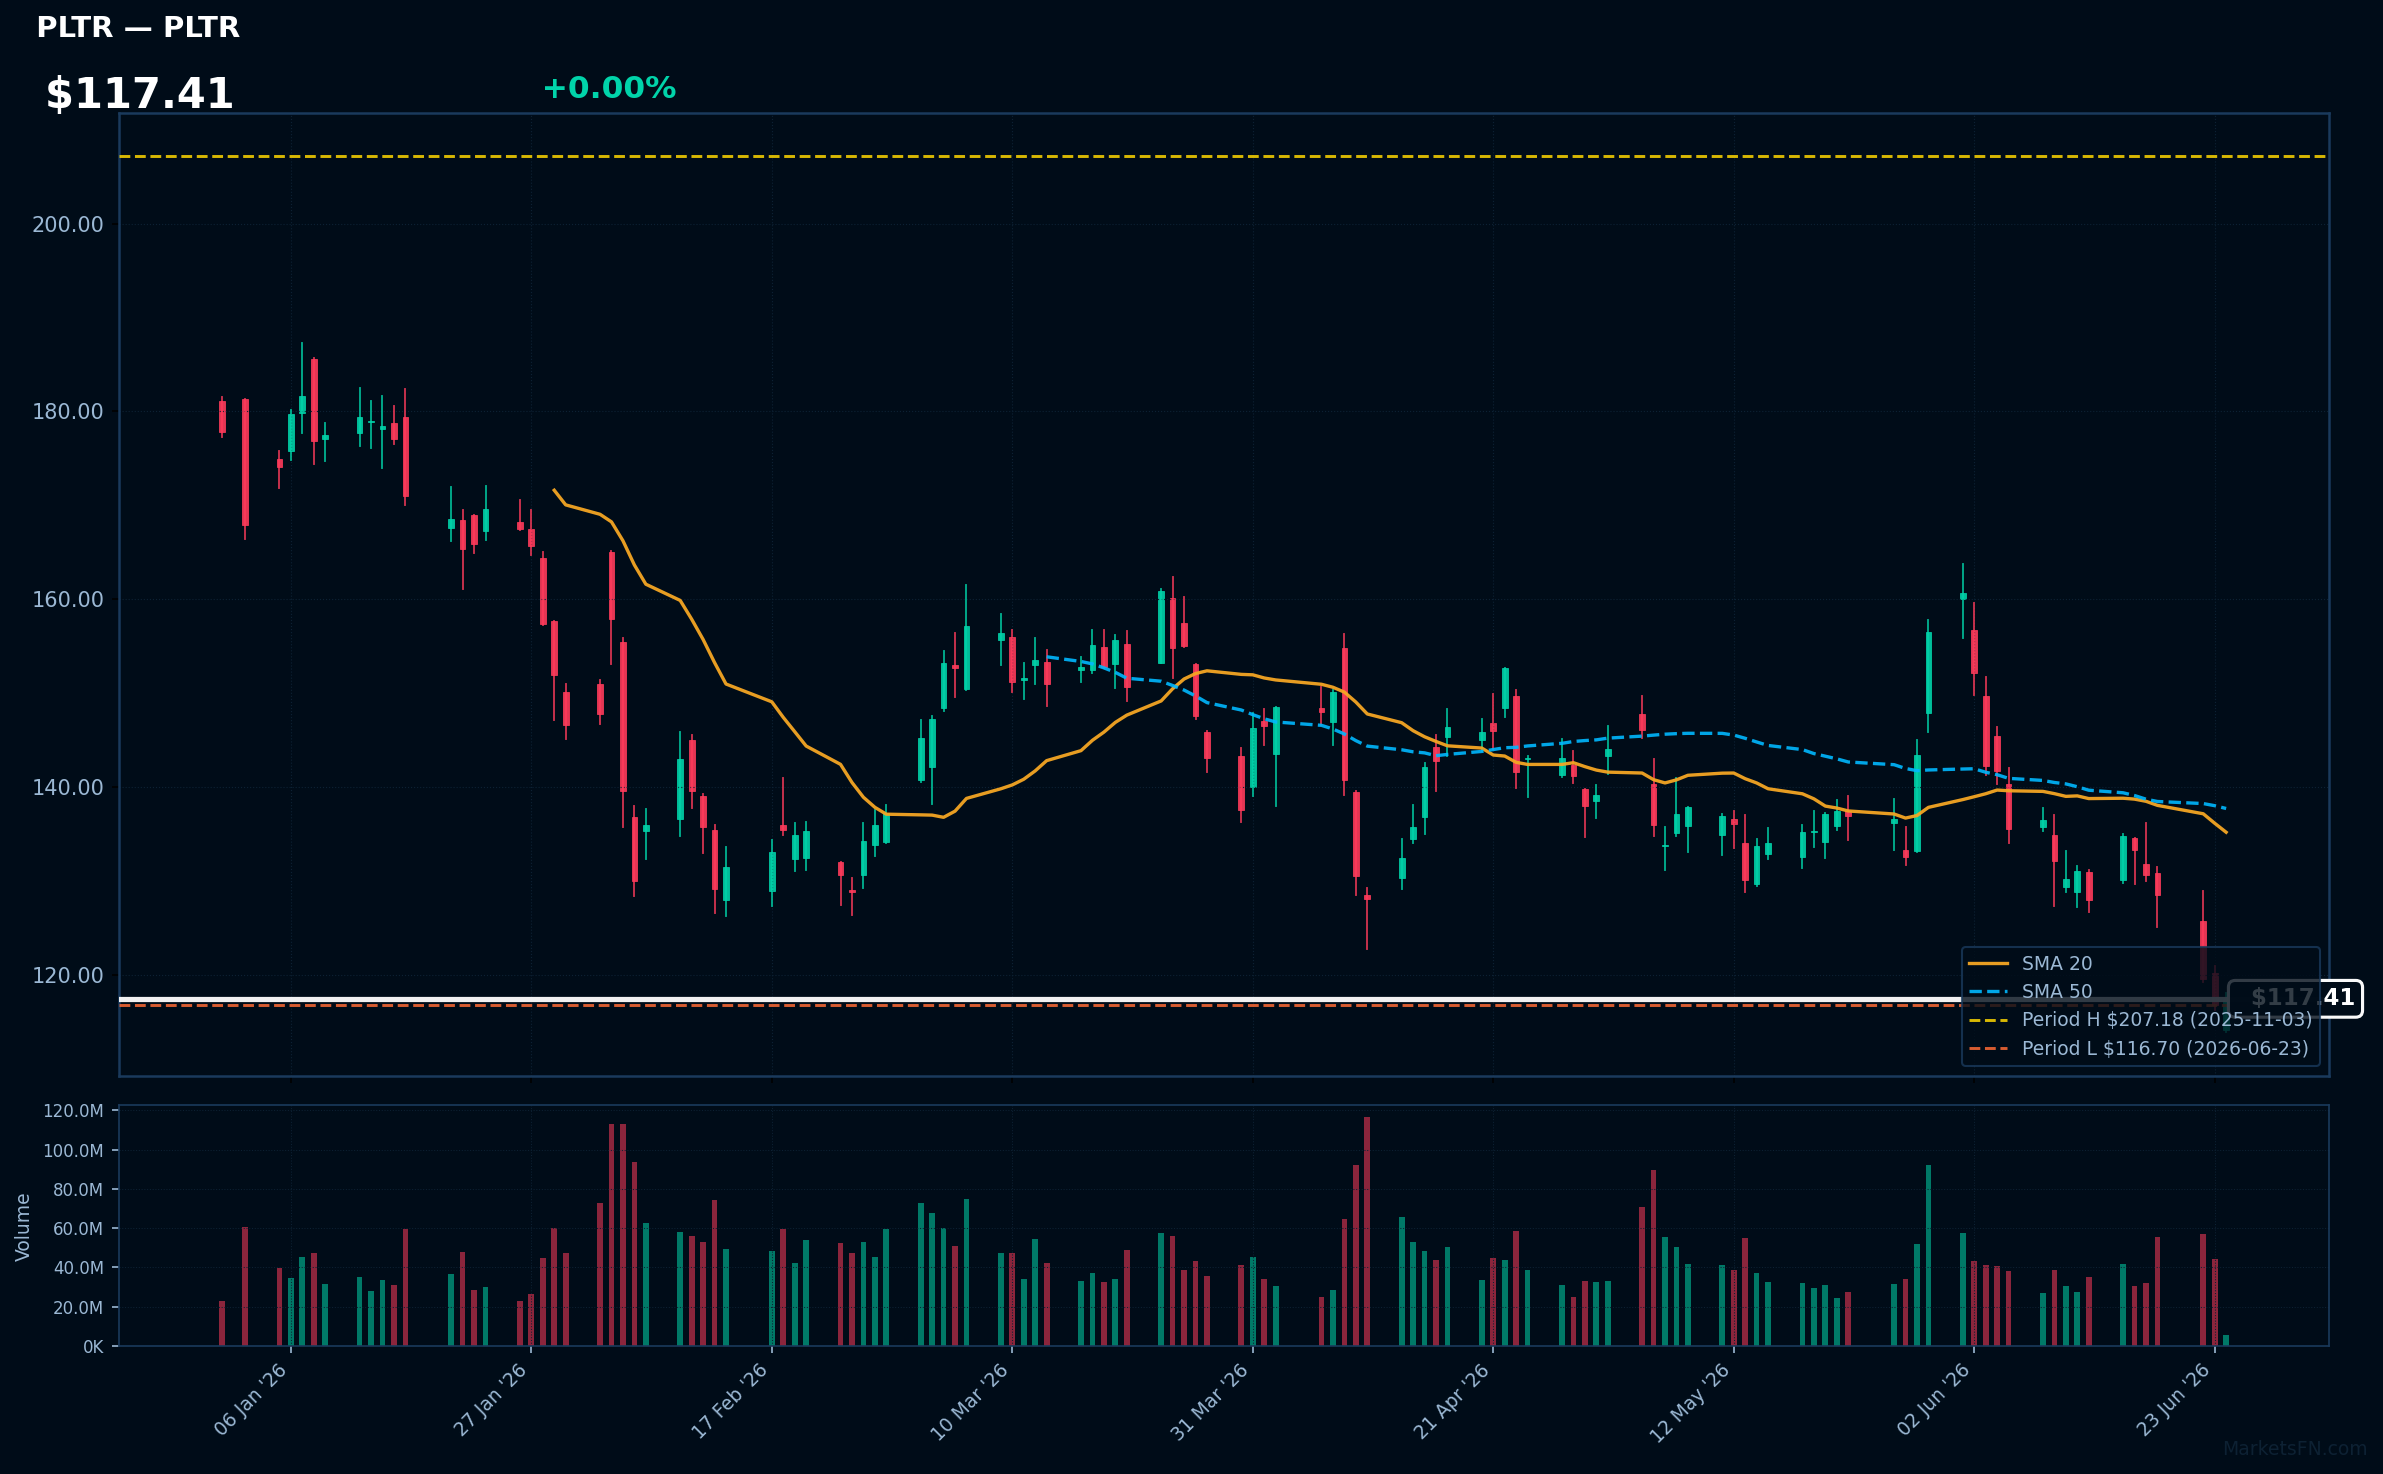
PLTR | Palantir Technologies Inc | Technology | Price Last: $117.69 | % Realized: -17.83% | RSI: 33.7 | % above MA200: -26.1% | Trend: Below MA20, MA50, MA200
Palantir Technologies Inc provides data integration and analytics software to governments and corporations, enabling them to make data-driven decisions. Investors should care because its software is used in critical applications such as defense, finance, and healthcare, indicating potential for long-term growth.
PLTR's technical situation is bearish, with an RSI(14) of 33.7 indicating oversold conditions, and a sustained downtrend as price ($117.41) remains below MA20, MA50, and MA200. The stock is 0.8% above its 52-Week low, testing major support.
Related headlines
- Nasdaq, S&P 500 Futures Rebound As Micron Rally Lifts Chip Stocks: Why SPCX, QCOM, TSM, BABA, PLTR, CBRS, WEN, IBRX Are In Focus
- PLTR Stock Heads for Worst Month Ever: Retail Awaits Dip Below $100, Michael Burry Takes Victory Lap
- Dow, S&P 500, Nasdaq Futures Rise After Chip Stock Selloff: Why CBRS, PLTR, BLZE, MU, FDX Are Trending
- Palantir partners with Zeta Global on AI-powered marketing infrastructure, Wedbush sees further enterprise validation
Market Commentary
The S&P 500 stocks listed near 52-week extremes indicate a significant market development. Stocks at 52-week highs, such as GE, TRV, MNST, ALL, and D, suggest strong performance in their respective sectors. Conversely, stocks near 52-week lows, including CME, NKE, NFLX, ICE, and PLTR, may be experiencing challenges or sector rotation.
The stocks at 52-week highs are from diverse sectors, including industrials (GE), finance (TRV, ALL), consumer staples (MNST), and utilities (D), potentially indicating broad market strength. In contrast, the stocks near 52-week lows are from finance (ICE, CME), consumer discretionary (NKE, NFLX), and technology (PLTR), which may be sensitive to macroeconomic conditions and sector rotation.
Key levels to watch include the 52-week highs and lows for these stocks. Potential catalysts for change include macroeconomic announcements, earnings reports, and sector-specific news. Monitoring these levels and catalysts can provide insight into market trends and potential opportunities or risks. The proximity of these stocks to their 52-week extremes, such as NKE being +0.3% above its 52-week low, will be crucial in determining future market movements.
Methodology: All 503 S&P 500 constituents screened. 52-week high = highest daily close over the past 252 trading days (approx. 1 year). 52-week low = lowest daily close over the same period. Distance = (current price / extreme − 1) × 100. Technical indicators computed on up to 1 year of daily OHLCV data.
Disclaimer: For informational purposes only. Not investment advice. Past performance is not indicative of future results.