S&P 500 52-Week Highs & Lows Radar: GE Aerospace (GE), VICI Properties (VICI) and more
· Stocks · MarketsFN Team
S&P 500 52-Week Highs & Lows Radar: GE Aerospace (GE), VICI Properties (VICI) and more
Screening all 503 S&P 500 constituents for stocks nearest to their 52-week high and their 52-week low. Data as of July 02, 2026. % Realized = 52-week total return.
Legend: RSI > 70 = overbought · RSI < 30 = oversold · Green % Realized = positive 52W return · Red = negative.
📈 Nearest to 52-Week High
Sectors represented: Industrials (2), Healthcare (1), Basic Materials (1), Technology (1)
| Ticker | Company | Sector | Price Last | % Realized | 52-Week High Date | RSI | % above MA200 | Trend |
|---|---|---|---|---|---|---|---|---|
| GE | GE Aerospace | Industrials | $380.29 | +55.38% | 2026-07-02 | 77.0 | +22.9% | Above MA20, MA50, MA200 |
| UNH | Unitedhealth Group Inc | Healthcare | $428.78 | +39.41% | 2026-07-02 | 66.8 | +27.1% | Above MA20, MA50, MA200 |
| LIN | Linde Plc | Basic Materials | $539.75 | +13.11% | 2026-07-02 | 65.7 | +15.0% | Above MA20, MA50, MA200 |
| UNP | Union Pacific Corp | Industrials | $281.31 | +18.62% | 2026-07-02 | 65.0 | +15.1% | Above MA20, MA50, MA200 |
| PANW | Palo Alto Networks Inc | Technology | $353.83 | +79.64% | 2026-07-02 | 81.8 | +75.6% | Above MA20, MA50, MA200 |
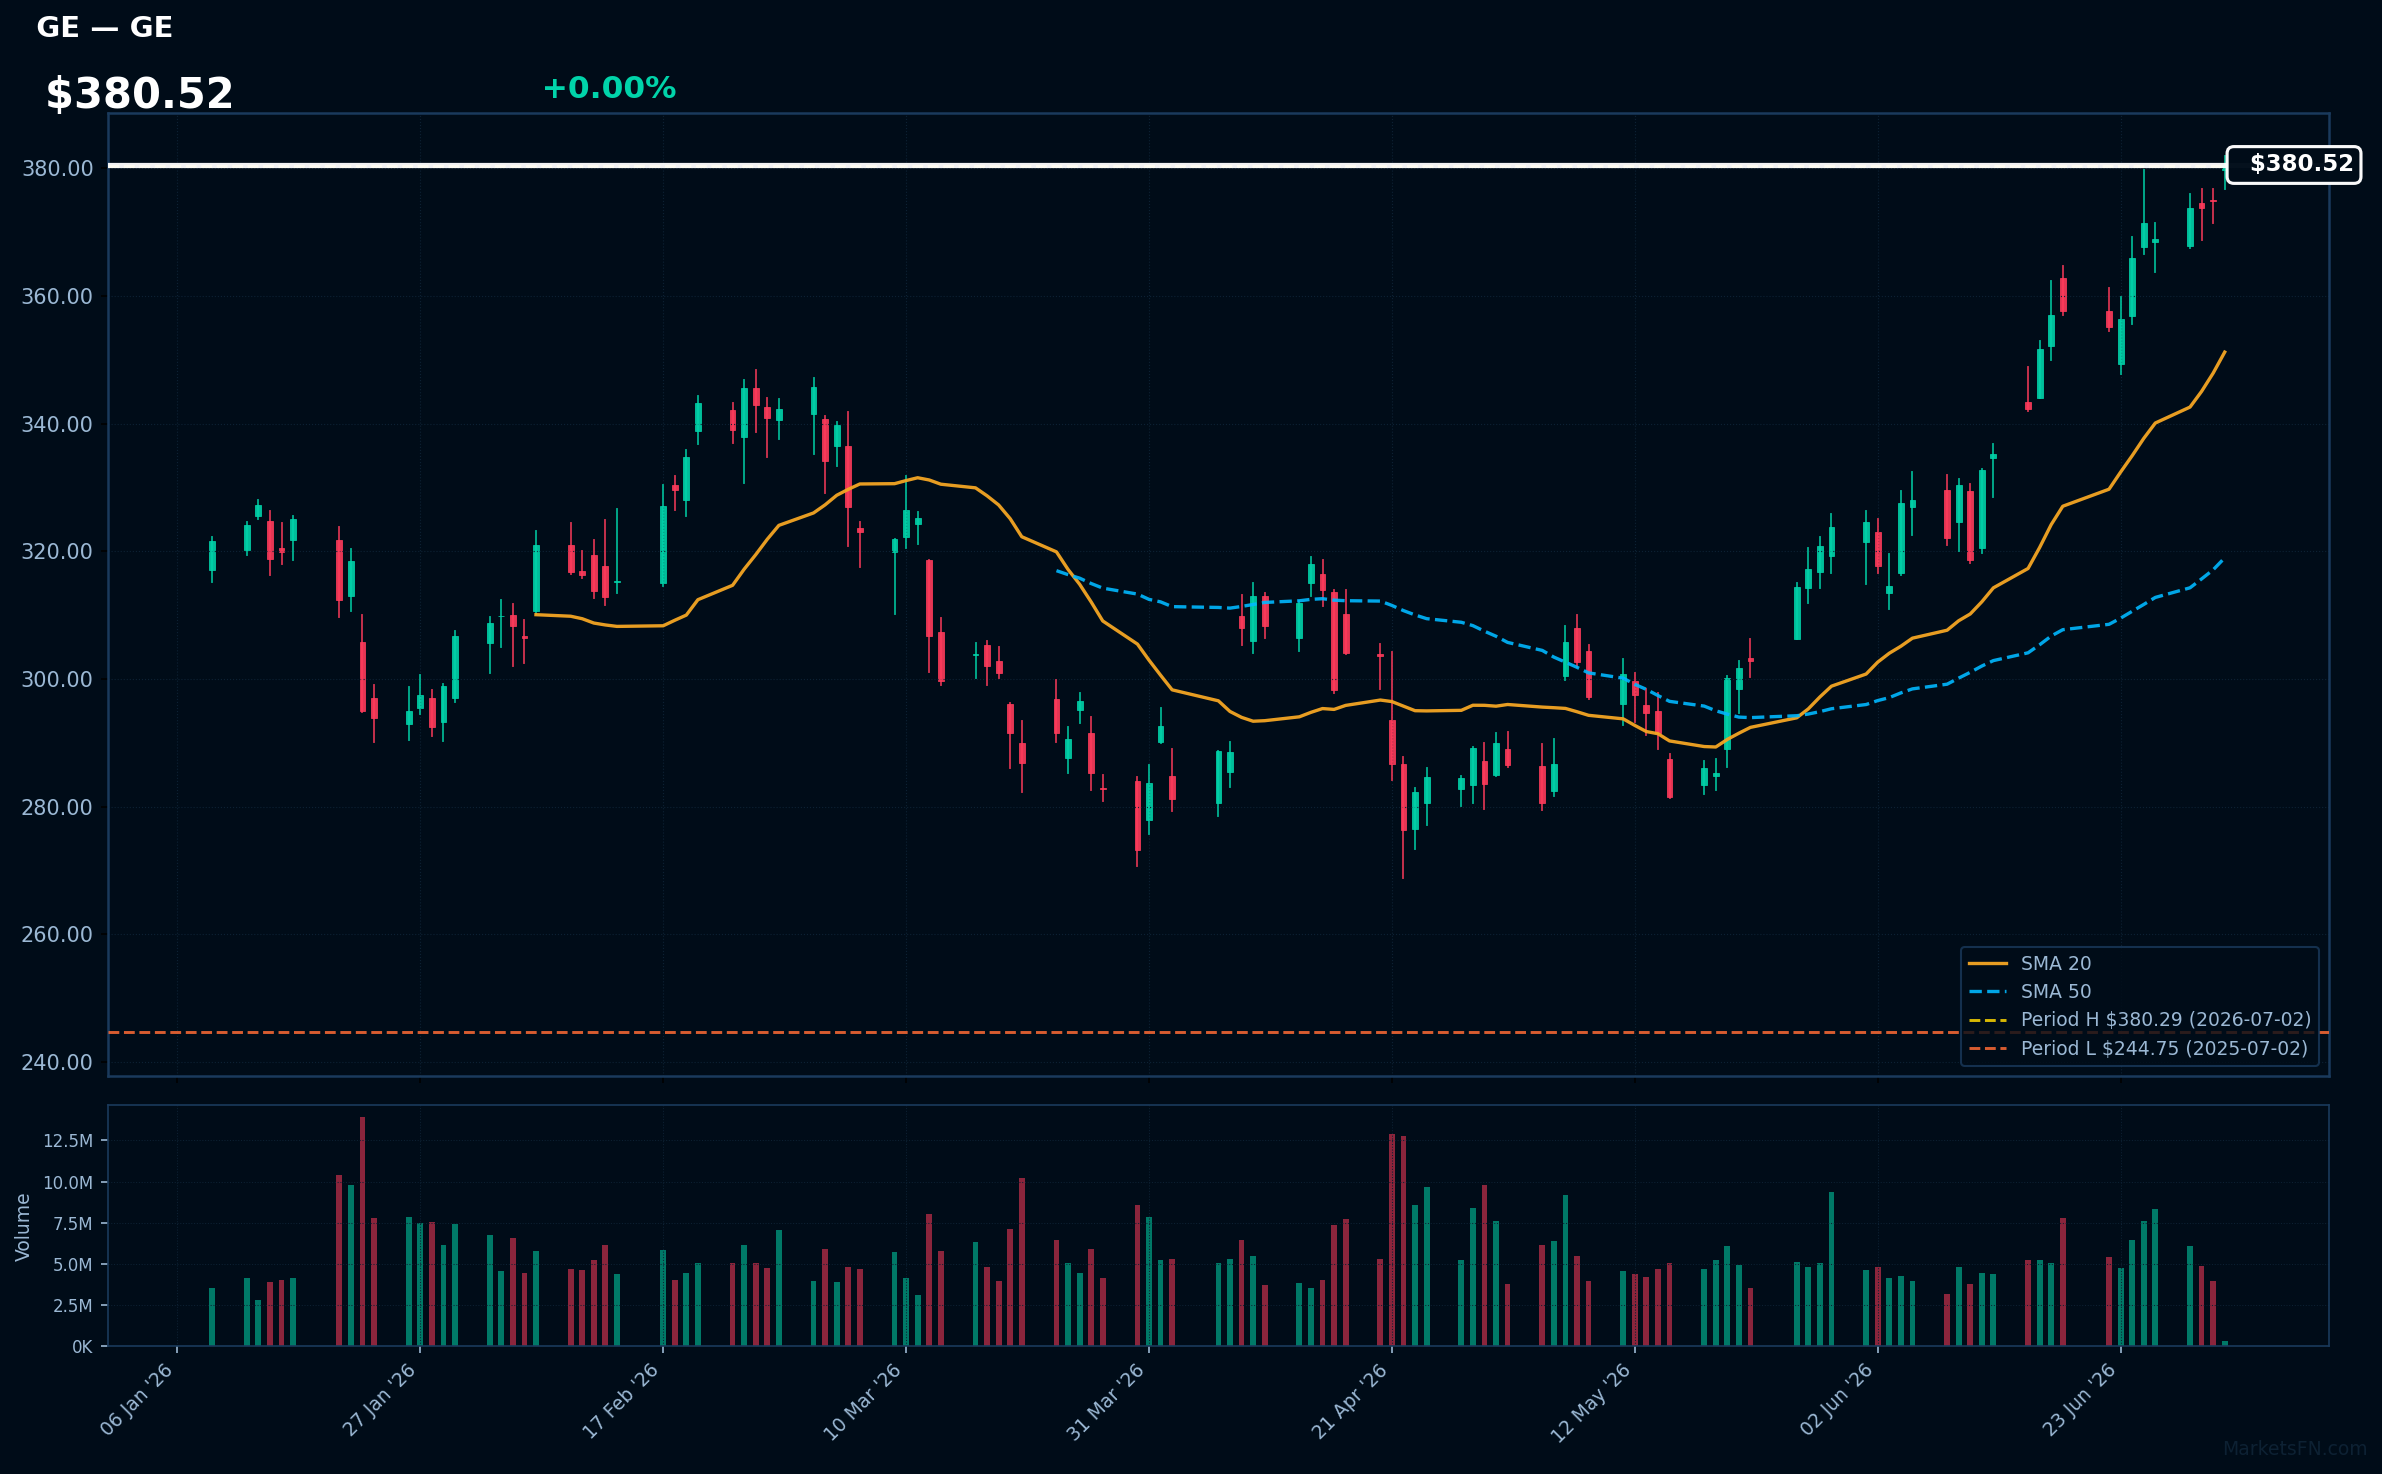
GE | GE Aerospace | Industrials | Price Last: $380.29 | % Realized: +55.38% | RSI: 77.0 | % above MA200: +22.9% | Trend: Above MA20, MA50, MA200
GE Aerospace specializes in jet engines, aircraft systems, and services, playing a crucial role in the aviation industry. Investors should care due to its innovative technologies and strong market position, which drive demand in both commercial and defense sectors.
The current technical situation indicates strong momentum with an RSI of 77.0 and a bullish MA alignment: price > MA20 > MA50 > MA200. The stock is also 0.0% below its 52-Week high, signaling a potential breakout.
Related headlines
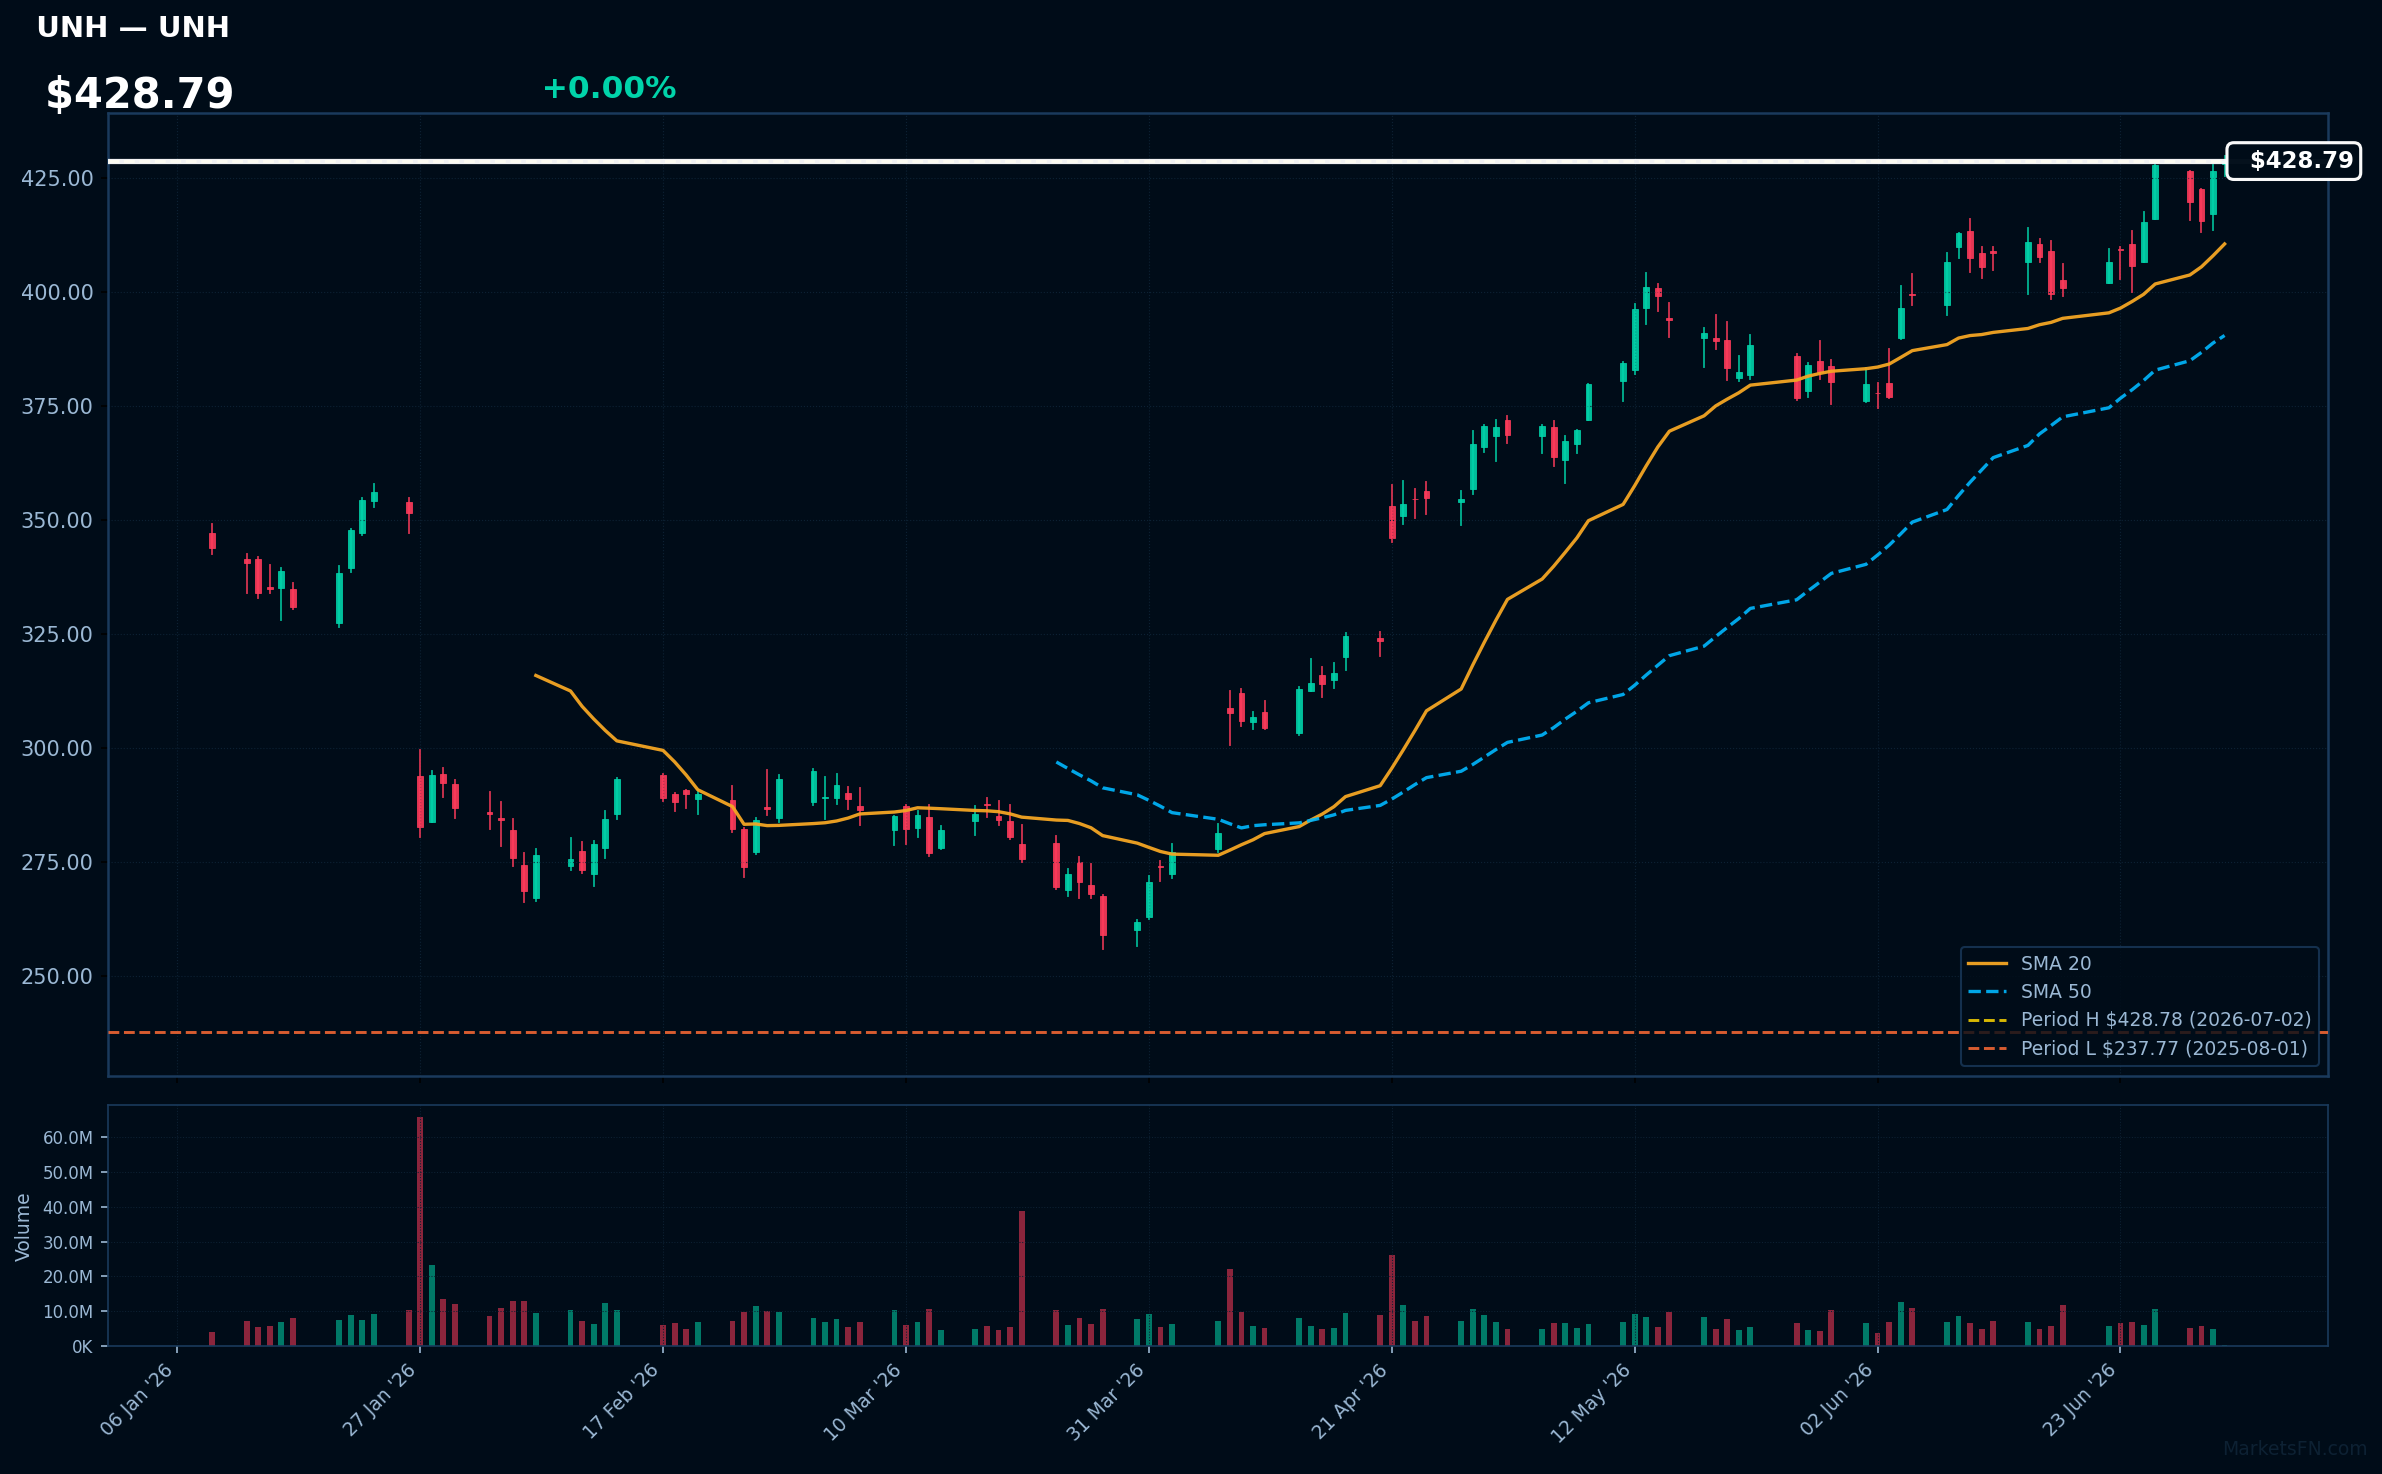
UNH | Unitedhealth Group Inc | Healthcare | Price Last: $428.78 | % Realized: +39.41% | RSI: 66.8 | % above MA200: +27.1% | Trend: Above MA20, MA50, MA200
Unitedhealth Group Inc provides healthcare products and insurance services, focusing on improving health outcomes and reducing costs. Investors should care due to its significant market position and innovative solutions in a rapidly evolving healthcare landscape.
The current technical situation indicates bullish momentum, with an RSI(14) of 66.8 and a bullish MA alignment: price > MA20 > MA50 > MA200, suggesting a sustained uptrend.
Related headlines
- GH Stock At Over 5-Year Highs Whats The UnitedHealth Connection?
- UnitedHealthcare Community Plan of Nebraska Invests $385,000 to Expand Programs to Support Older Adults, Caregivers and People with Disabilities
- Dow's 211-point rally highlighted by gains for shares of Caterpillar, UnitedHealth
- UnitedHealth Bets $3 Billion on AI Turnaround
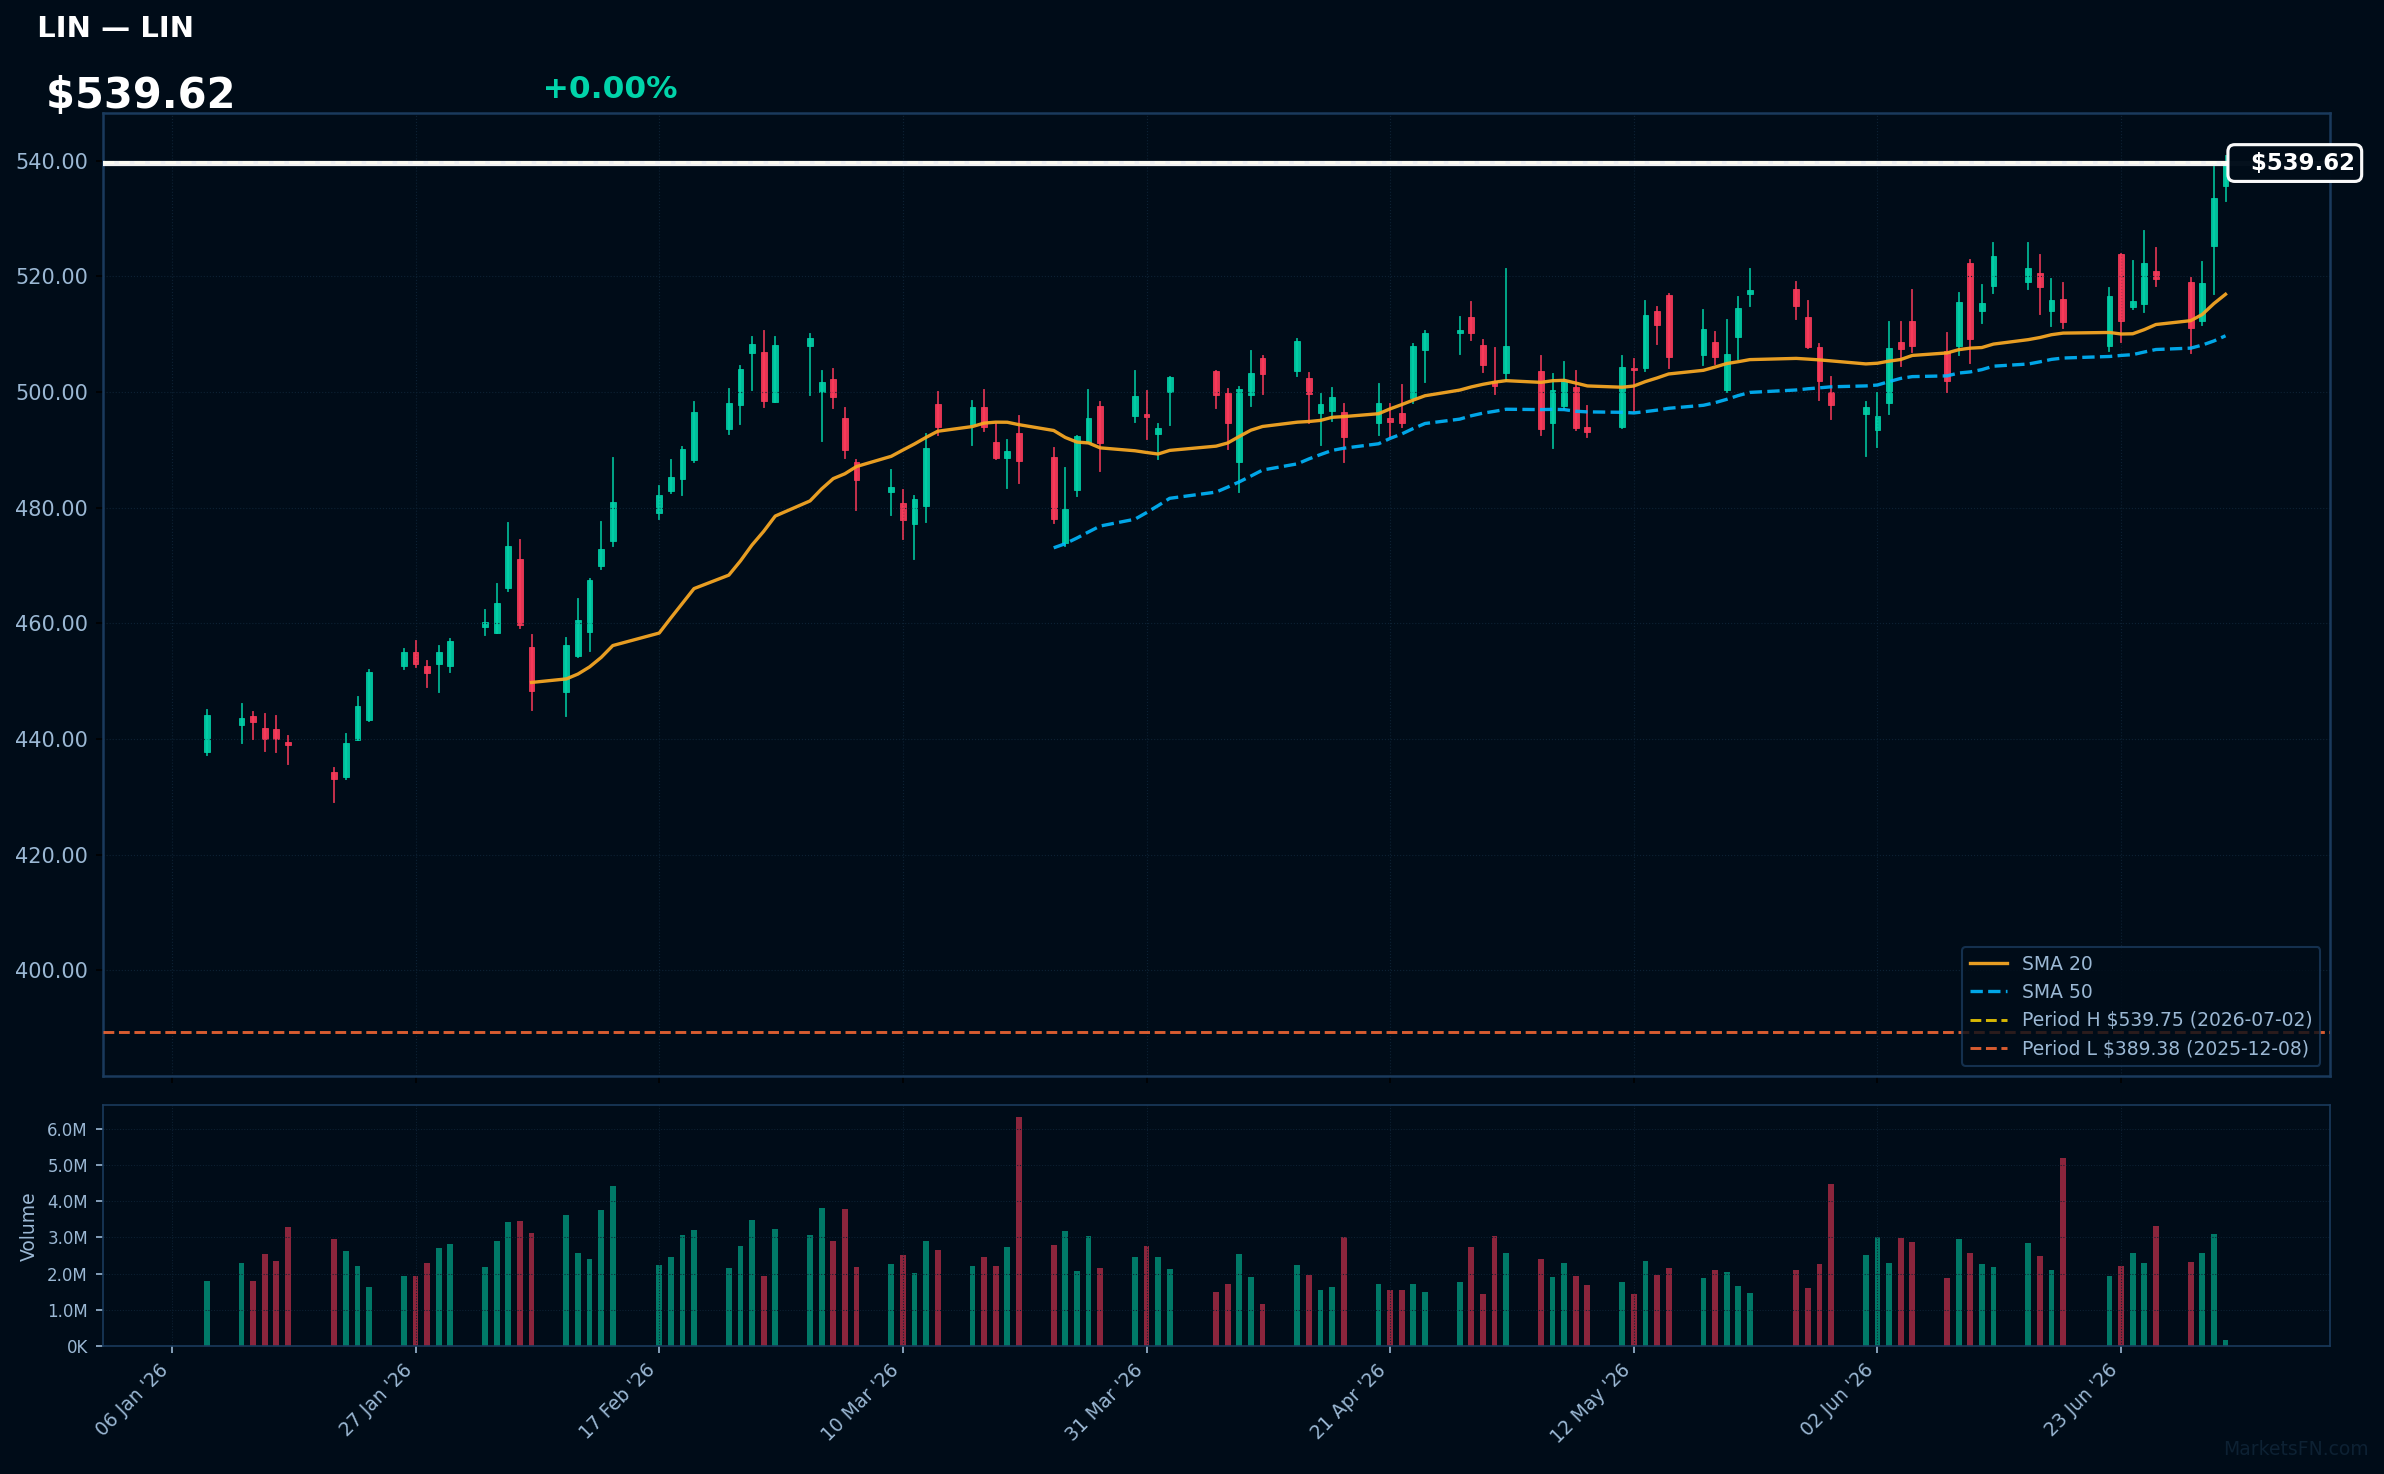
LIN | Linde Plc | Basic Materials | Price Last: $539.75 | % Realized: +13.11% | RSI: 65.7 | % above MA200: +15.0% | Trend: Above MA20, MA50, MA200
Linde Plc (LIN) is a leading global industrial gas company, providing essential gases and services for various industries, including healthcare, manufacturing, and energy. Investors should care due to its critical role in supporting industrial processes and the growing demand for sustainable solutions.
The current technical situation indicates bullish momentum, with an RSI(14) of 65.7 and a strong MA alignment: price > MA20 > MA50 > MA200. The stock is also 0.0% below its 52-Week high, signaling a potential breakout.
Related headlines
- Linde Announces Second Quarter 2026 Earnings and Conference Call Schedule
- Linde Publishes 2025 Sustainable Development Report
- Linde Earns Dow Jones Best-in-Class and S&P Global Recognition for Sustainability Leadership
- Linde PLC (LIN) Q1 2026 Earnings Call Highlights: Strong EPS Growth and Strategic Acquisitions ...
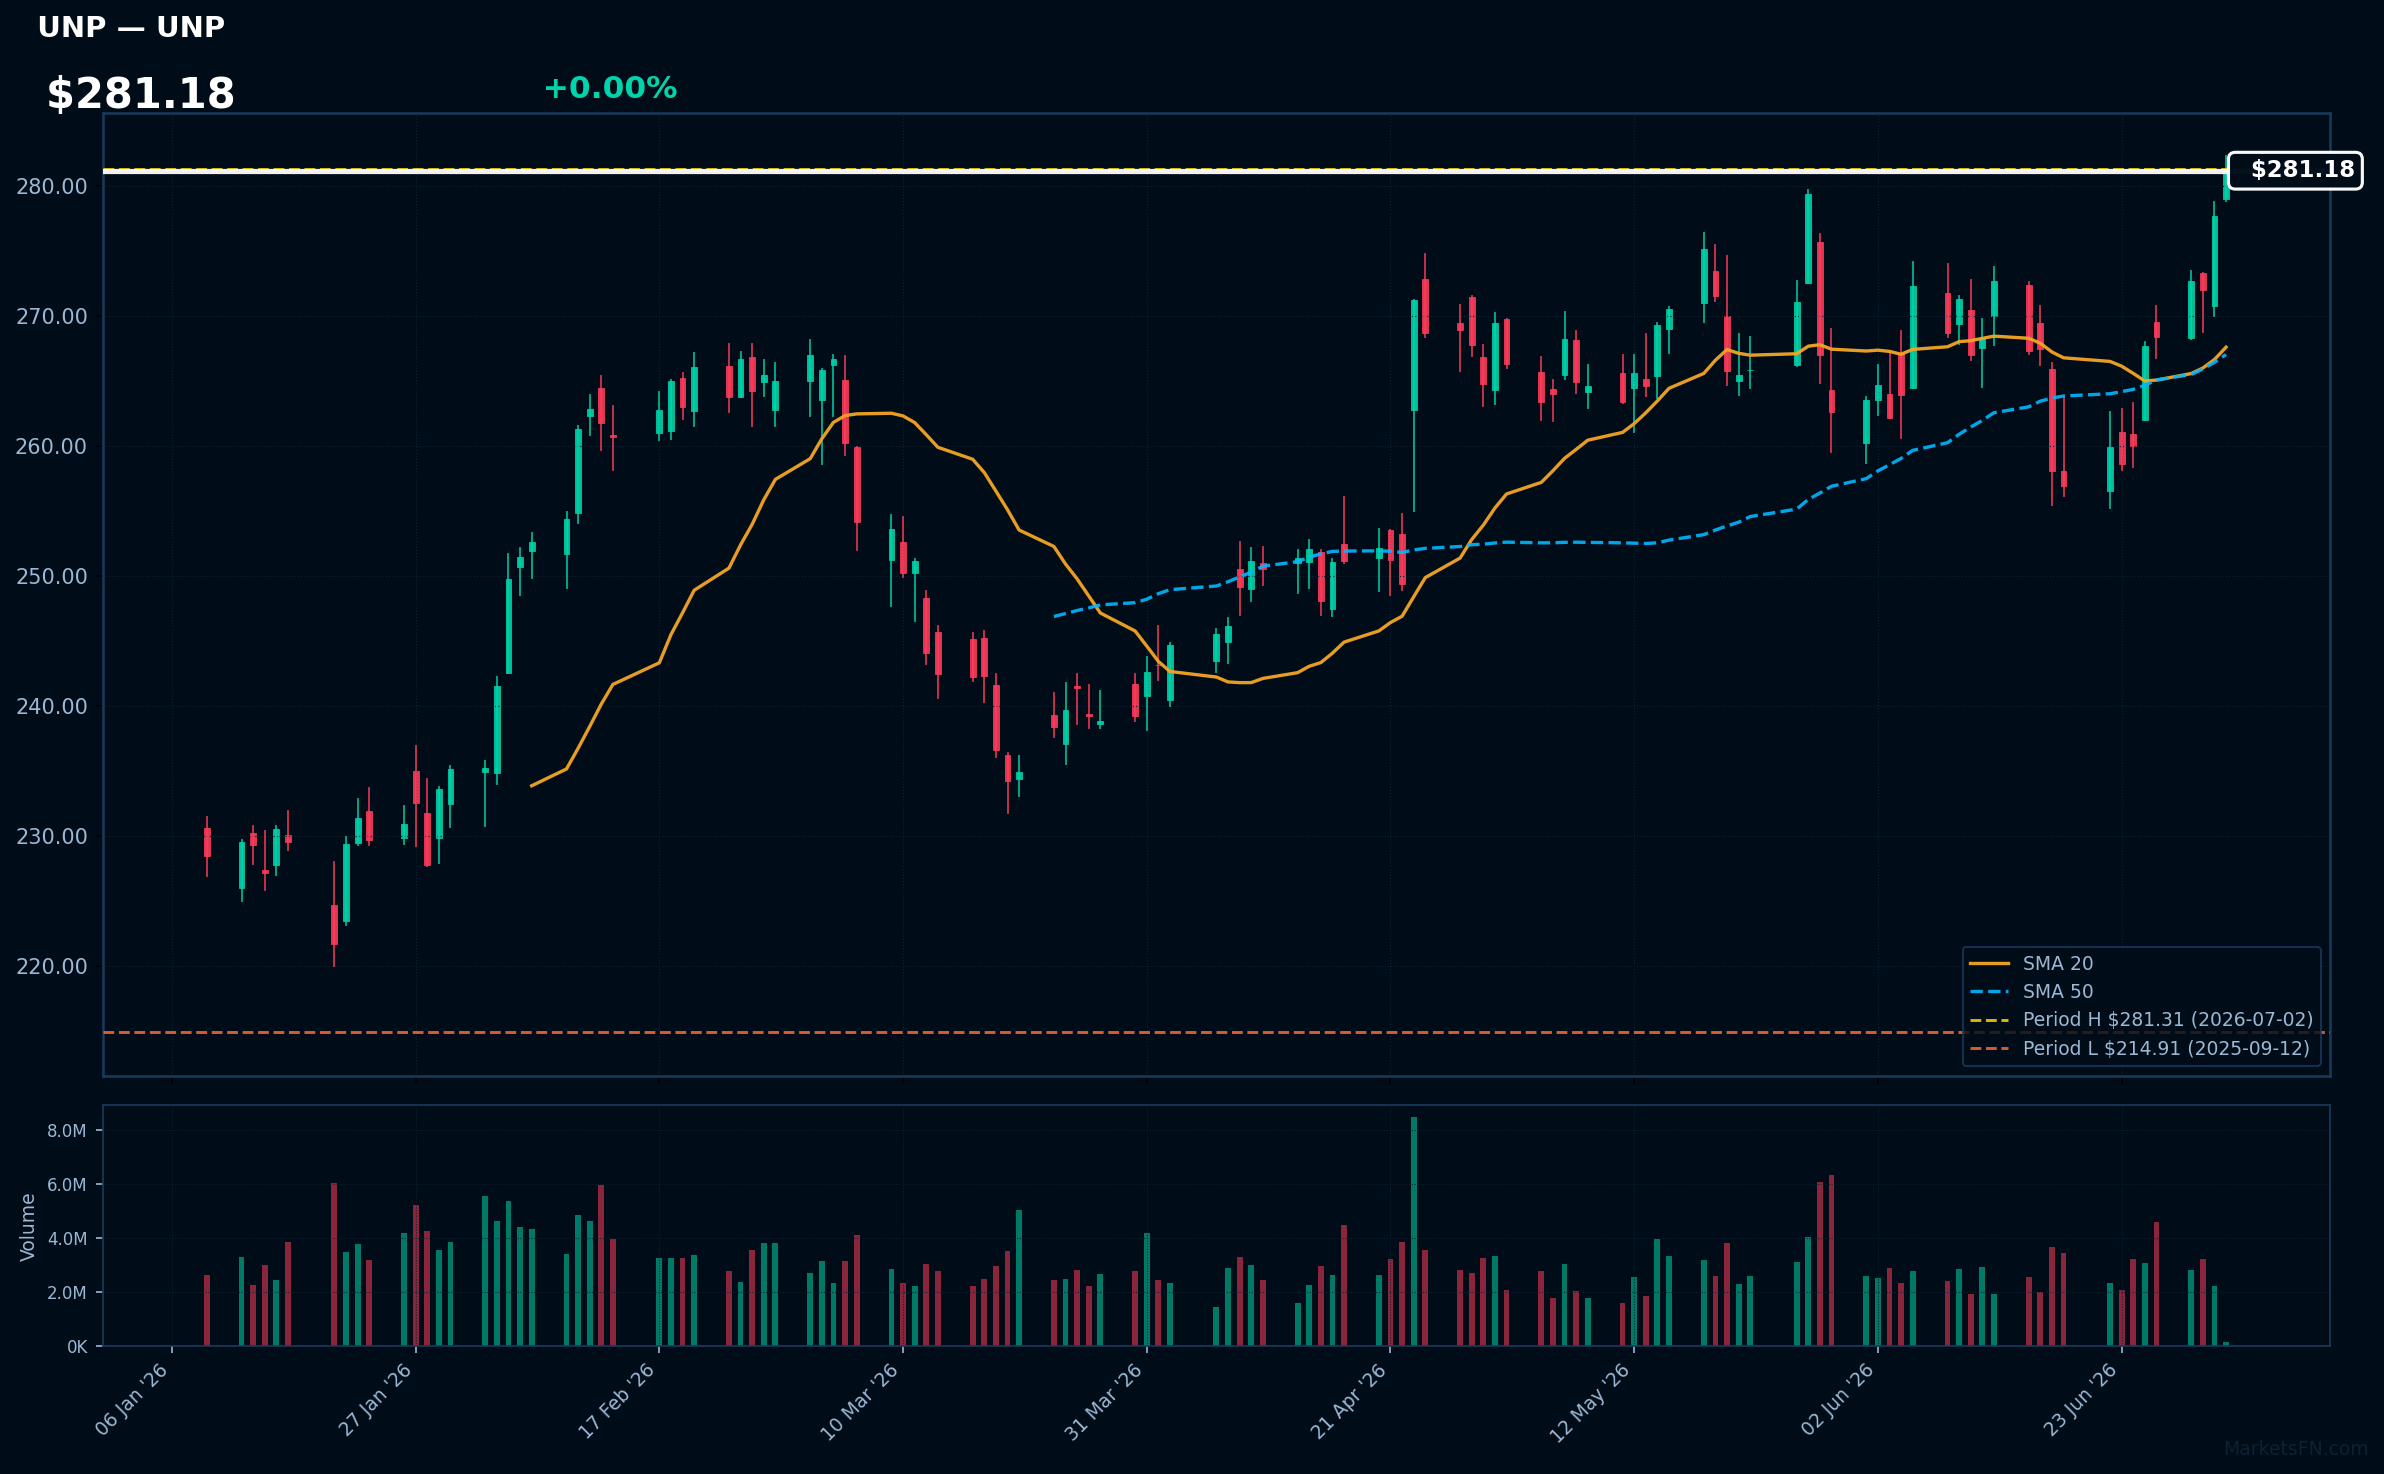
UNP | Union Pacific Corp | Industrials | Price Last: $281.31 | % Realized: +18.62% | RSI: 65.0 | % above MA200: +15.1% | Trend: Above MA20, MA50, MA200
Union Pacific Corp (UNP) operates a major freight railroad network in the western United States, transporting goods such as agricultural products, automotive, and industrial products. Investors should care due to its critical role in supply chain logistics and economic growth.
The current technical situation shows bullish momentum, with an RSI(14) of 65.0 and a strong MA alignment: price > MA20 > MA50 > MA200, indicating a sustained uptrend. The stock is 0.0% below its 52-Week high, near a potential breakout level.
Related headlines
- Union Pacific Corporation Announces Second Quarter 2026 Earnings Release Date
- Rate, service issues flagged by ag retailers in Union Pacific-Norfolk Southern rail merger
- Union Pacific Corporation CEO Jim Vena and CFO Jennifer Hamann to Address the NYSE 2026 European Investor Conference In Association with Bank of America
- Union Pacific Mourns the Passing of Former Chairman and CEO Dick Davidson
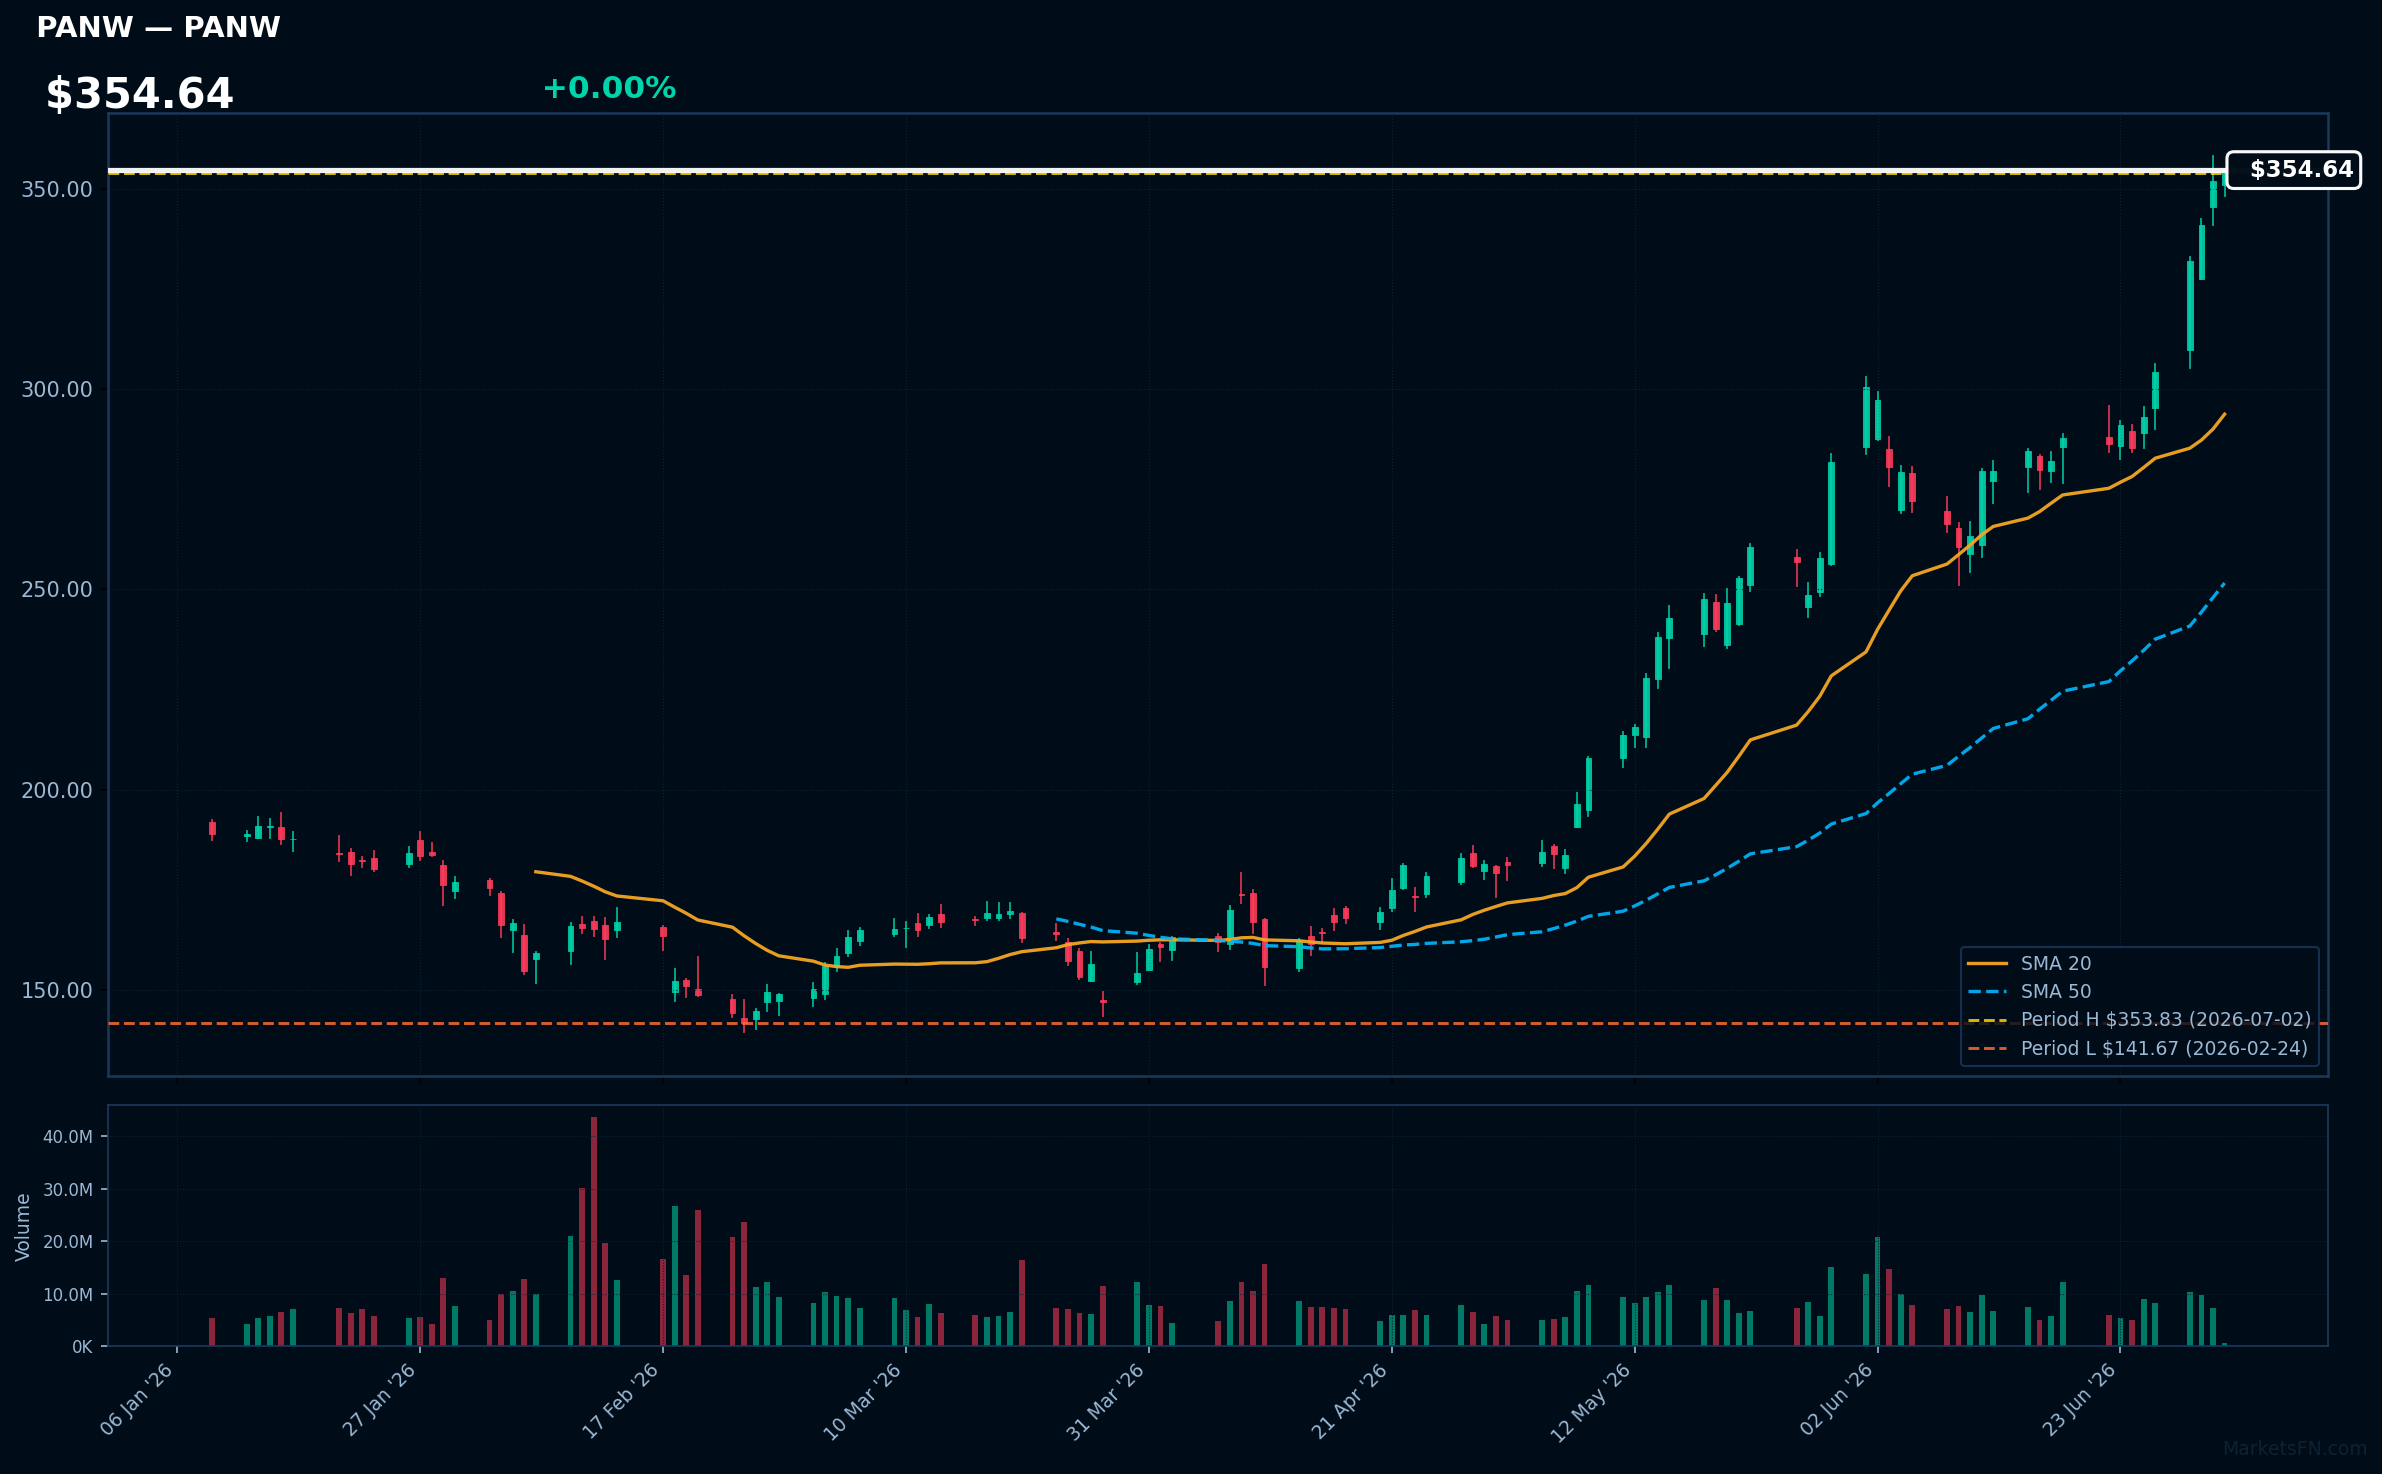
PANW | Palo Alto Networks Inc | Technology | Price Last: $353.83 | % Realized: +79.64% | RSI: 81.8 | % above MA200: +75.6% | Trend: Above MA20, MA50, MA200
Palo Alto Networks Inc specializes in cybersecurity solutions, providing advanced firewalls and cloud-based security services. Investors should care due to the increasing demand for cybersecurity amid rising digital threats, positioning the company for sustained growth and market relevance.
The current technical situation indicates strong momentum, with an RSI(14) of 81.8 and a bullish MA alignment: price > MA20 > MA50 > MA200. The stock is also 0.0% below its 52-Week high, signaling a potential breakout.
Related headlines
📉 Nearest to 52-Week Low
Sectors represented: Consumer Cyclical (2), Real Estate (1), Communication Services (1), Industrials (1)
| Ticker | Company | Sector | Price Last | % Realized | 52-Week Low Date | RSI | % above MA200 | Trend |
|---|---|---|---|---|---|---|---|---|
| VICI | VICI Properties Inc | Real Estate | $26.27 | -21.13% | 2026-06-22 | 38.5 | -9.3% | Below MA20, MA50, MA200 |
| ULTA | Ulta Beauty Inc | Consumer Cyclical | $453.93 | -4.40% | 2026-06-17 | 40.5 | -19.1% | Below MA20, MA50, MA200 |
| LVS | Las Vegas Sands Corp | Consumer Cyclical | $46.78 | -2.25% | 2026-06-30 | 37.0 | -17.1% | Below MA20, MA50, MA200 |
| T | AT&T, Inc | Communication Services | $20.84 | -26.37% | 2026-07-01 | 31.5 | -19.0% | Below MA20, MA50, MA200 |
| CPRT | Copart, Inc | Industrials | $28.61 | -41.70% | 2026-06-29 | 37.5 | -23.8% | Below MA20, MA50, MA200 |
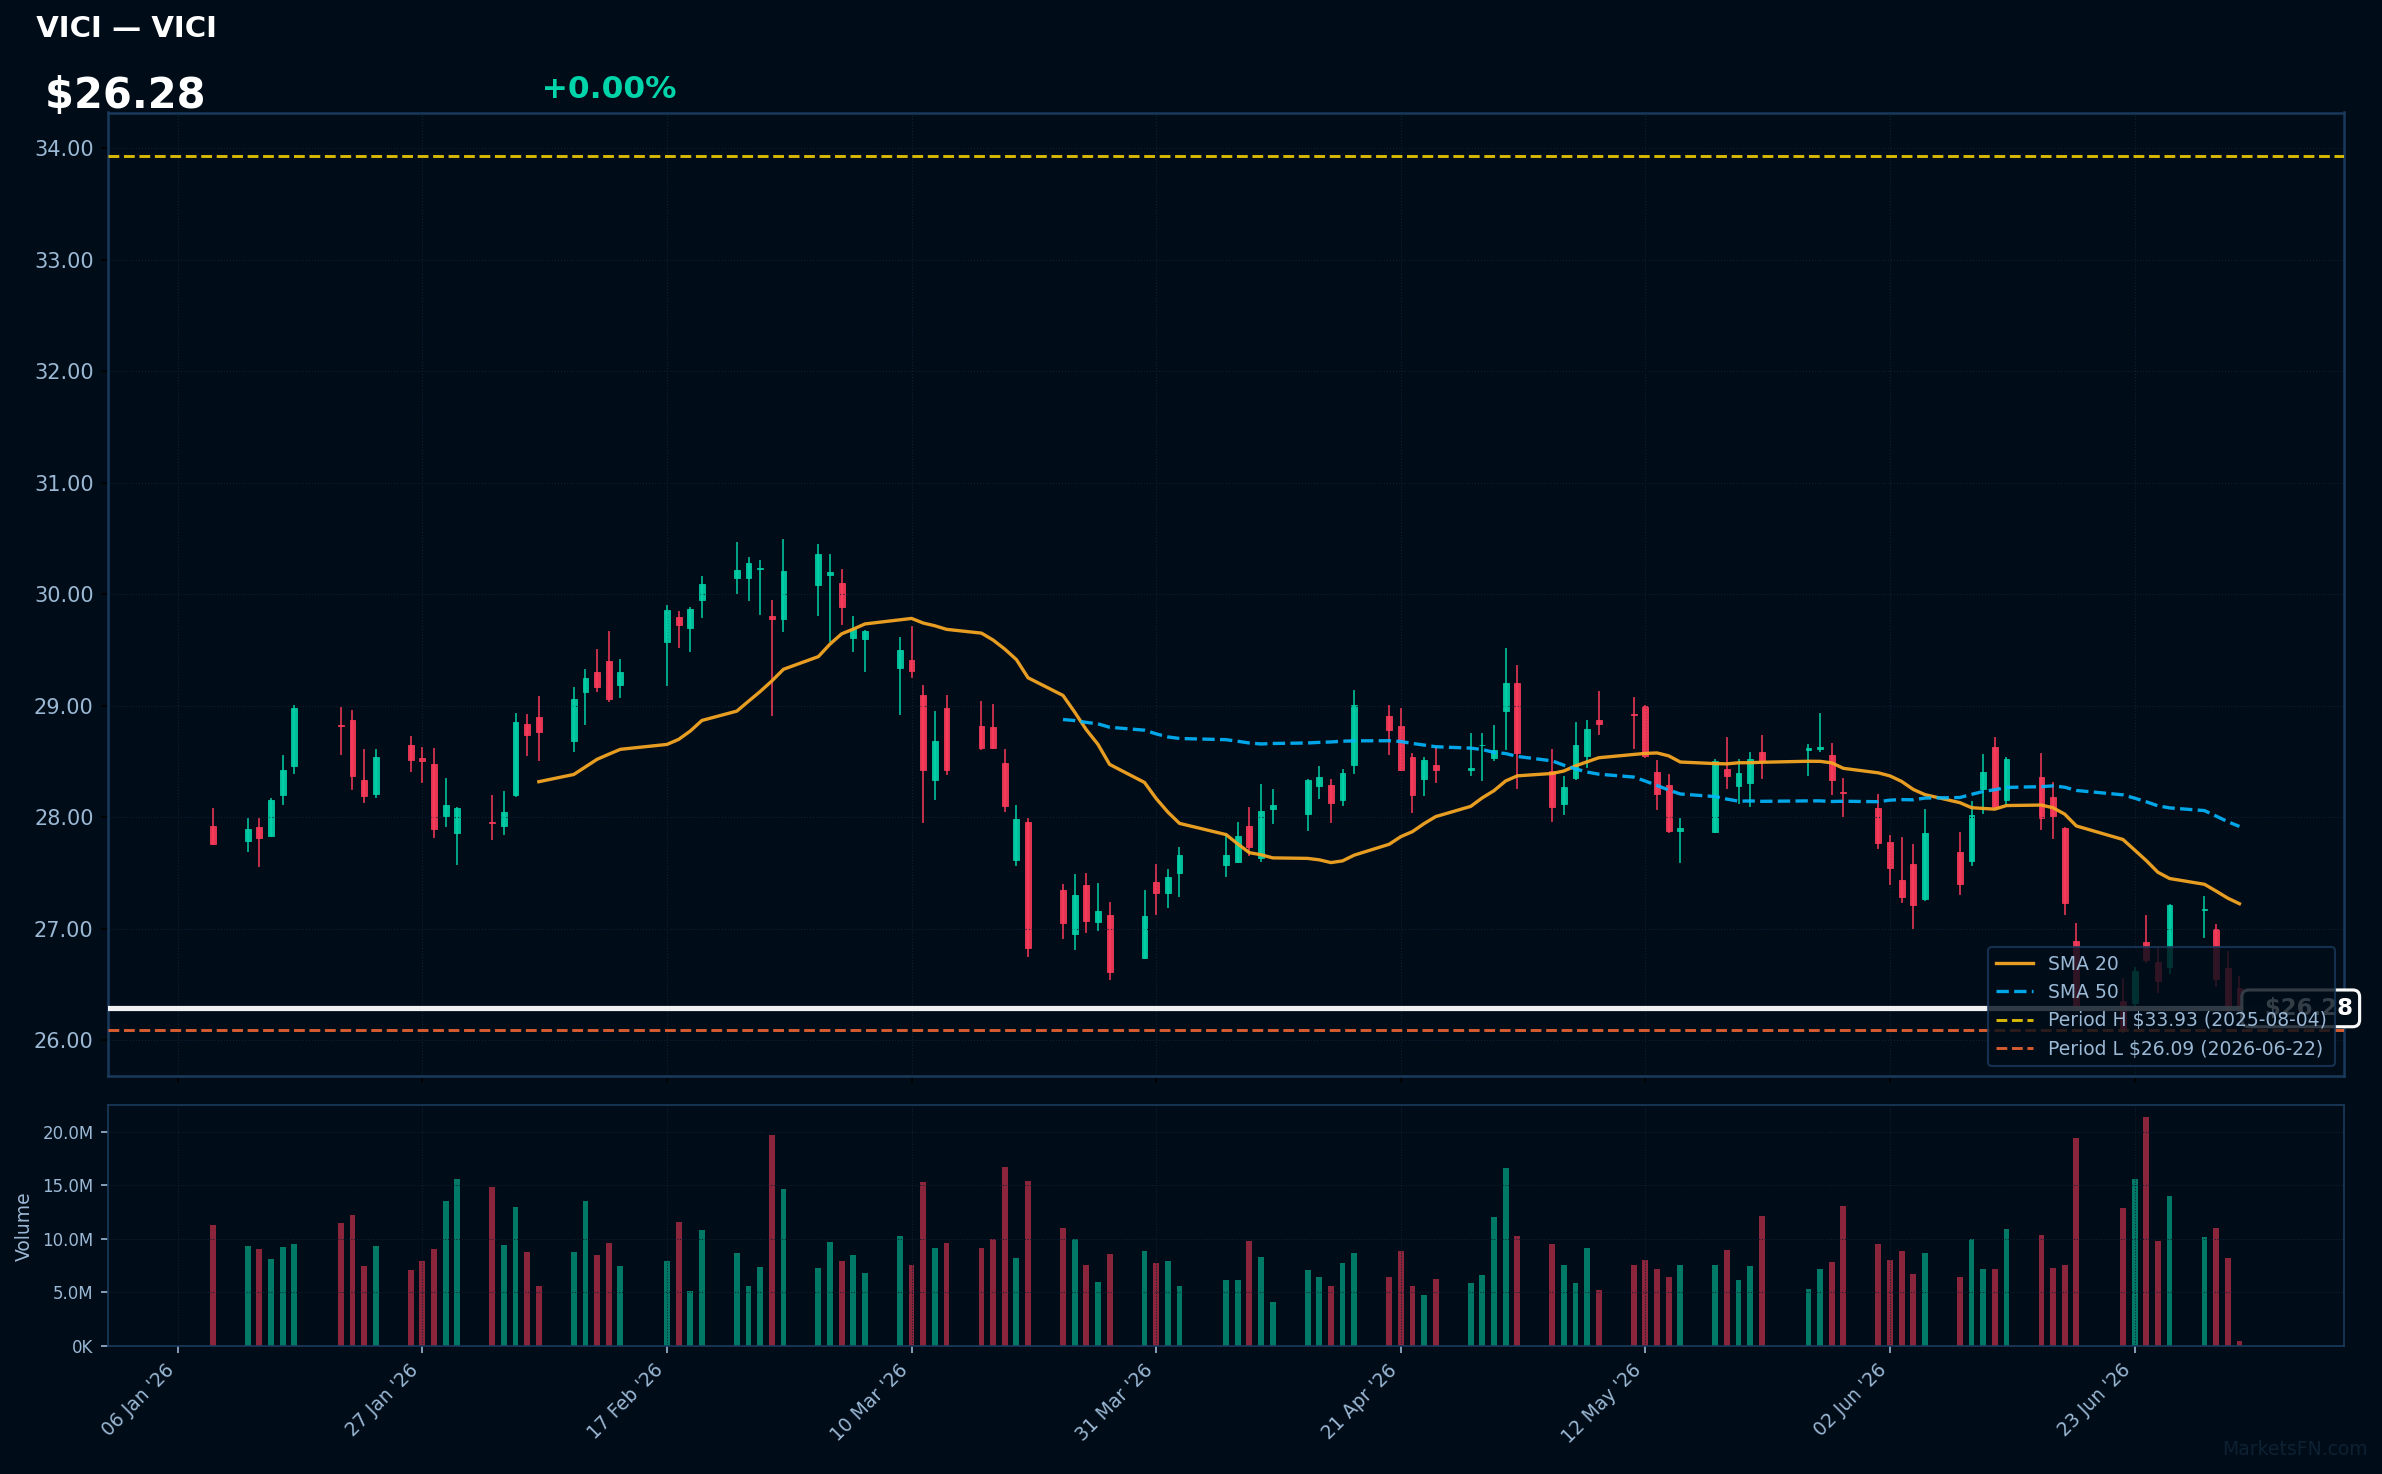
VICI | VICI Properties Inc | Real Estate | Price Last: $26.27 | % Realized: -21.13% | RSI: 38.5 | % above MA200: -9.3% | Trend: Below MA20, MA50, MA200
VICI Properties Inc is a real estate investment trust (REIT) that owns and leases gaming, hospitality, and entertainment properties. Investors should care due to its focus on a niche market with potential for stable cash flows and growth in the gaming sector.
The current technical situation indicates a bearish trend, with an RSI(14) of 38.5 and a MA alignment of price < MA20 < MA50 < MA200, suggesting a sustained downtrend. The stock is also 0.7% above its 52-Week low, testing major support.
Related headlines
- VICI Properties Inc. Announces Release Date for Second Quarter 2026 Results
- VICI Properties Inc. Completes Sale-Leaseback of Canadian Portfolio in Connection With Pure Casino Entertainment's Acquisition of Gamehost
- VICI Properties and Club Med Announce Acquisition and Redevelopment of Carambola Beach Resort in St. Croix
- CLUB MED ADVANCES STRATEGIC NORTH AMERICAN EXPANSION WITH THE REDEVELOPMENT OF CARAMBOLA BEACH RESORT IN ST. CROIX IN PARTNERSHIP WITH VICI PROPERTIES
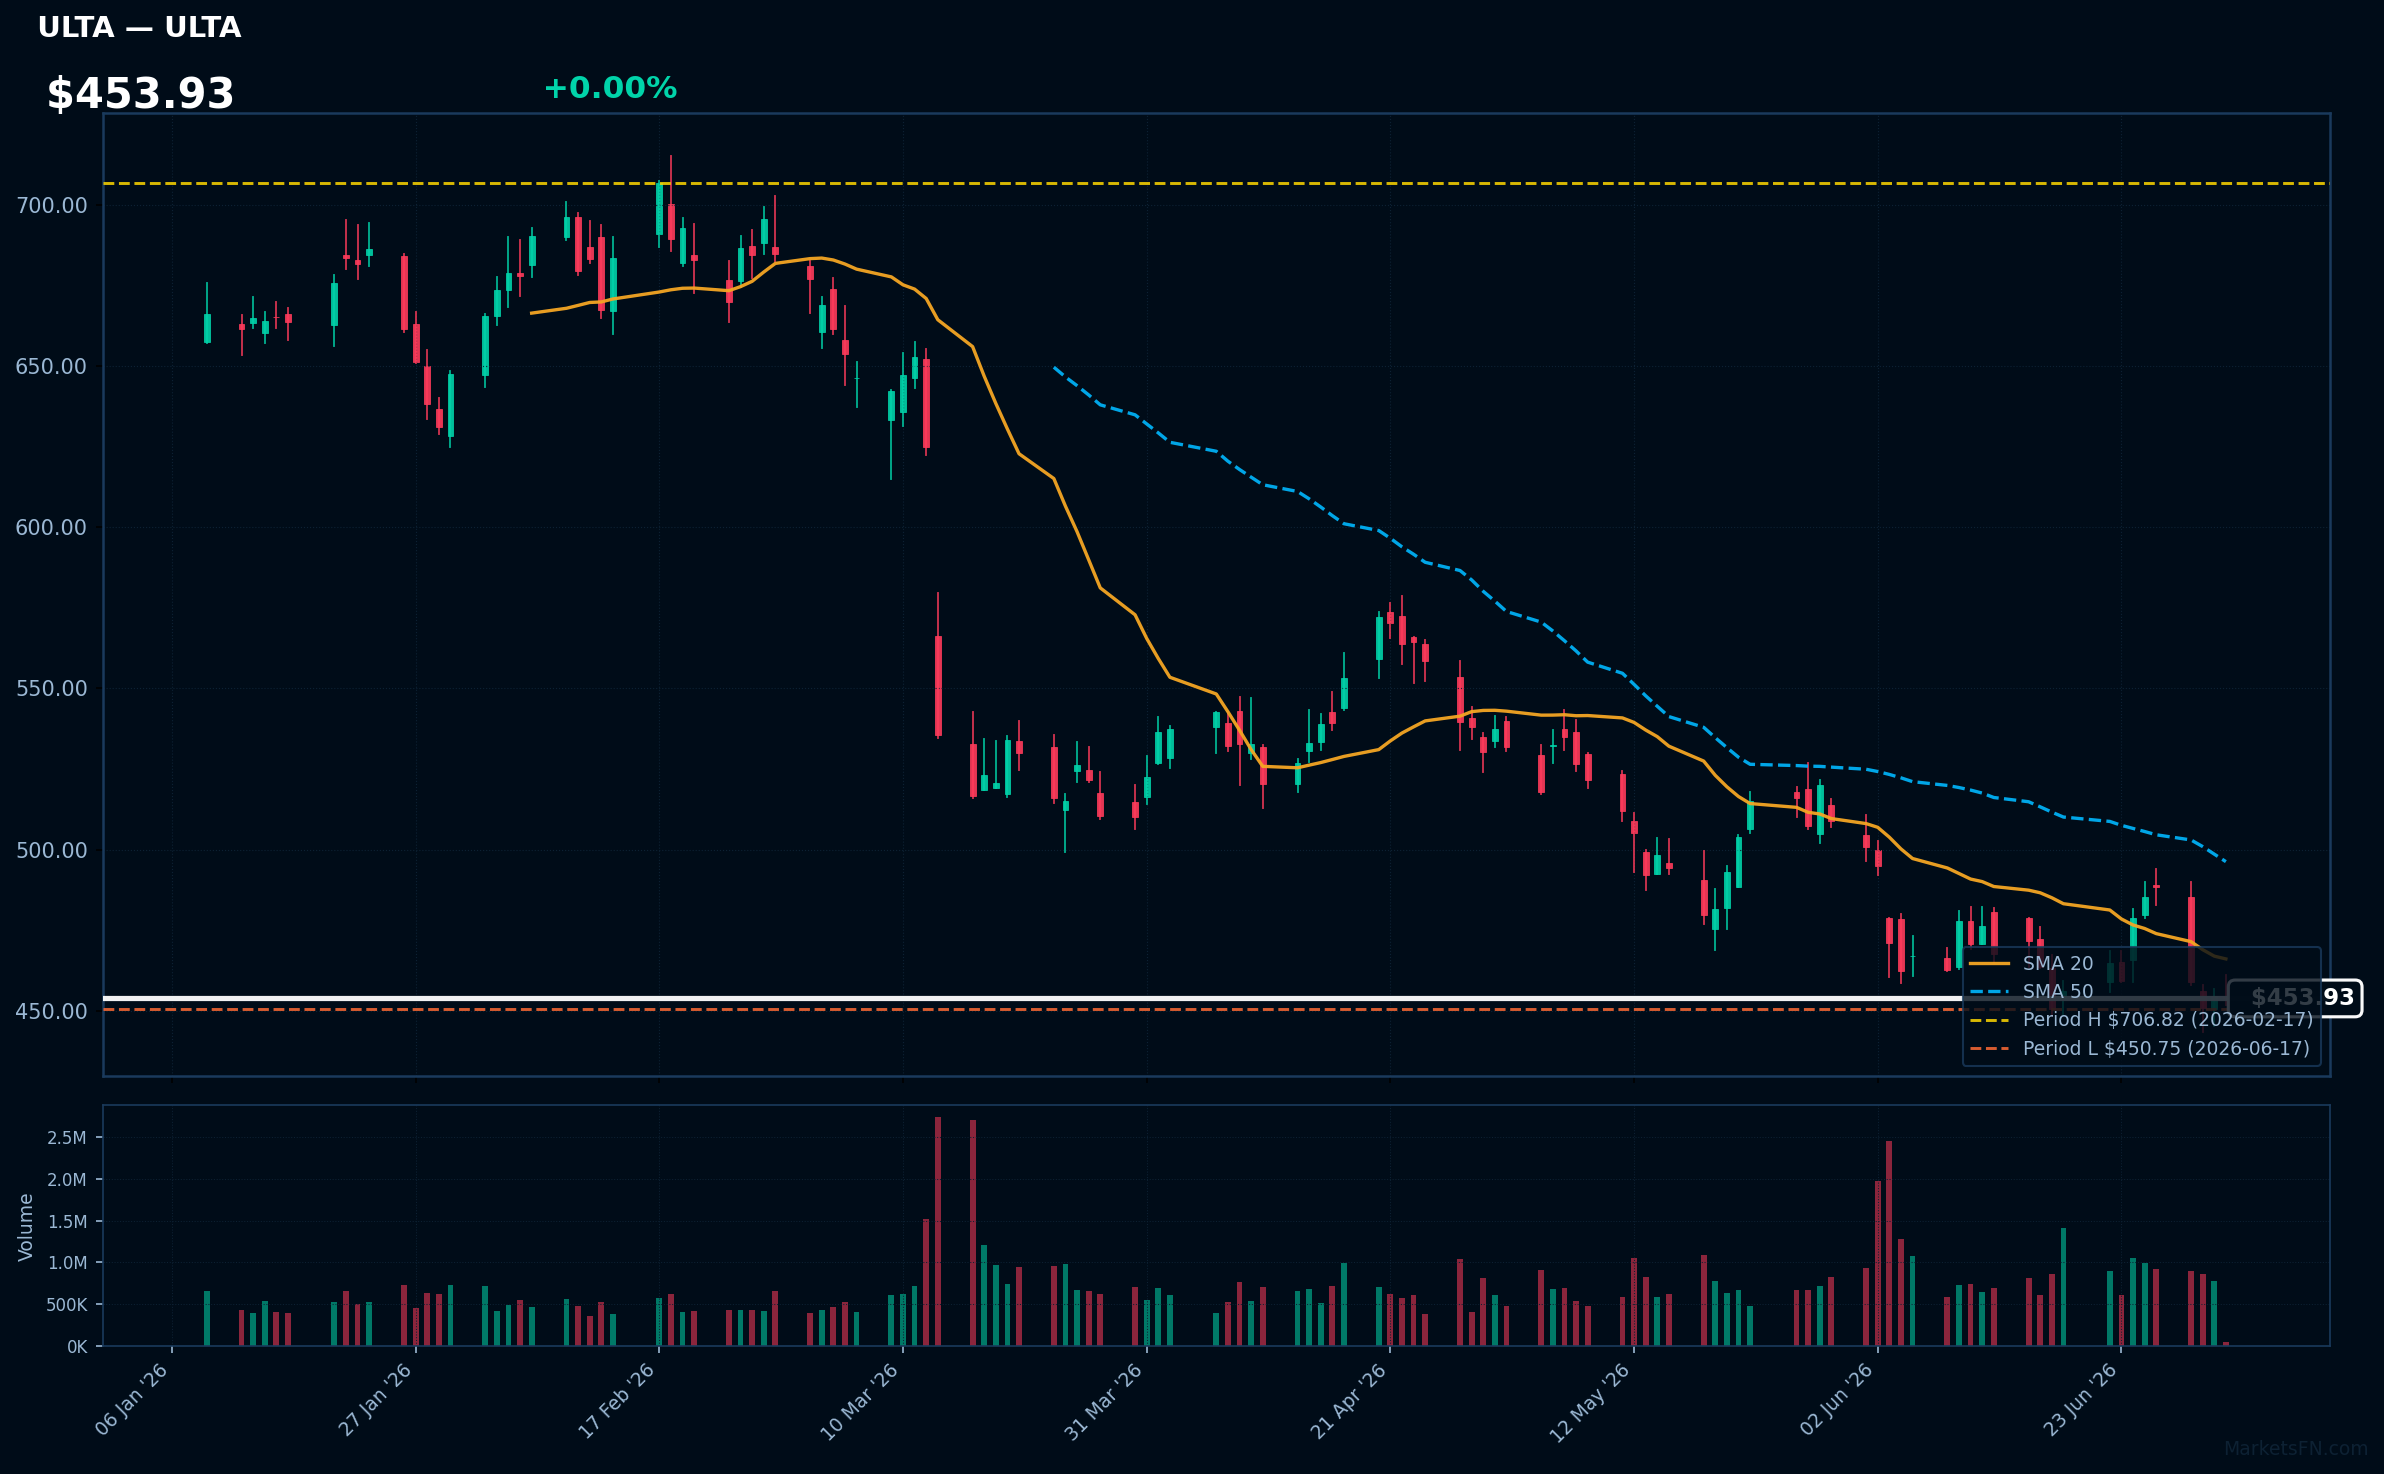
ULTA | Ulta Beauty Inc | Consumer Cyclical | Price Last: $453.93 | % Realized: -4.40% | RSI: 40.5 | % above MA200: -19.1% | Trend: Below MA20, MA50, MA200
Ulta Beauty Inc operates a chain of beauty stores offering cosmetics, skincare, and haircare products, along with salon services. Investors should care due to its strong market position and potential for growth in the beauty sector, which remains resilient despite economic fluctuations.
Currently, Ulta shows a bearish technical situation with an RSI(14) of 40.5 and a MA alignment indicating a sustained downtrend: price < MA20 < MA50 < MA200. The stock is also testing major support, being only 0.7% above its 52-Week low.
Related headlines
- Target to replace Ulta shops in 600+ stores with its in-house Beauty Studio
- Bath & Body Works Ulta Beauty launch may expand reach, but channel shift risks remain: Jefferies
- Ulta Beauty CMO on Evolving a 47 Million-Member Loyalty Program into a Relationship Engine
- Bath & Body Works is bringing its products to 600 Ulta Beauty stores
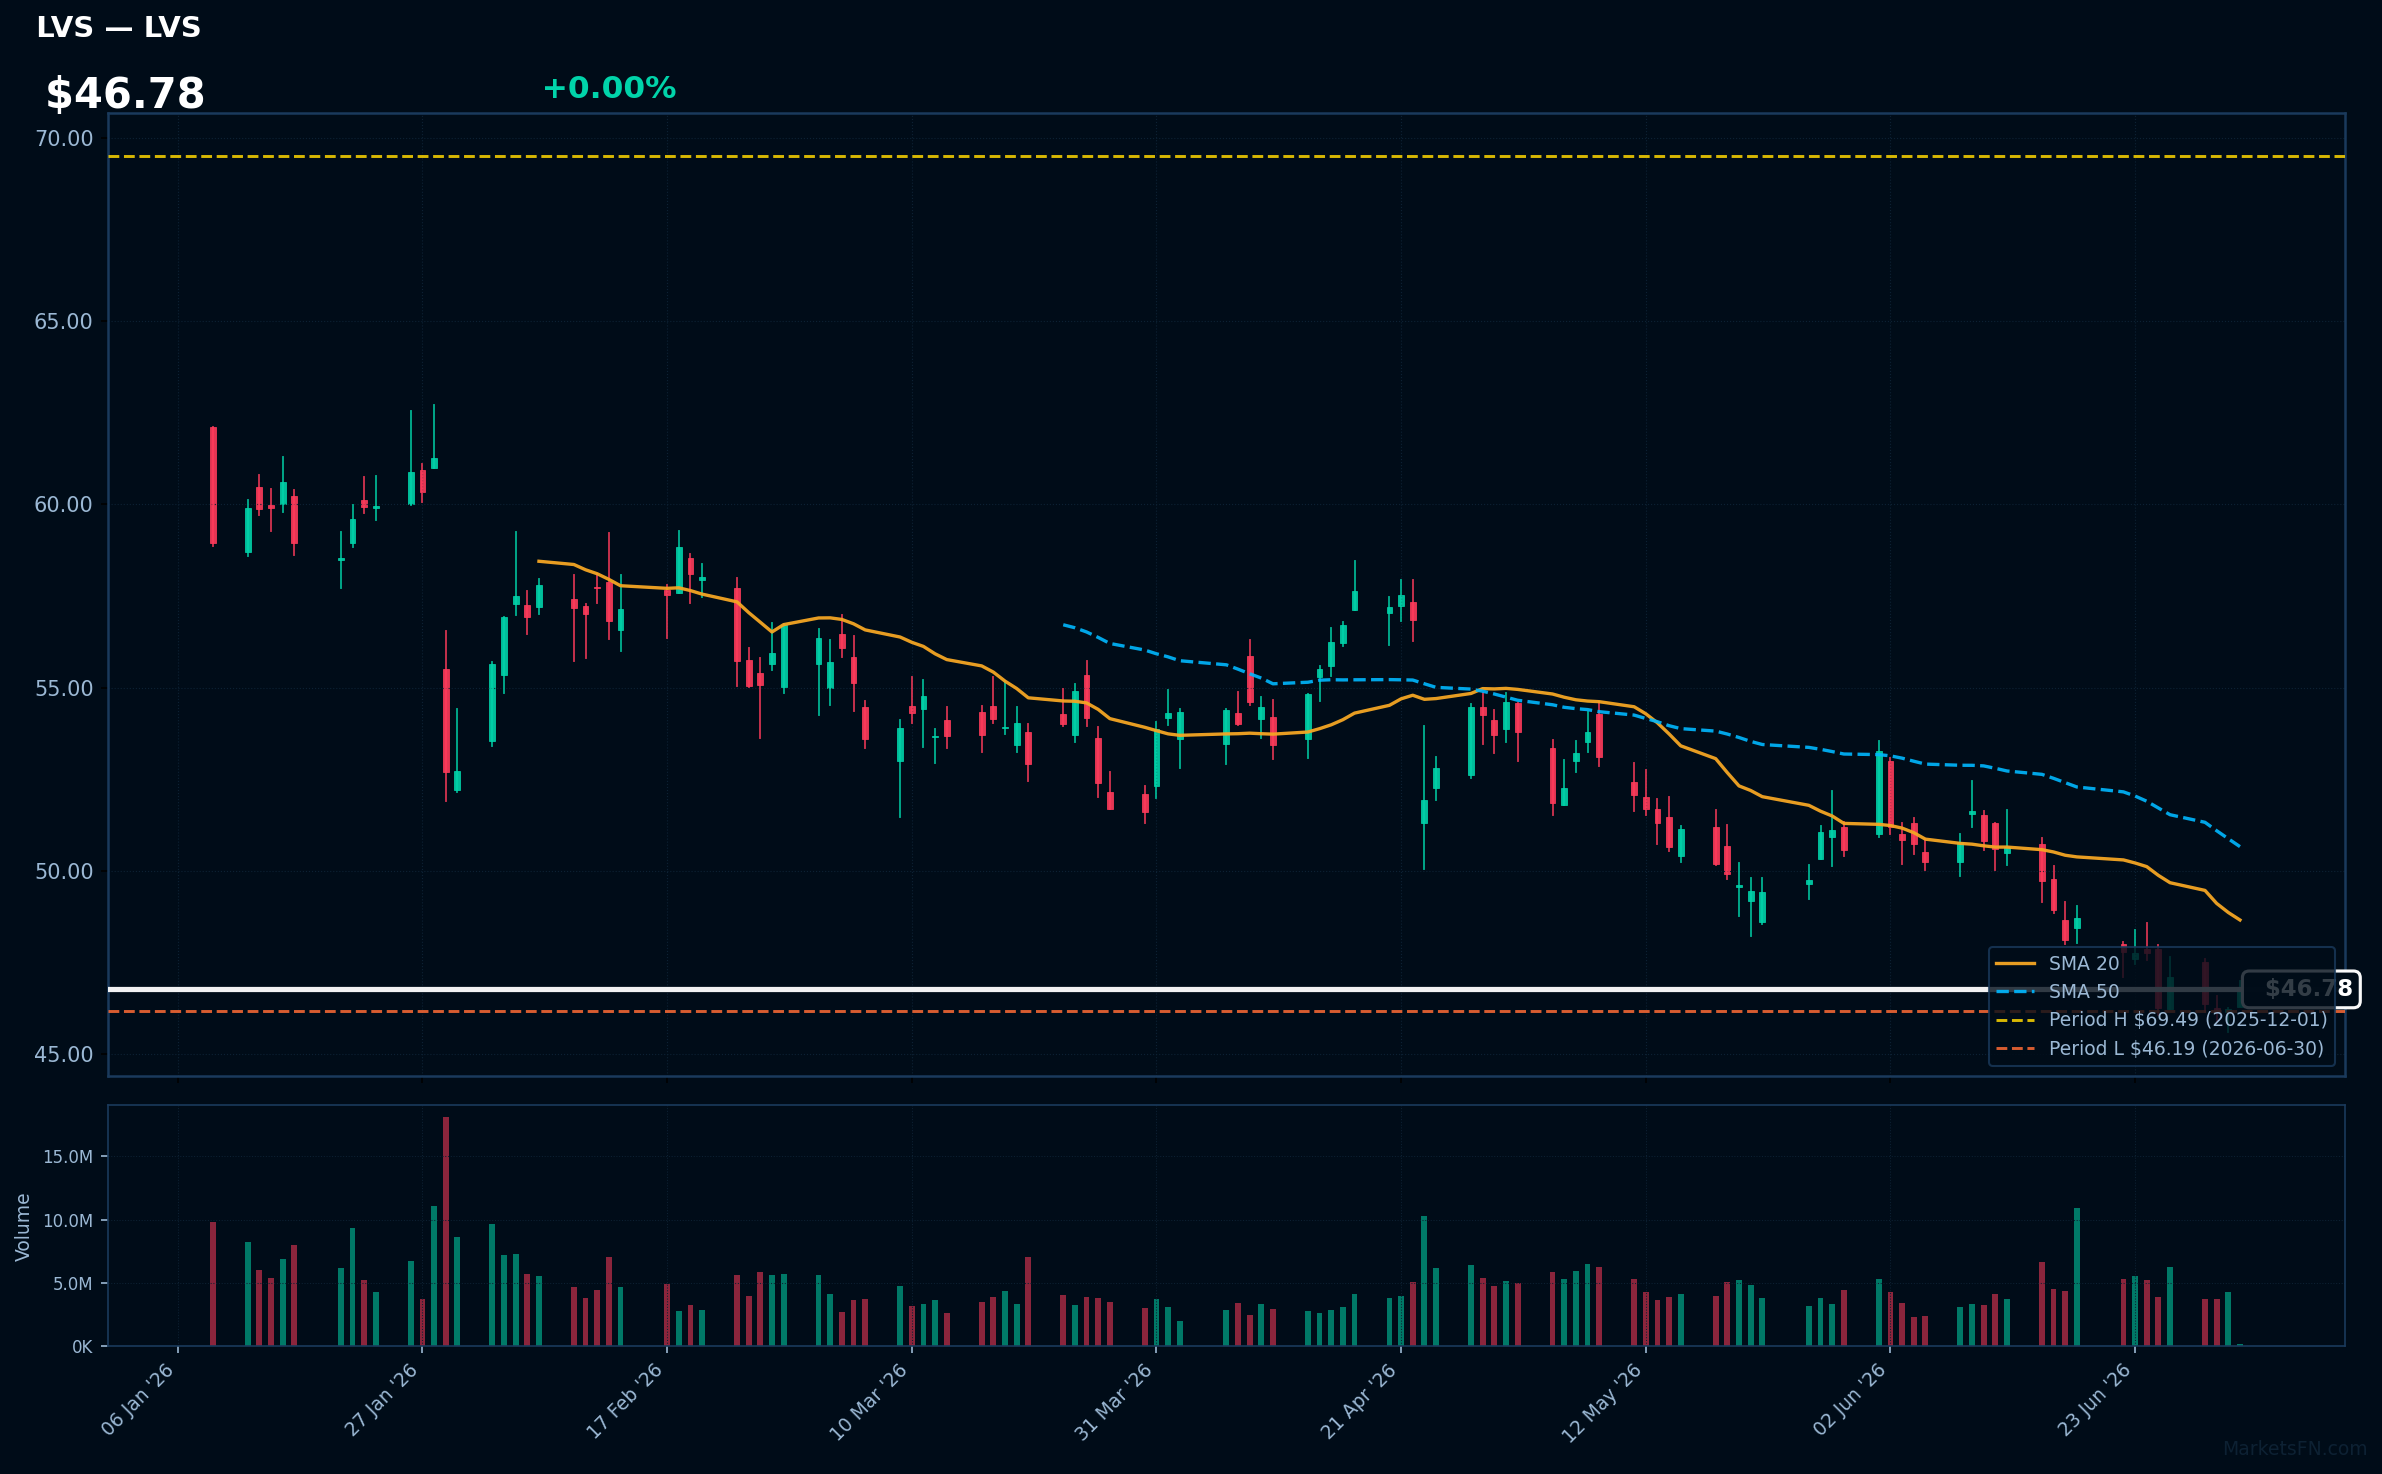
LVS | Las Vegas Sands Corp | Consumer Cyclical | Price Last: $46.78 | % Realized: -2.25% | RSI: 37.0 | % above MA200: -17.1% | Trend: Below MA20, MA50, MA200
Las Vegas Sands Corp operates integrated resorts, primarily in Asia and the U.S., focusing on gaming, hospitality, and entertainment. Investors should care due to its significant exposure to the recovering tourism sector, particularly in Macau, which can drive revenue growth and profitability.
The current technical situation indicates a bearish trend, with an RSI(14) of 37.0 and a MA alignment of price < MA20 < MA50 < MA200, suggesting sustained downtrend and potential warning signs for investors.
Related headlines
- Las Vegas Sands Continues its Commitment to Ending Youth Homelessness in Nevada with a $300,000 Donation to Nevada Partnership for Homeless Youth
- Las Vegas Sands Donates $150,000 to The LGBTQ+ Center of Las Vegas for a Workforce Development Program Supporting Housing-Insecure Youth
- MGMs $18B Bid Proves Las Vegas Sands Is Undervalued
- Las Vegas Sands Continues on the Dow Jones Best-in-Class Indices for World and North America
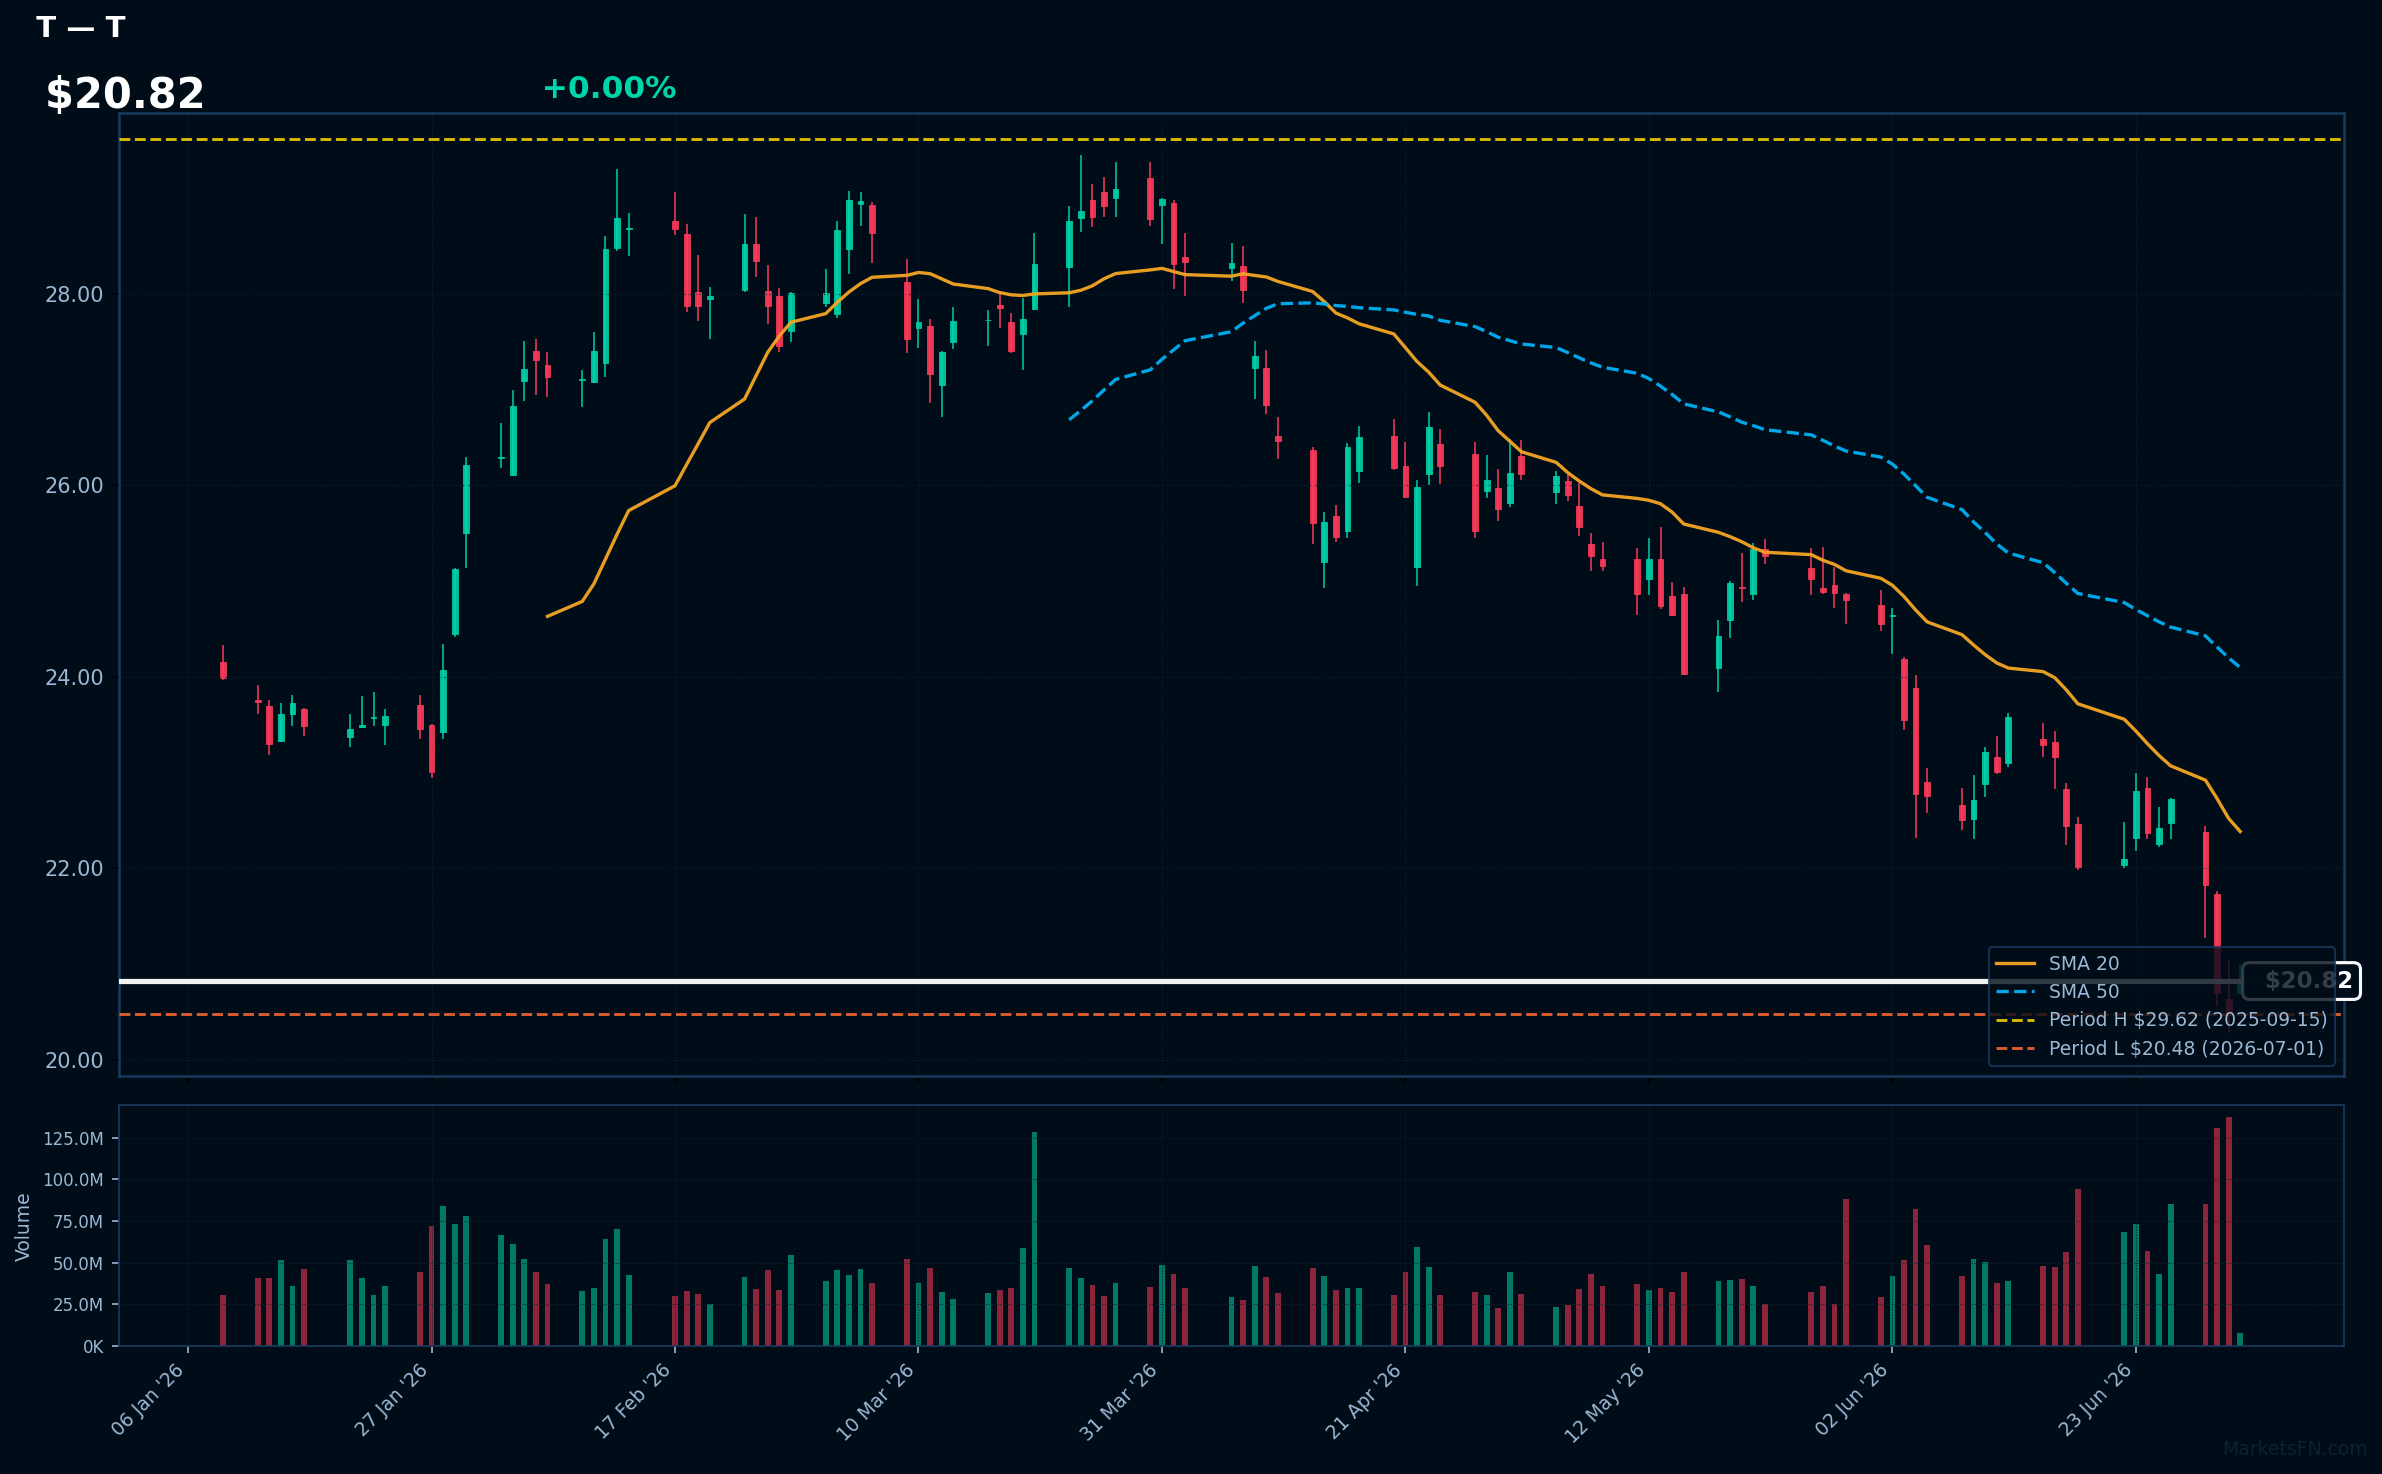
T | AT&T, Inc | Communication Services | Price Last: $20.84 | % Realized: -26.37% | RSI: 31.5 | % above MA200: -19.0% | Trend: Below MA20, MA50, MA200
AT&T, Inc. provides telecommunications, media, and technology services, including wireless communications, broadband, and digital entertainment. Investors should care due to its significant market presence and potential for dividends, despite recent performance challenges.
The current technical situation indicates a warning sign, with an RSI of 31.5 and a bearish MA alignment: price < MA20 < MA50 < MA200, suggesting a sustained downtrend.
Related headlines
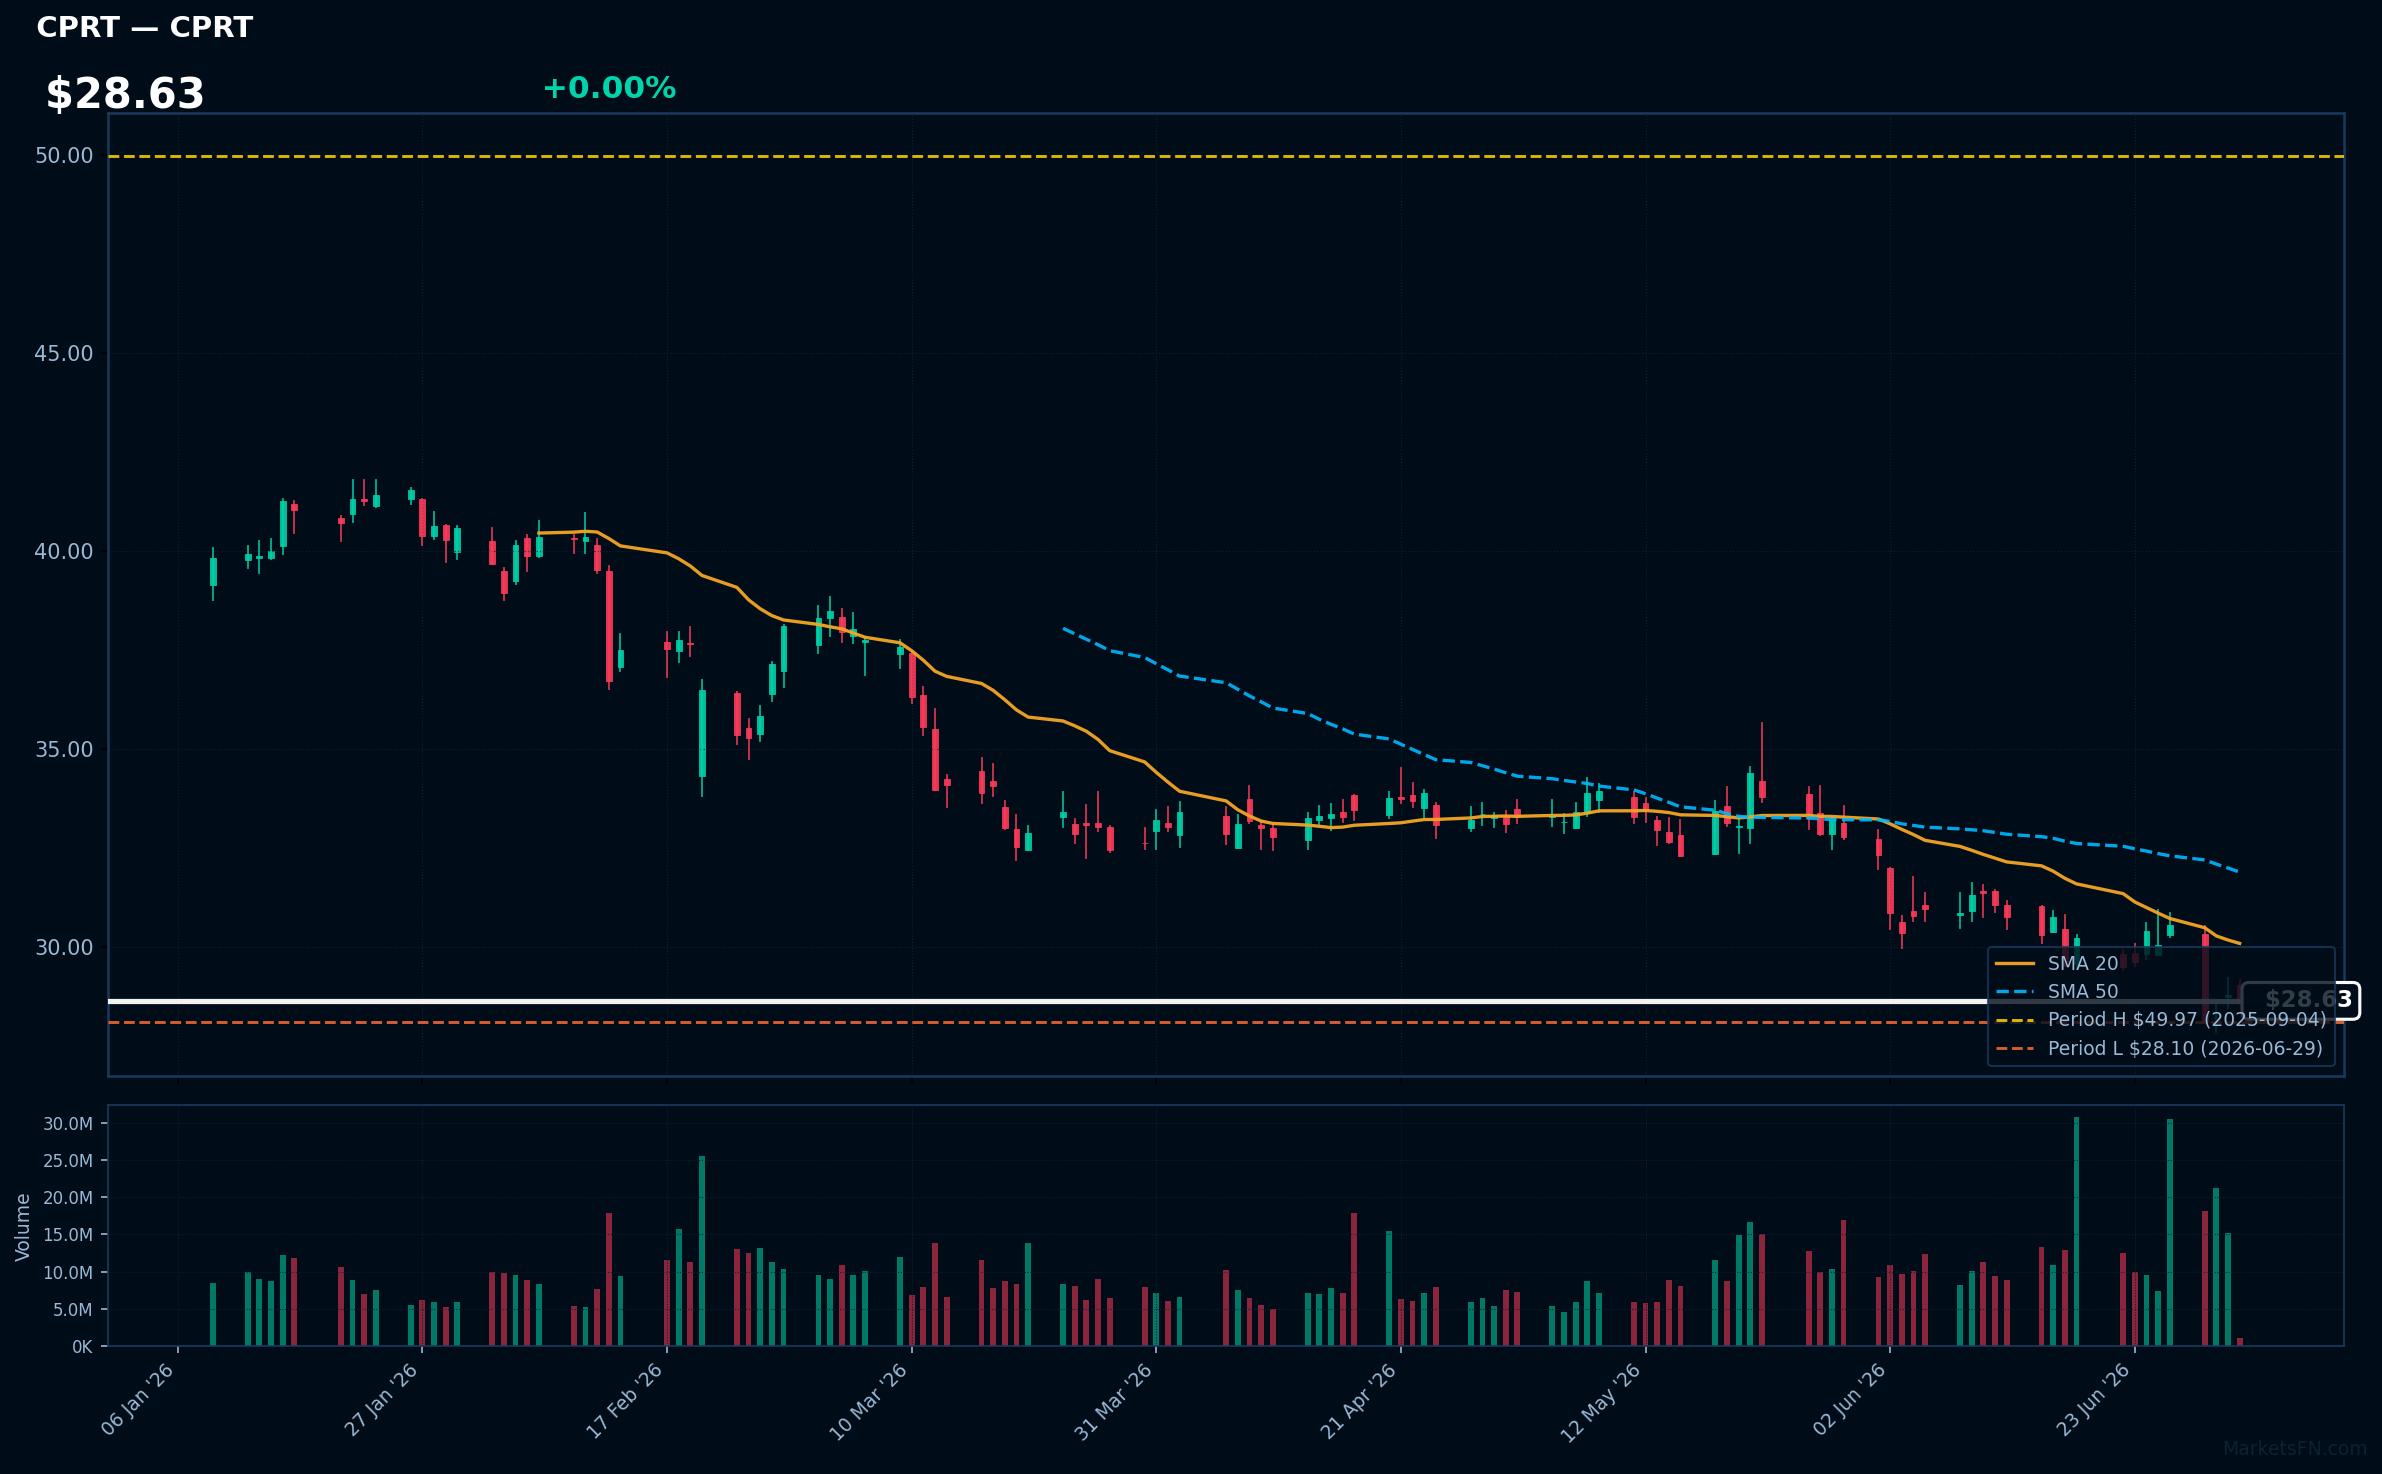
CPRT | Copart, Inc | Industrials | Price Last: $28.61 | % Realized: -41.70% | RSI: 37.5 | % above MA200: -23.8% | Trend: Below MA20, MA50, MA200
Copart, Inc. specializes in online vehicle auctions, facilitating the sale of salvage and clean title vehicles. Investors should care due to its significant market position and the potential for recovery in the automotive sector, especially as economic conditions evolve.
Currently, Copart shows bearish momentum with an RSI(14) of 37.5 and a bearish MA alignment: price < MA20 < MA50 < MA200. The stock is testing major support, being only 1.8% above its 52-Week low.
Related headlines
Market Commentary
The presence of S&P 500 stocks near 52-week extremes indicates heightened investor sentiment and potential volatility. Stocks like GE, UNH, LIN, UNP, and PANW are currently at 0.0% from their 52-week highs, suggesting strong momentum and confidence in these companies. Conversely, stocks such as VICI, ULTA, LVS, T, and CPRT, which are hovering above their 52-week lows, may reflect underlying concerns or sector-specific challenges, as they are only 0.7% to 1.8% above these lows.
This divergence can be attributed to sector rotation and macroeconomic themes. The stocks near their highs are likely benefiting from robust earnings reports, favorable market conditions, or sector-specific growth trends, while those near their lows may be facing headwinds from rising interest rates, inflationary pressures, or shifts in consumer behavior. Investors are increasingly selective, favoring sectors that demonstrate resilience and growth potential.
Key levels to watch include the 52-week highs for the outperformers, which could serve as psychological resistance points, while the lows for the underperformers may act as support levels. Potential catalysts for movement include upcoming earnings reports, economic data releases, and changes in monetary policy, which could significantly impact market sentiment and stock performance.
Methodology: All 503 S&P 500 constituents screened. 52-week high = highest daily close over the past 252 trading days (approx. 1 year). 52-week low = lowest daily close over the same period. Distance = (current price / extreme − 1) × 100. Technical indicators computed on up to 1 year of daily OHLCV data.
Disclaimer: For informational purposes only. Not investment advice. Past performance is not indicative of future results.