S&P 500 52-Week Highs & Lows Radar: JPMorgan Chase & (JPM), Netflix (NFLX) and more
· Stocks · MarketsFN Team
S&P 500 52-Week Highs & Lows Radar: JPMorgan Chase & (JPM), Netflix (NFLX) and more
Screening all 503 S&P 500 constituents for stocks nearest to their 52-week high and their 52-week low. Data as of June 25, 2026. % Realized = 52-week total return.
Legend: RSI > 70 = overbought · RSI < 30 = oversold · Green % Realized = positive 52W return · Red = negative.
📈 Nearest to 52-Week High
Sectors represented: Financial (2), Industrials (2), Real Estate (1)
| Ticker | Company | Sector | Price Last | % Realized | 52-Week High Date | RSI | % above MA200 | Trend |
|---|---|---|---|---|---|---|---|---|
| JPM | JPMorgan Chase & Co | Financial | $336.26 | +18.38% | 2026-06-25 | 68.4 | +9.2% | Above MA20, MA50, MA200 |
| BAC | Bank Of America Corp | Financial | $58.24 | +24.31% | 2026-06-25 | 74.5 | +11.2% | Above MA20, MA50, MA200 |
| GE | GE Aerospace | Industrials | $372.89 | +49.22% | 2026-06-25 | 75.9 | +21.4% | Above MA20, MA50, MA200 |
| CAT | Caterpillar Inc | Industrials | $1029.00 | +176.93% | 2026-06-25 | 66.8 | +50.9% | Above MA20, MA50, MA200 |
| WELL | Welltower Inc | Real Estate | $221.48 | +44.35% | 2026-06-25 | 61.7 | +13.1% | Above MA20, MA50, MA200 |
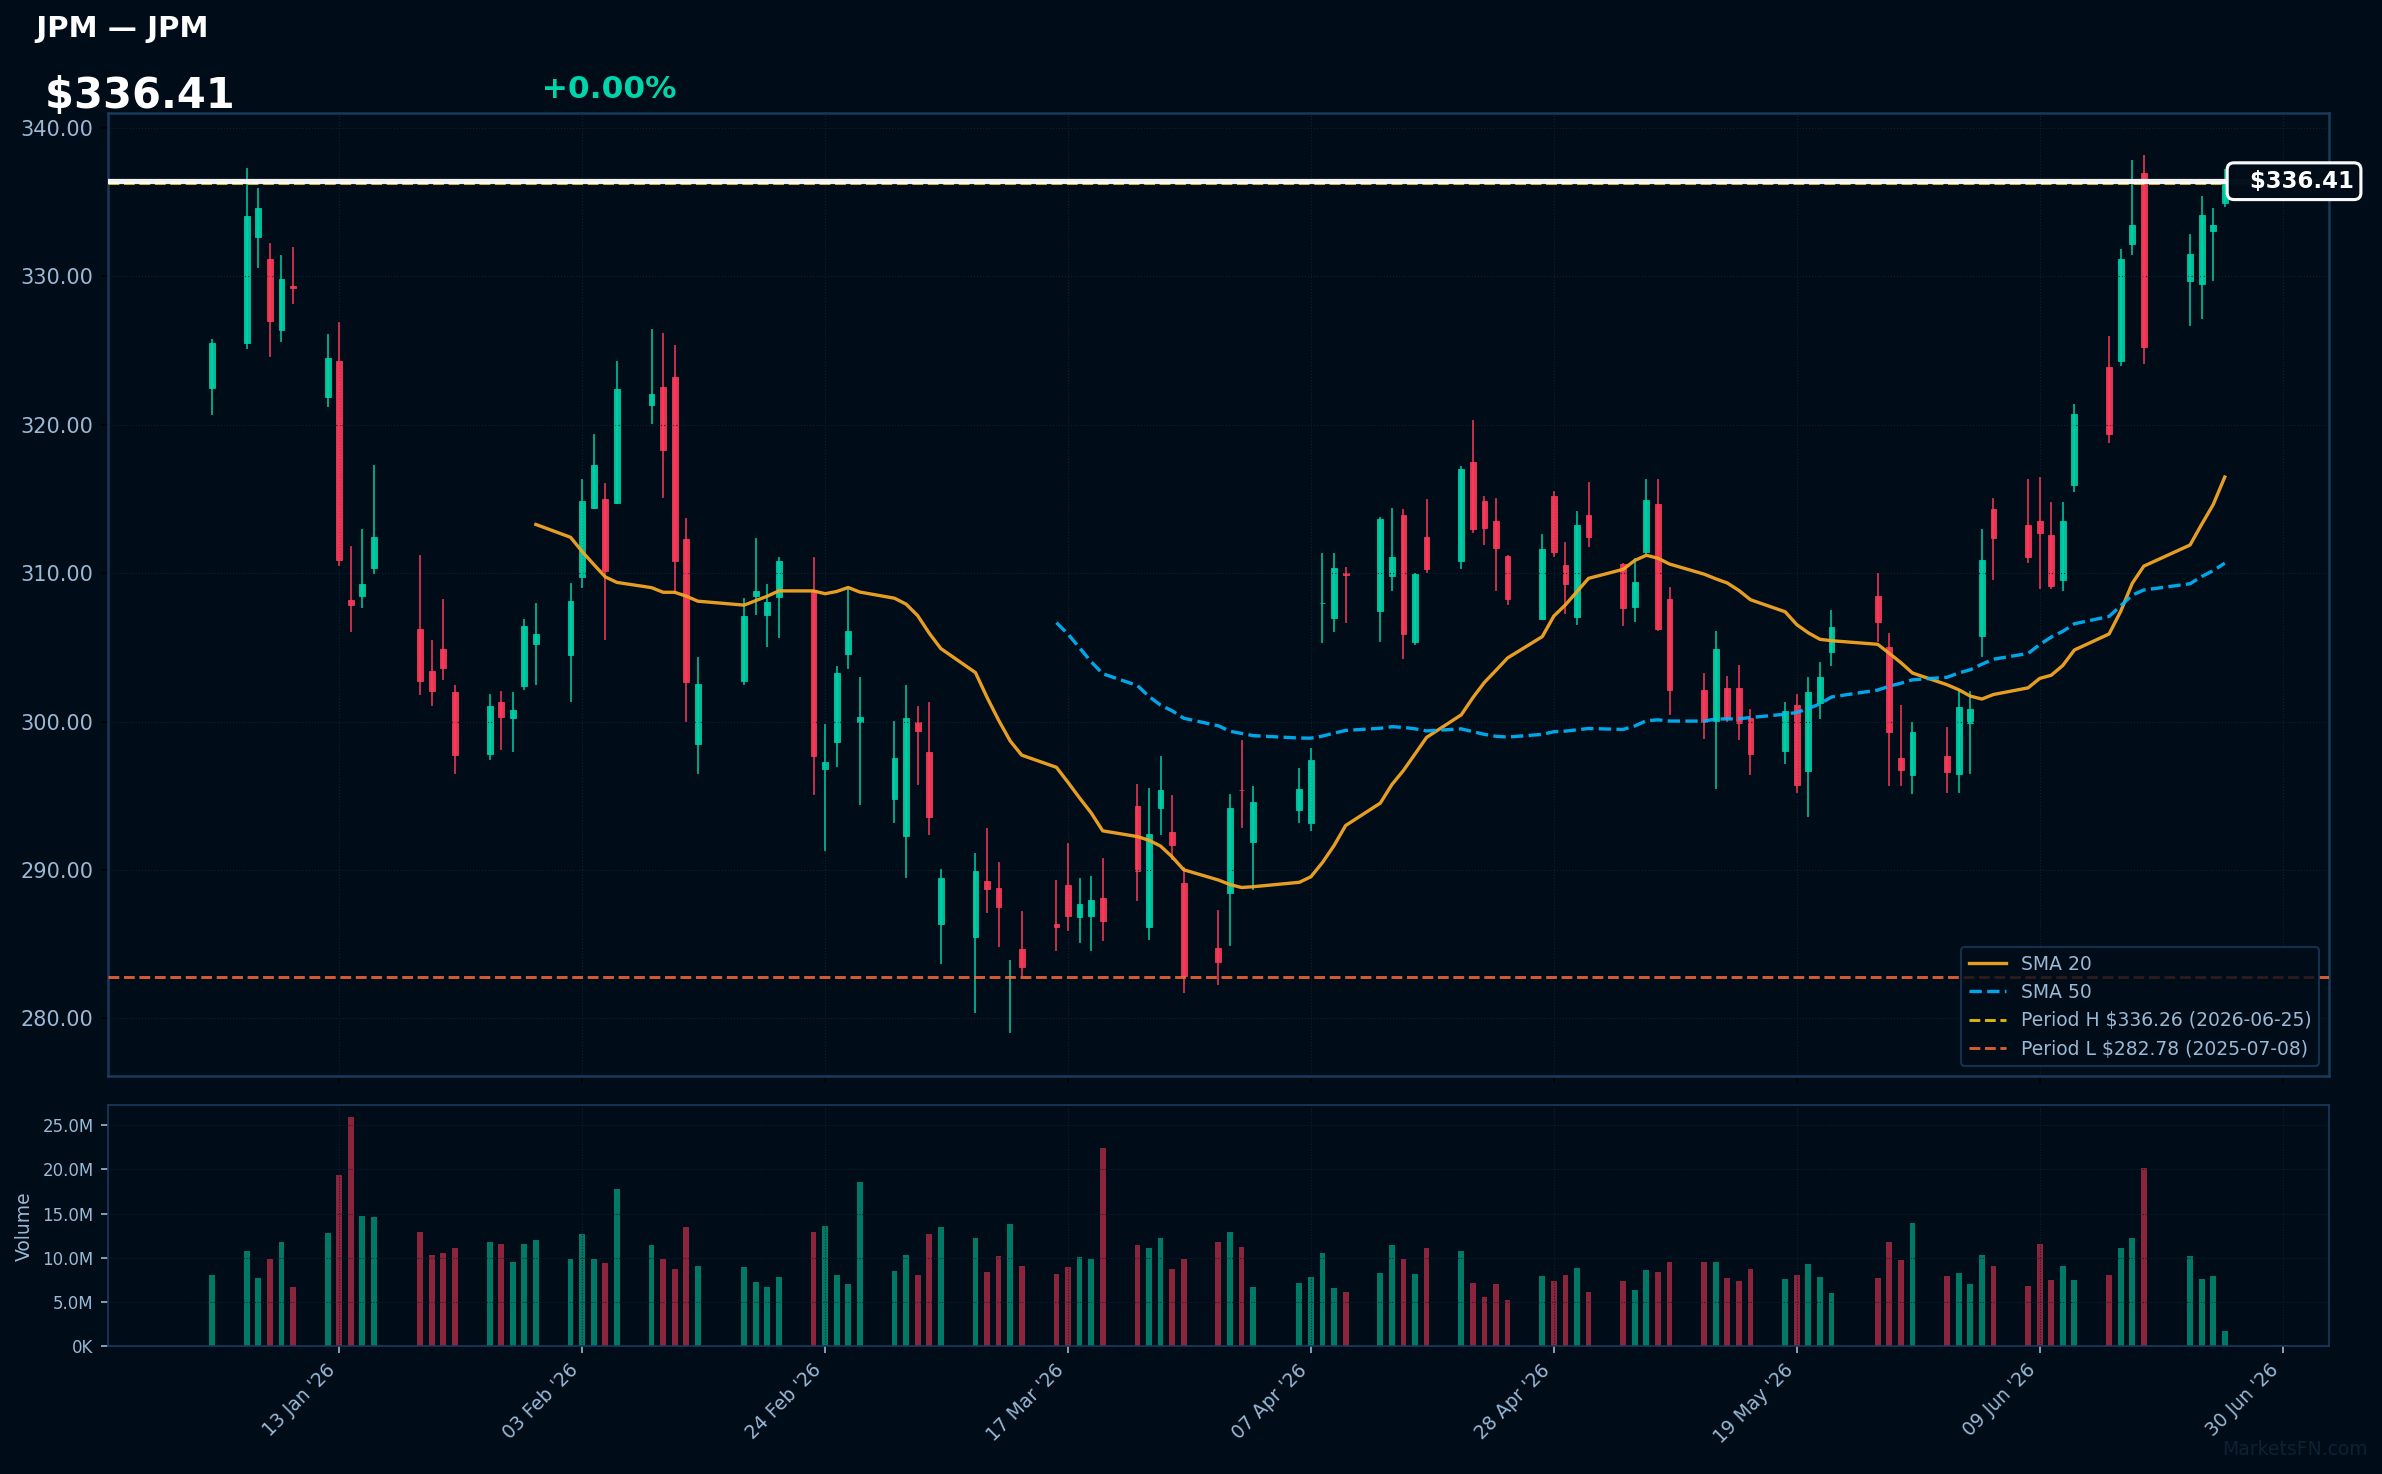
JPM | JPMorgan Chase & Co | Financial | Price Last: $336.26 | % Realized: +18.38% | RSI: 68.4 | % above MA200: +9.2% | Trend: Above MA20, MA50, MA200
JPMorgan Chase & Co is a global financial services firm providing consumer and investment banking, financial transactions processing, asset management, and private banking. Investors care due to its systemic importance and exposure to global economic trends.
JPMorgan Chase & Co is near a potential breakout at $336.41, 0.0% below its 52-Week high. The RSI(14) is 68.4, indicating strong momentum. The MA alignment is bullish with price > MA20 > MA50 > MA200, suggesting a sustained uptrend.
Related headlines
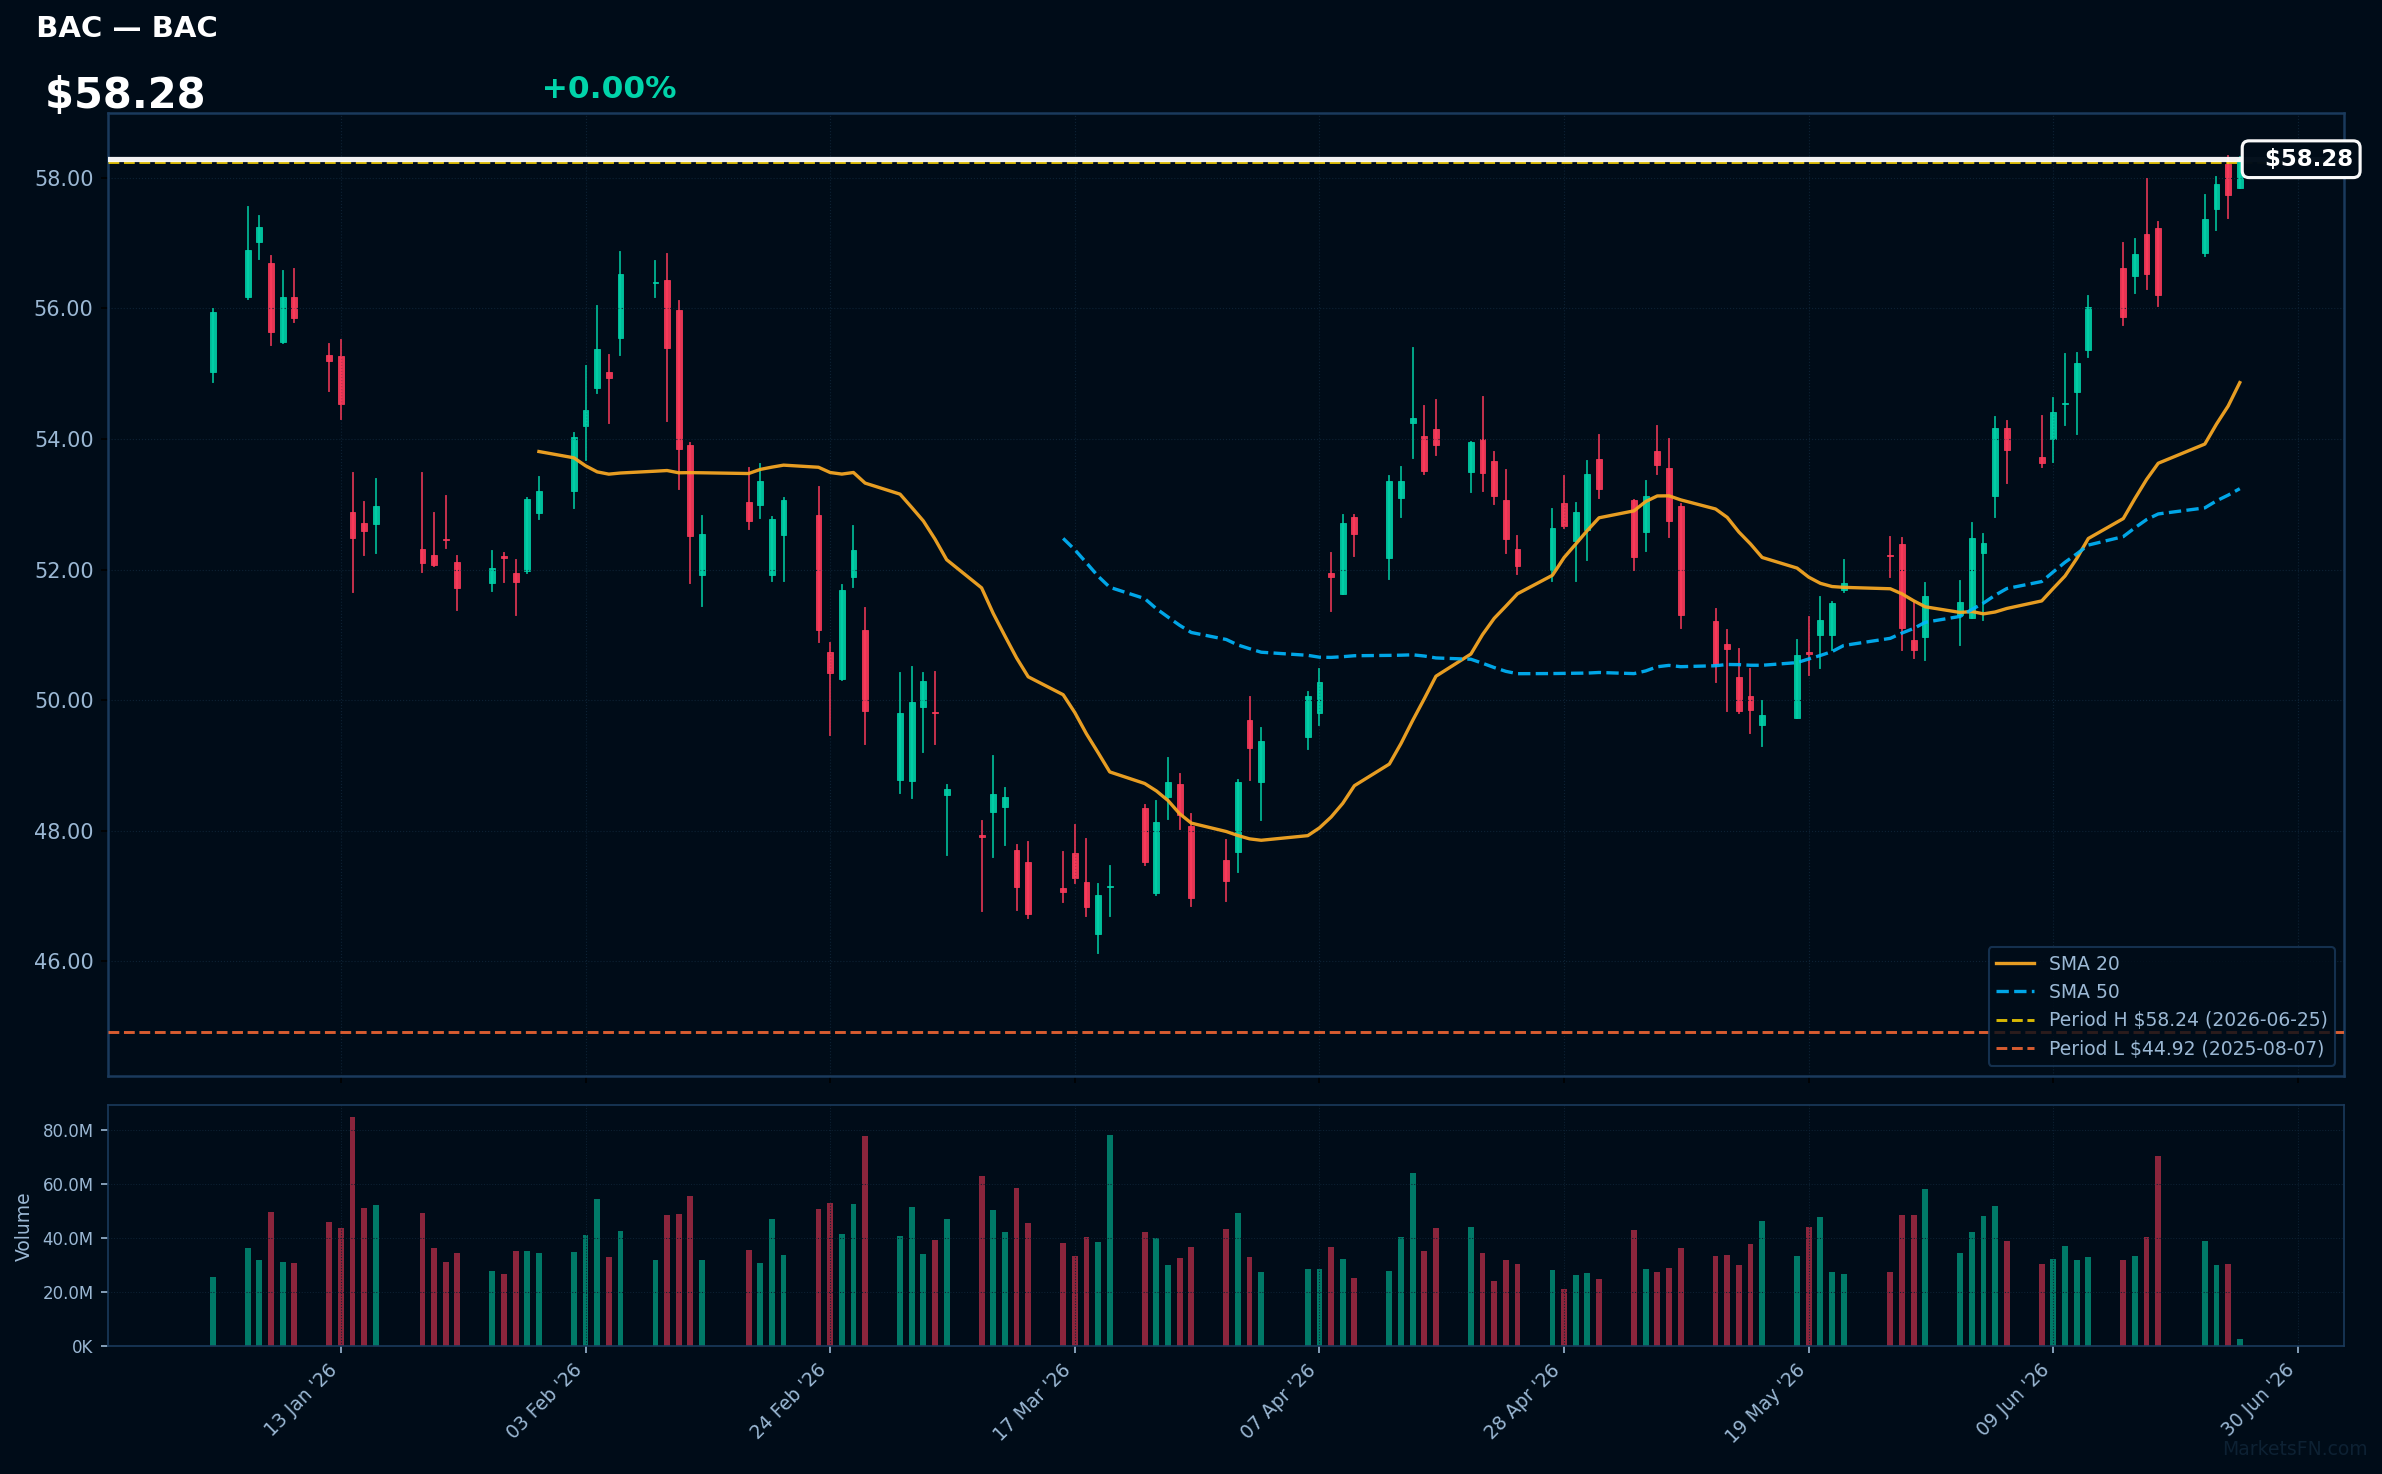
BAC | Bank Of America Corp | Financial | Price Last: $58.24 | % Realized: +24.31% | RSI: 74.5 | % above MA200: +11.2% | Trend: Above MA20, MA50, MA200
Bank Of America Corp is a multinational banking and financial services corporation. Investors should care about its performance as it is a significant player in the US banking sector, influencing the overall financial market.
The stock is near a potential breakout at its 52-Week high with an RSI(14) of 74.5, indicating strong momentum; MA alignment is bullish with price > MA20 > MA50 > MA200, suggesting a sustained uptrend.
Related headlines
- Big Banks Can Weather Severe Recession, Fed Says, in Unusual Year for Stress Tests
- Street Child United Announces #IAmSomebody Tour with Bank of America
- FedEx strong underlying momentum highlighted by Bank of America, as shares fall on near-term noise
- Bank of America Celebrates America 250 by Giving Customers Free Access to 250 Museums and Support for Cultural Programs Nationwide
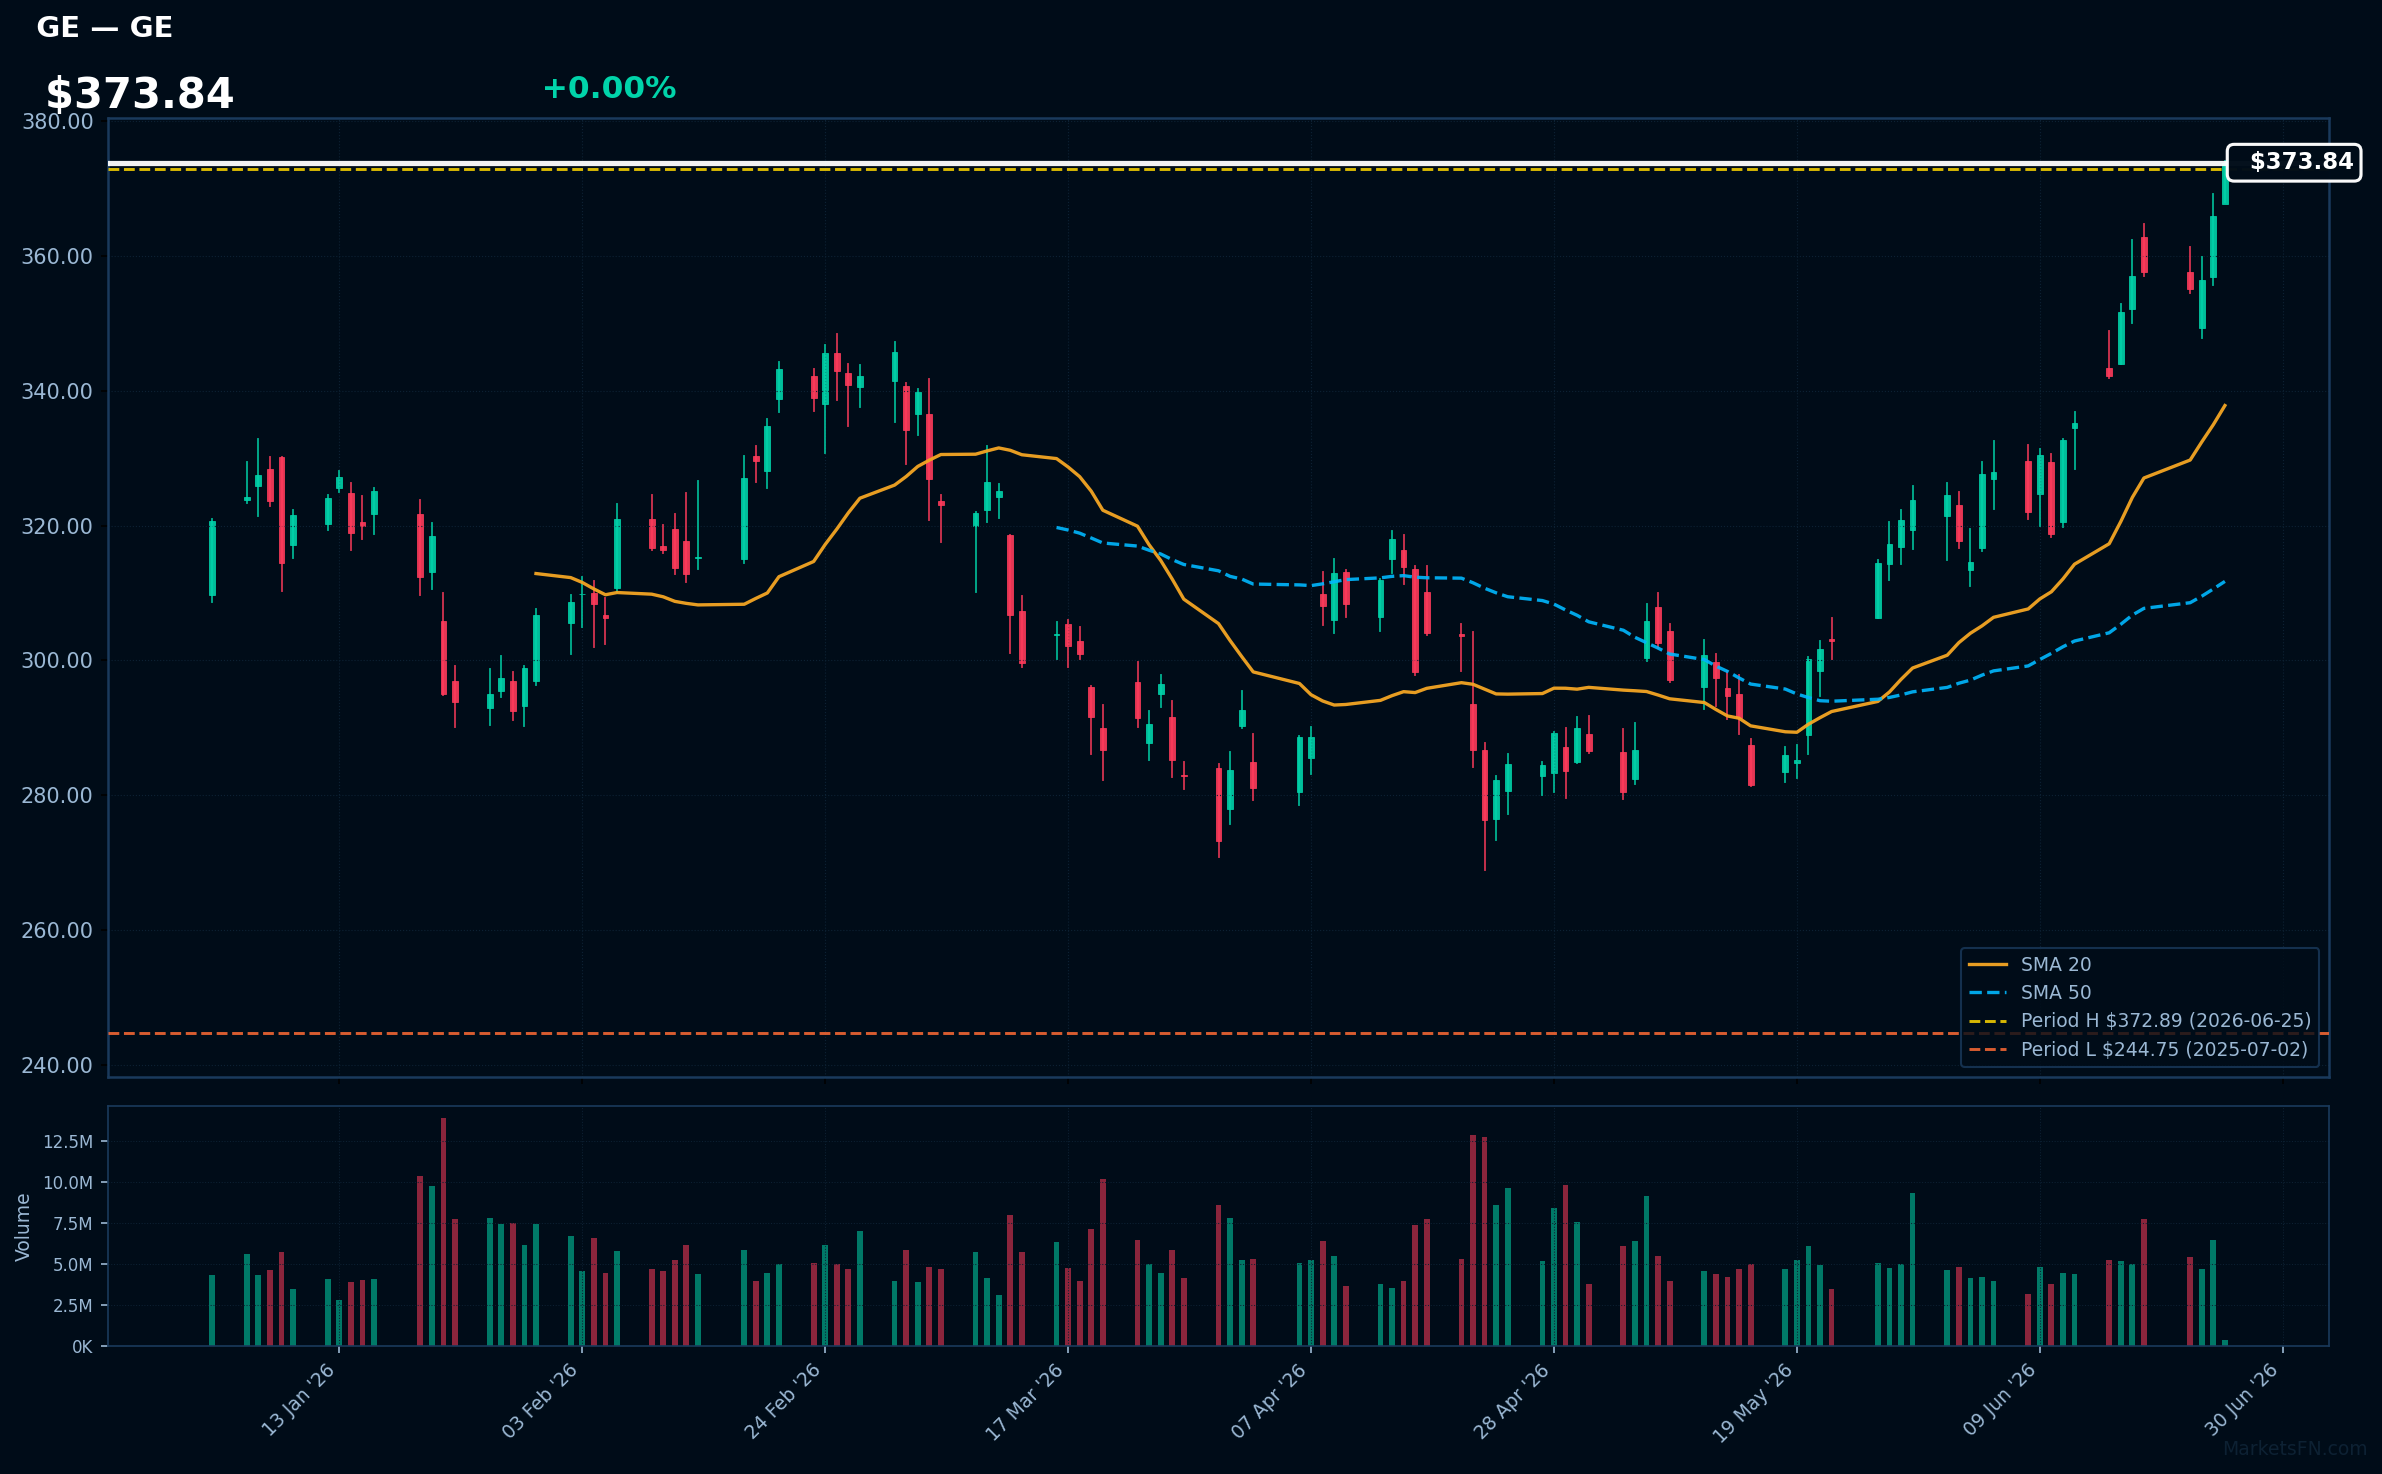
GE | GE Aerospace | Industrials | Price Last: $372.89 | % Realized: +49.22% | RSI: 75.9 | % above MA200: +21.4% | Trend: Above MA20, MA50, MA200
GE Aerospace is a leader in commercial and defense aviation, producing jet engines, components, and services. Investors should care about its dominant market position, aftermarket services revenue, and potential for long-term growth driven by increasing air travel demand and defense spending.
GE Aerospace's RSI(14) is 75.9, indicating strong momentum. The stock is in a sustained uptrend with price > MA20 > MA50 > MA200, and is 0.0% below its 52-Week high, suggesting potential for further breakout.
Related headlines
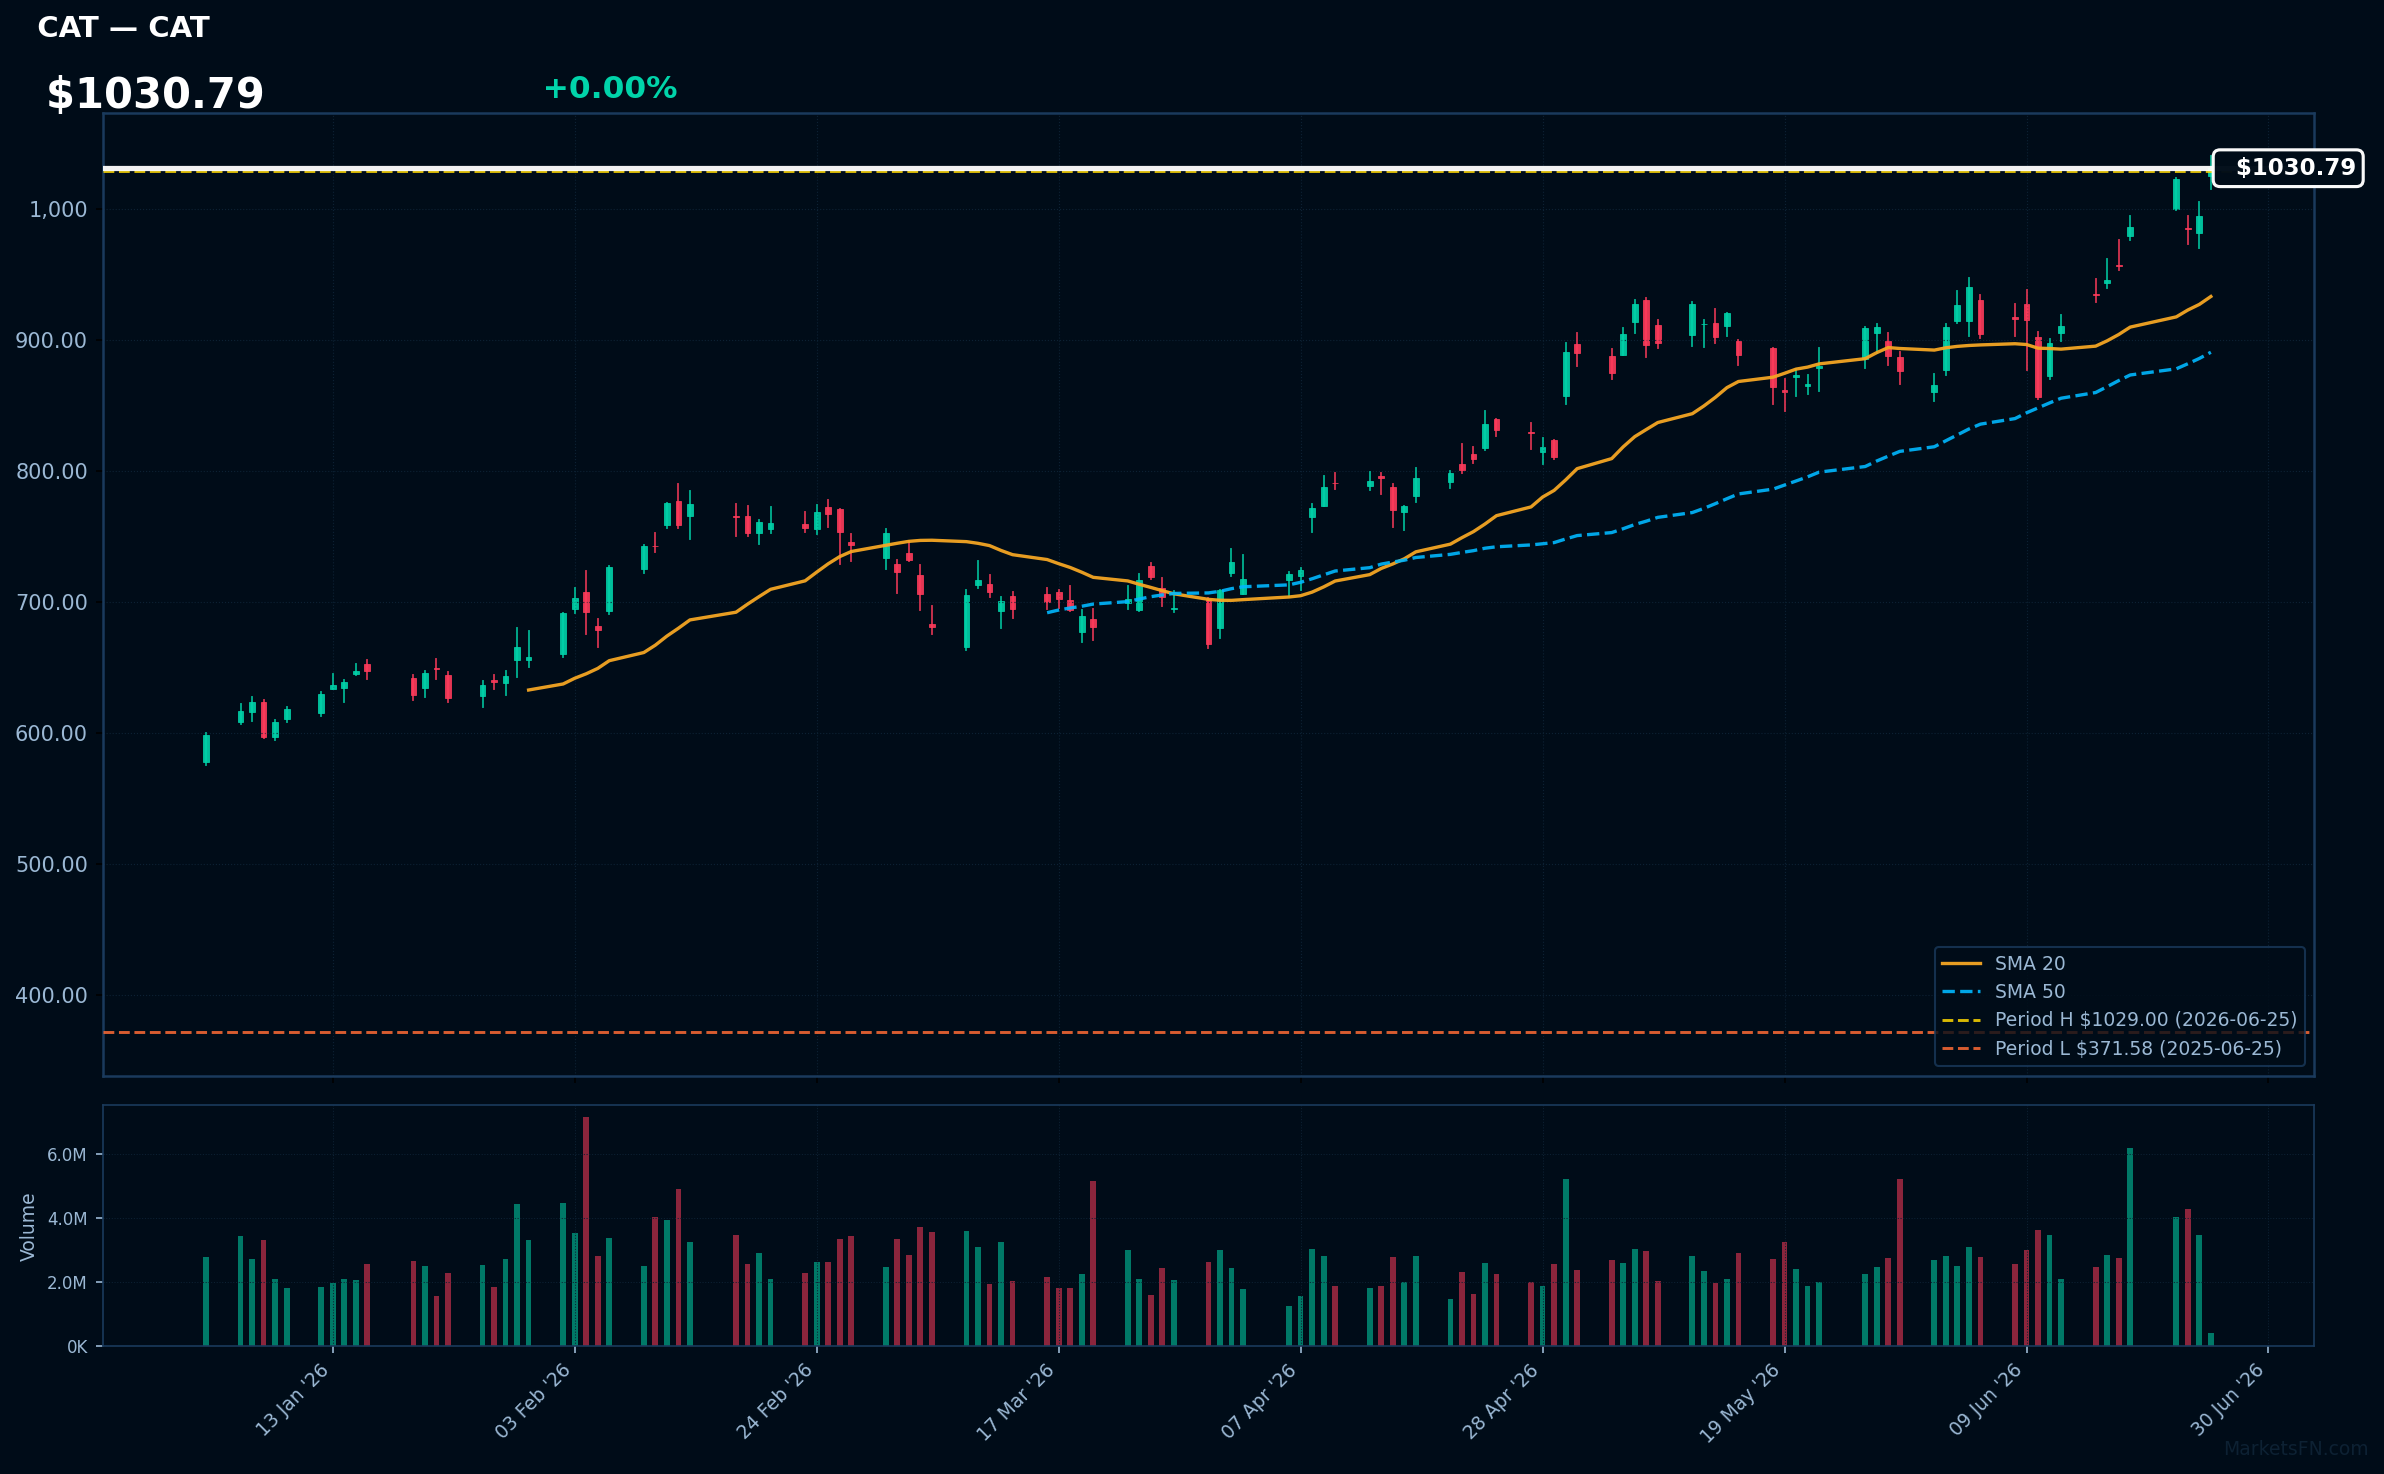
CAT | Caterpillar Inc | Industrials | Price Last: $1029.00 | % Realized: +176.93% | RSI: 66.8 | % above MA200: +50.9% | Trend: Above MA20, MA50, MA200
Caterpillar Inc is a leading manufacturer of heavy machinery used in construction, mining, and energy sectors. Investors should care because its performance is closely tied to global infrastructure spending and commodity prices, making it a key indicator of economic activity.
Caterpillar Inc is in a sustained uptrend with price > MA20 > MA50 > MA200, RSI(14) at 66.8, and is 0.0% below its 52-Week high, indicating strong momentum with no immediate signs of reversal, as the RSI is not overbought.
Related headlines
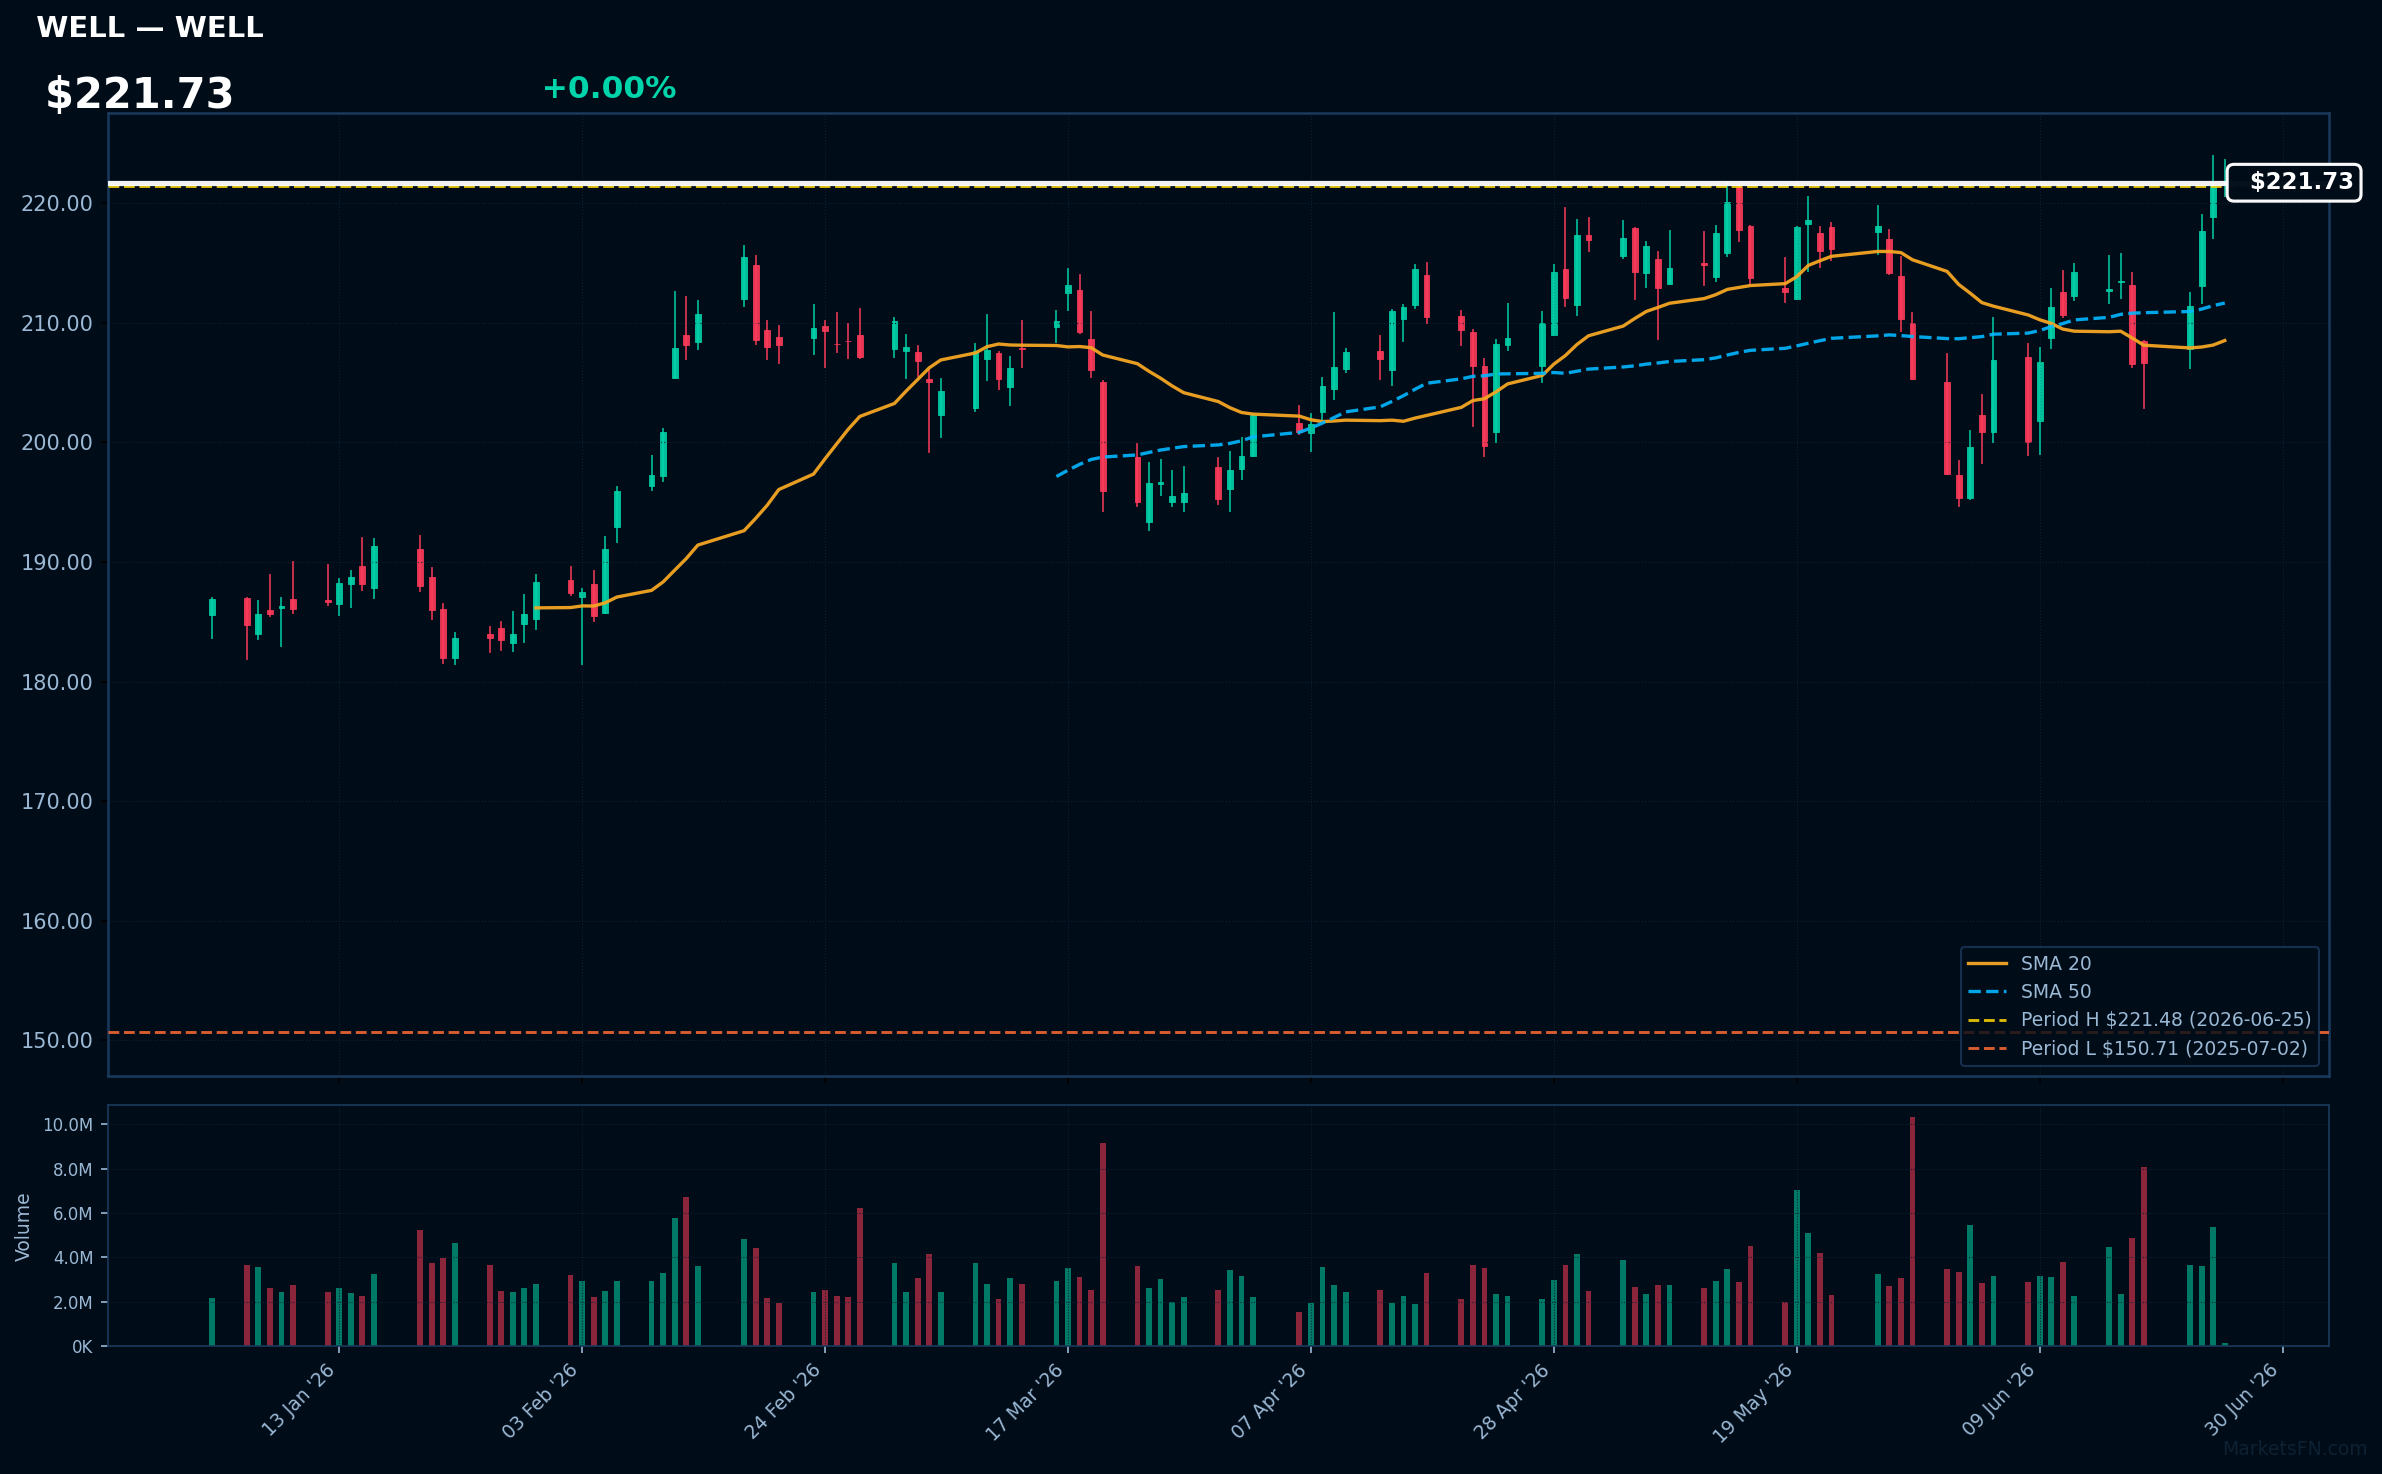
WELL | Welltower Inc | Real Estate | Price Last: $221.48 | % Realized: +44.35% | RSI: 61.7 | % above MA200: +13.1% | Trend: Above MA20, MA50, MA200
Welltower Inc is a healthcare real estate investment trust (REIT) that invests in seniors' housing and healthcare facilities. Investors care about its performance as it reflects demand for healthcare infrastructure and the company's ability to generate rental income.
Welltower Inc's RSI is 61.7, indicating rising momentum. The stock is above MA20, MA50, and MA200, showing a strong uptrend. With a 52-Week return of 44.3% and currently 0.0% below its 52-Week high, it suggests continued momentum.
Related headlines
- Welltower CFO Timothy McHugh sets U.S. pay record at $167M
- Welltower Announces Date of Second Quarter 2026 Earnings Release, Conference Call and Webcast
- Welltower's Dividend Is Up 15%. Here's What Really Matters.
- Welltower Board of Directors Approves 15% Increase in Quarterly Dividend to $0.85 per Share
📉 Nearest to 52-Week Low
Sectors represented: Technology (2), Communication Services (1), Consumer Cyclical (1), Healthcare (1)
| Ticker | Company | Sector | Price Last | % Realized | 52-Week Low Date | RSI | % above MA200 | Trend |
|---|---|---|---|---|---|---|---|---|
| NFLX | Netflix Inc | Communication Services | $71.78 | -43.71% | 2026-06-25 | 20.1 | -26.2% | Below MA20, MA50, MA200 |
| PLTR | Palantir Technologies Inc | Technology | $107.96 | -24.45% | 2026-06-25 | 27.8 | -32.1% | Below MA20, MA50, MA200 |
| MCD | McDonald's Corp | Consumer Cyclical | $266.86 | -6.55% | 2026-06-25 | 34.0 | -12.3% | Below MA20, MA50, MA200 |
| INTU | Intuit Inc | Technology | $255.54 | -66.28% | 2026-06-25 | 30.2 | -50.4% | Below MA20, MA50, MA200 |
| BSX | Boston Scientific Corp | Healthcare | $44.29 | -57.53% | 2026-06-25 | 29.3 | -44.6% | Below MA20, MA50, MA200 |
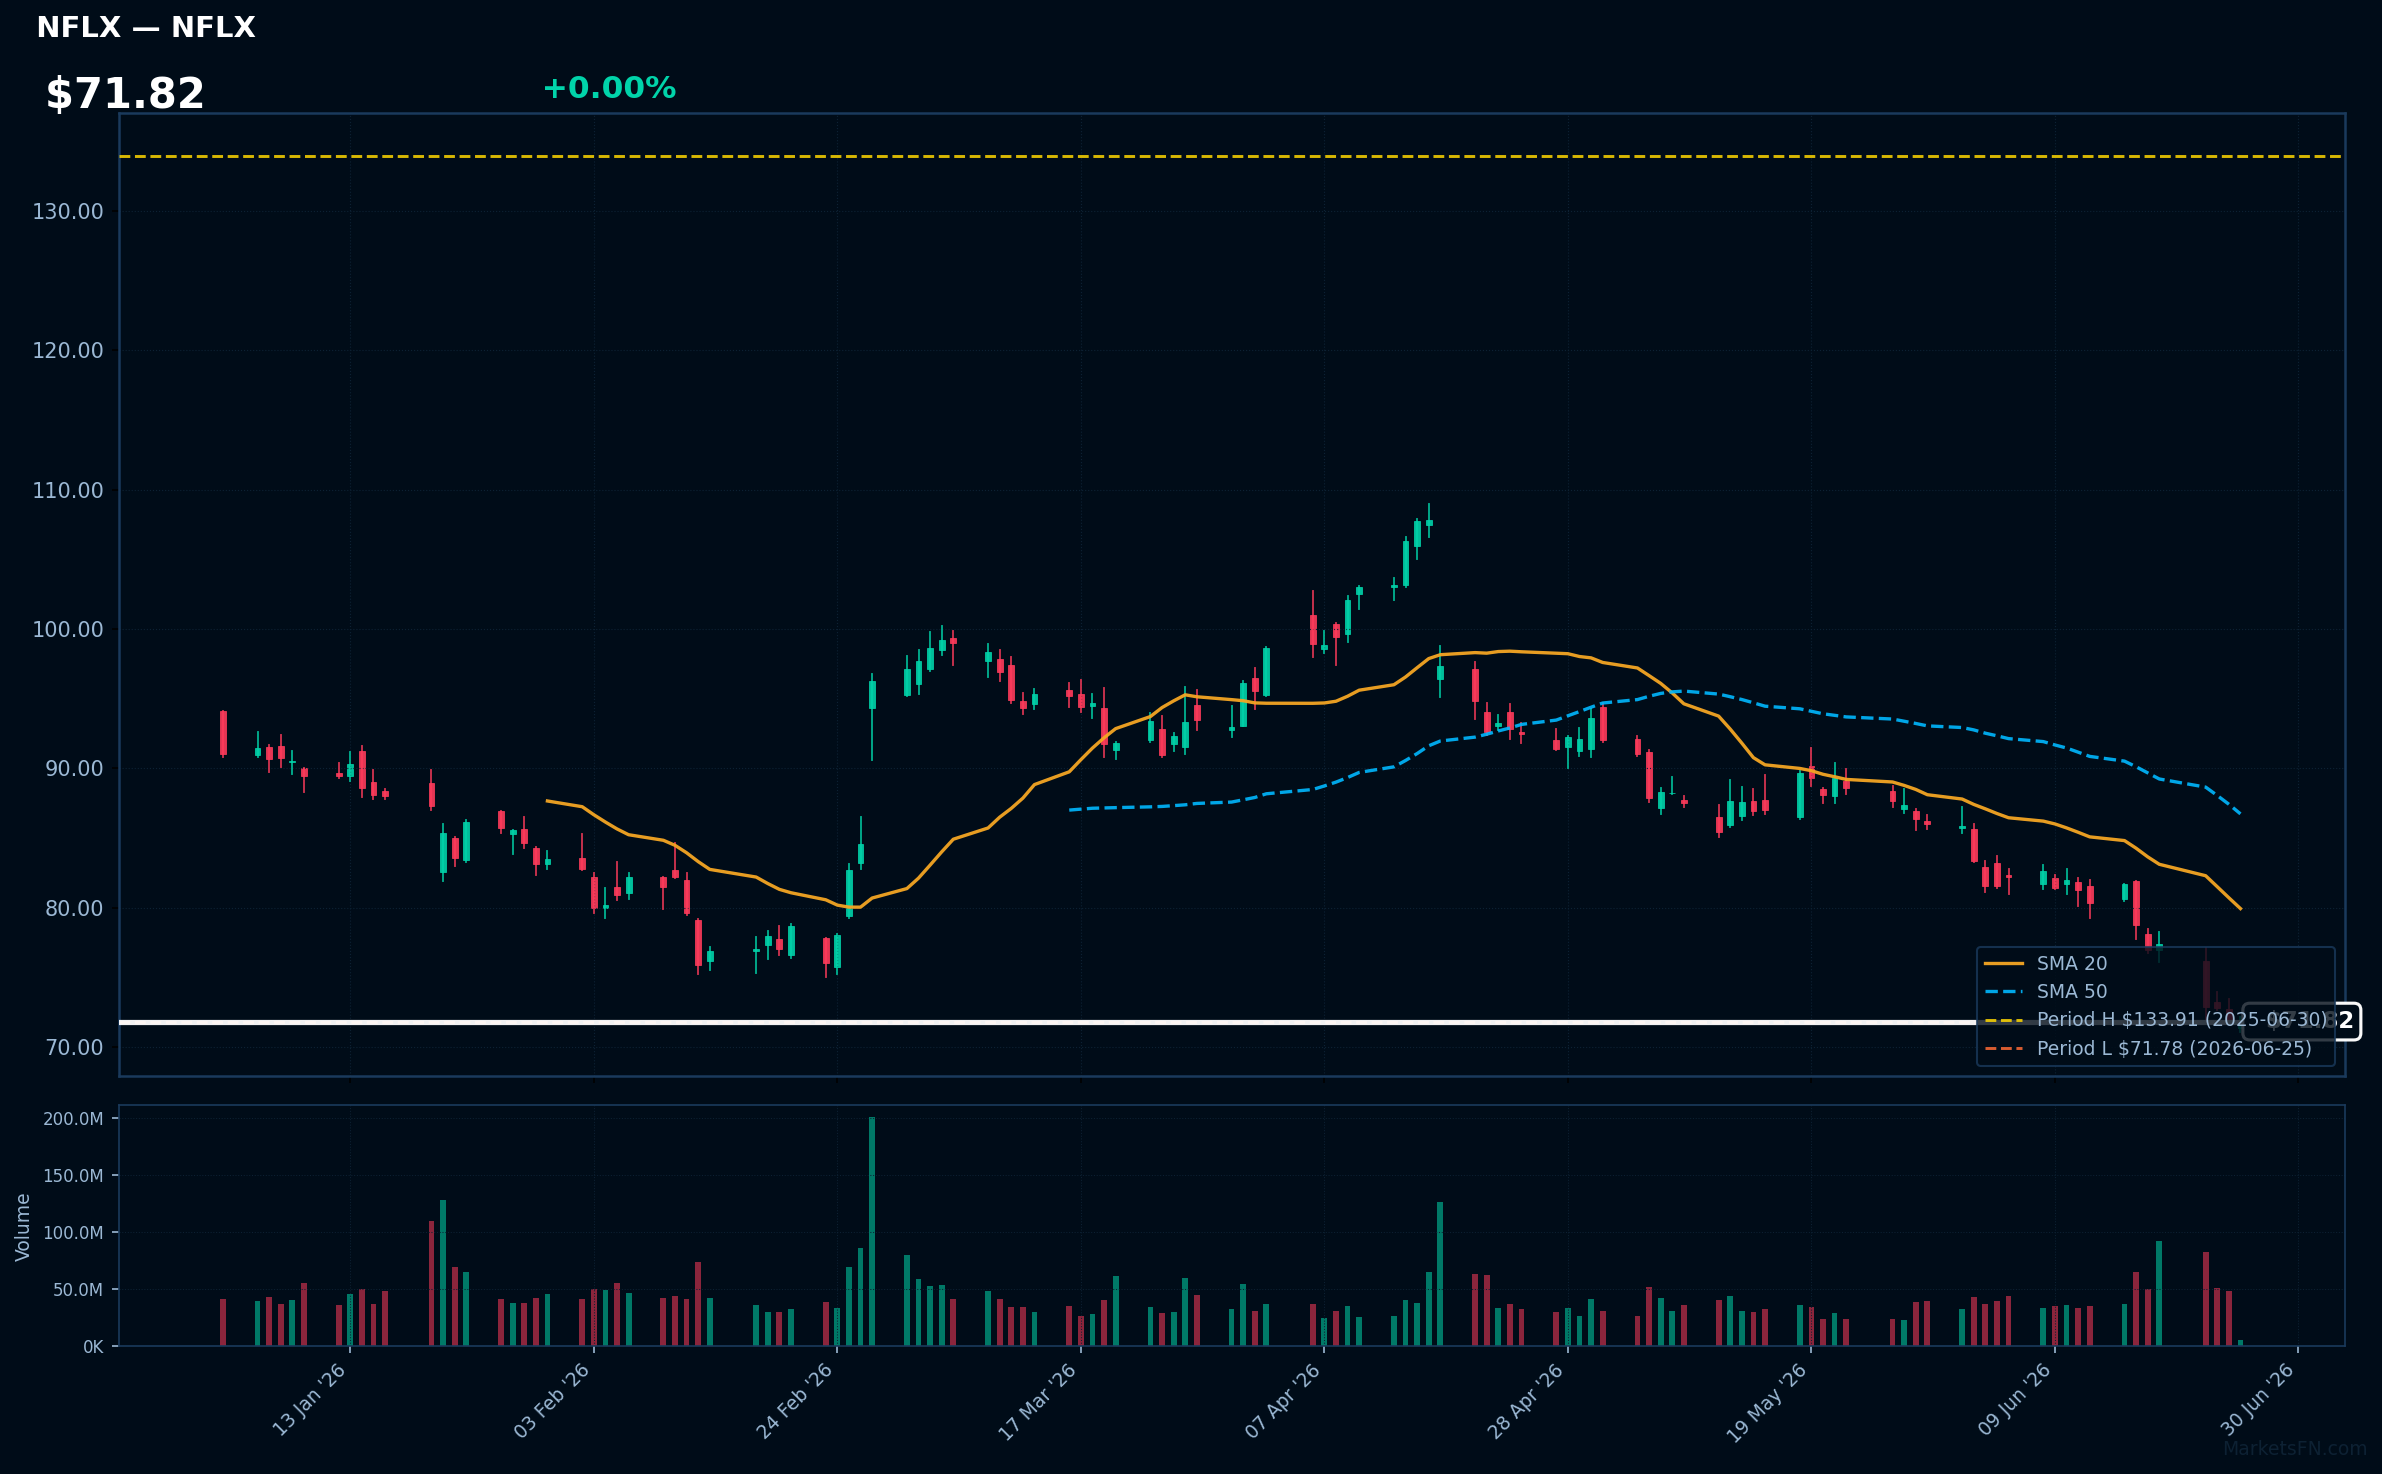
NFLX | Netflix Inc | Communication Services | Price Last: $71.78 | % Realized: -43.71% | RSI: 20.1 | % above MA200: -26.2% | Trend: Below MA20, MA50, MA200
Netflix Inc is a global streaming entertainment service offering a wide variety of TV series, documentaries, and feature films. Investors care about its subscriber growth, content pipeline, and pricing power, which drive revenue and profitability.
NFLX is in a sustained downtrend with RSI(14) at 20.1, indicating oversold conditions. The stock is 0.0% above its 52-Week low, testing major support, with bearish MA alignment: price ($71.82) < MA20 < MA50 < MA200, a warning sign for investors.
Related headlines
- Netflixs Worst Slump In Years Has Retail Investors Seeing A Discount, Not A Warning Sign
- Why Did MSTR, PLTR, NFLX Stocks Plummet To 52-Week Lows?
- Netflix is growing but its stock price is shrinking, as the specter of M&A spooks investors
- Netflix Struggles to Shift the Narrative After Warner Bros. Fiasco
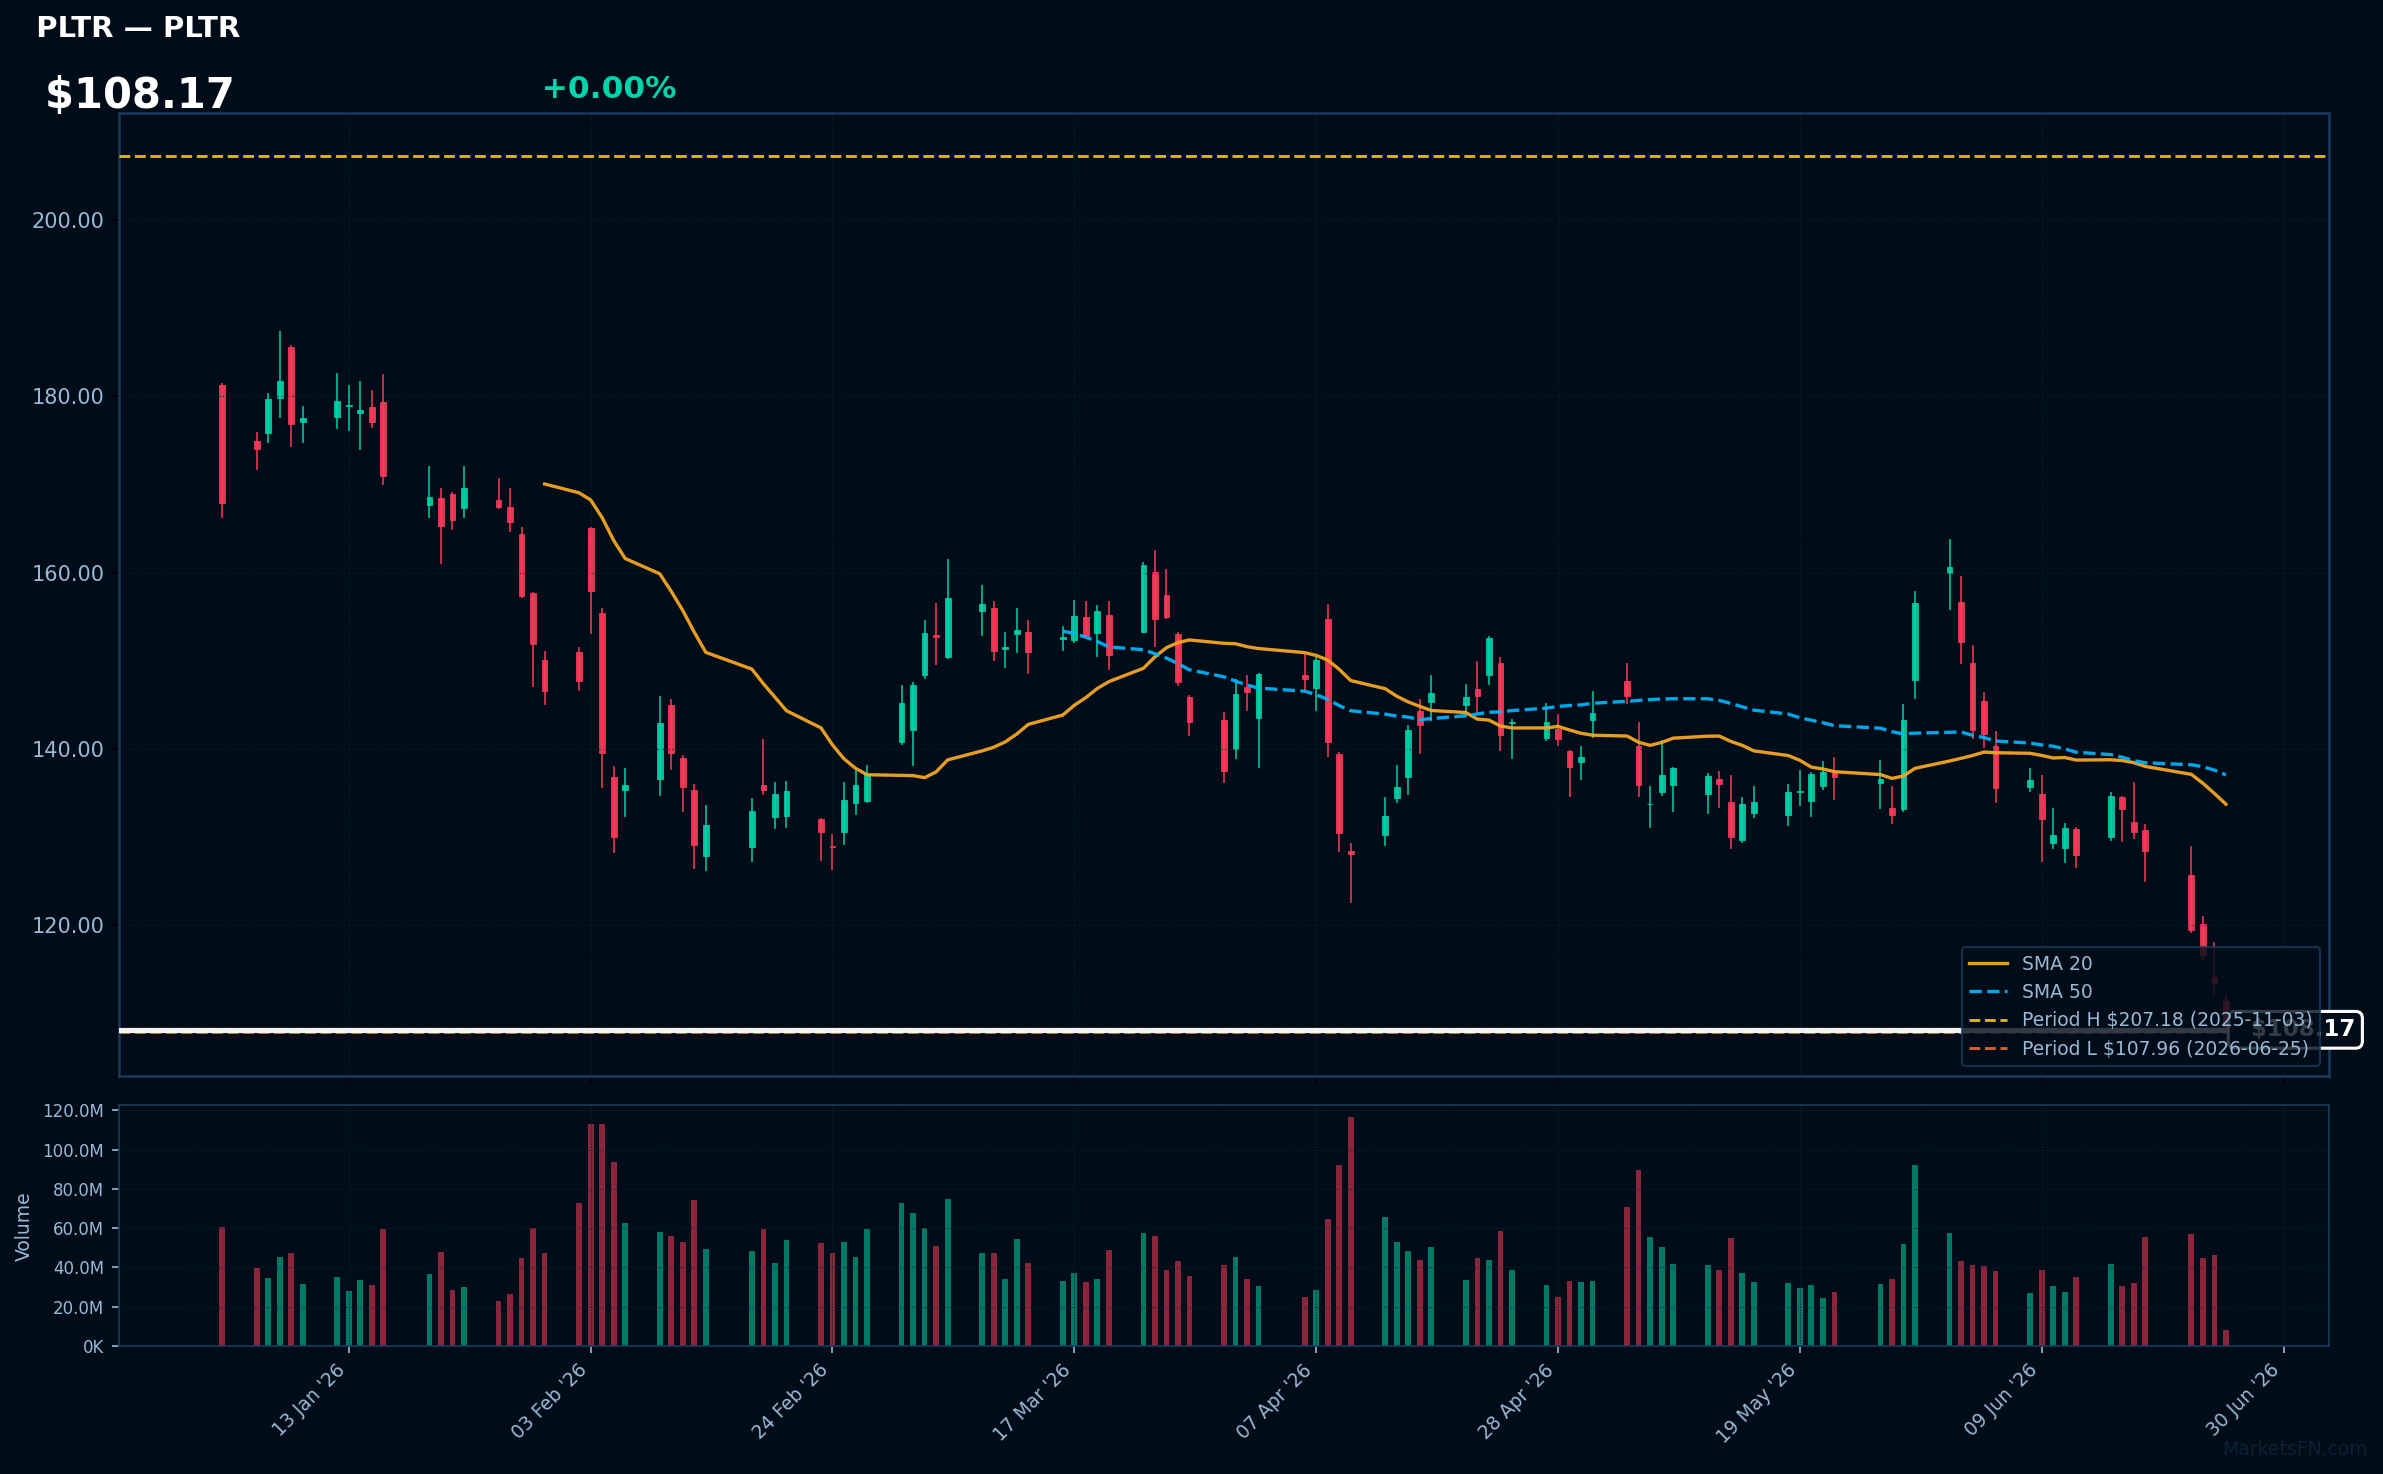
PLTR | Palantir Technologies Inc | Technology | Price Last: $107.96 | % Realized: -24.45% | RSI: 27.8 | % above MA200: -32.1% | Trend: Below MA20, MA50, MA200
Palantir Technologies Inc provides data integration and analytics software to governments and corporations, enabling them to make data-driven decisions. Investors should care because its software is used in critical applications such as defense, finance, and healthcare, generating significant revenue.
PLTR's technical situation is bearish, with an RSI(14) of 27.8 indicating oversold conditions, and a bearish MA alignment: price ($108.17) < MA20 < MA50 < MA200, suggesting a sustained downtrend. The stock is testing major support at its 52-Week low.
Related headlines
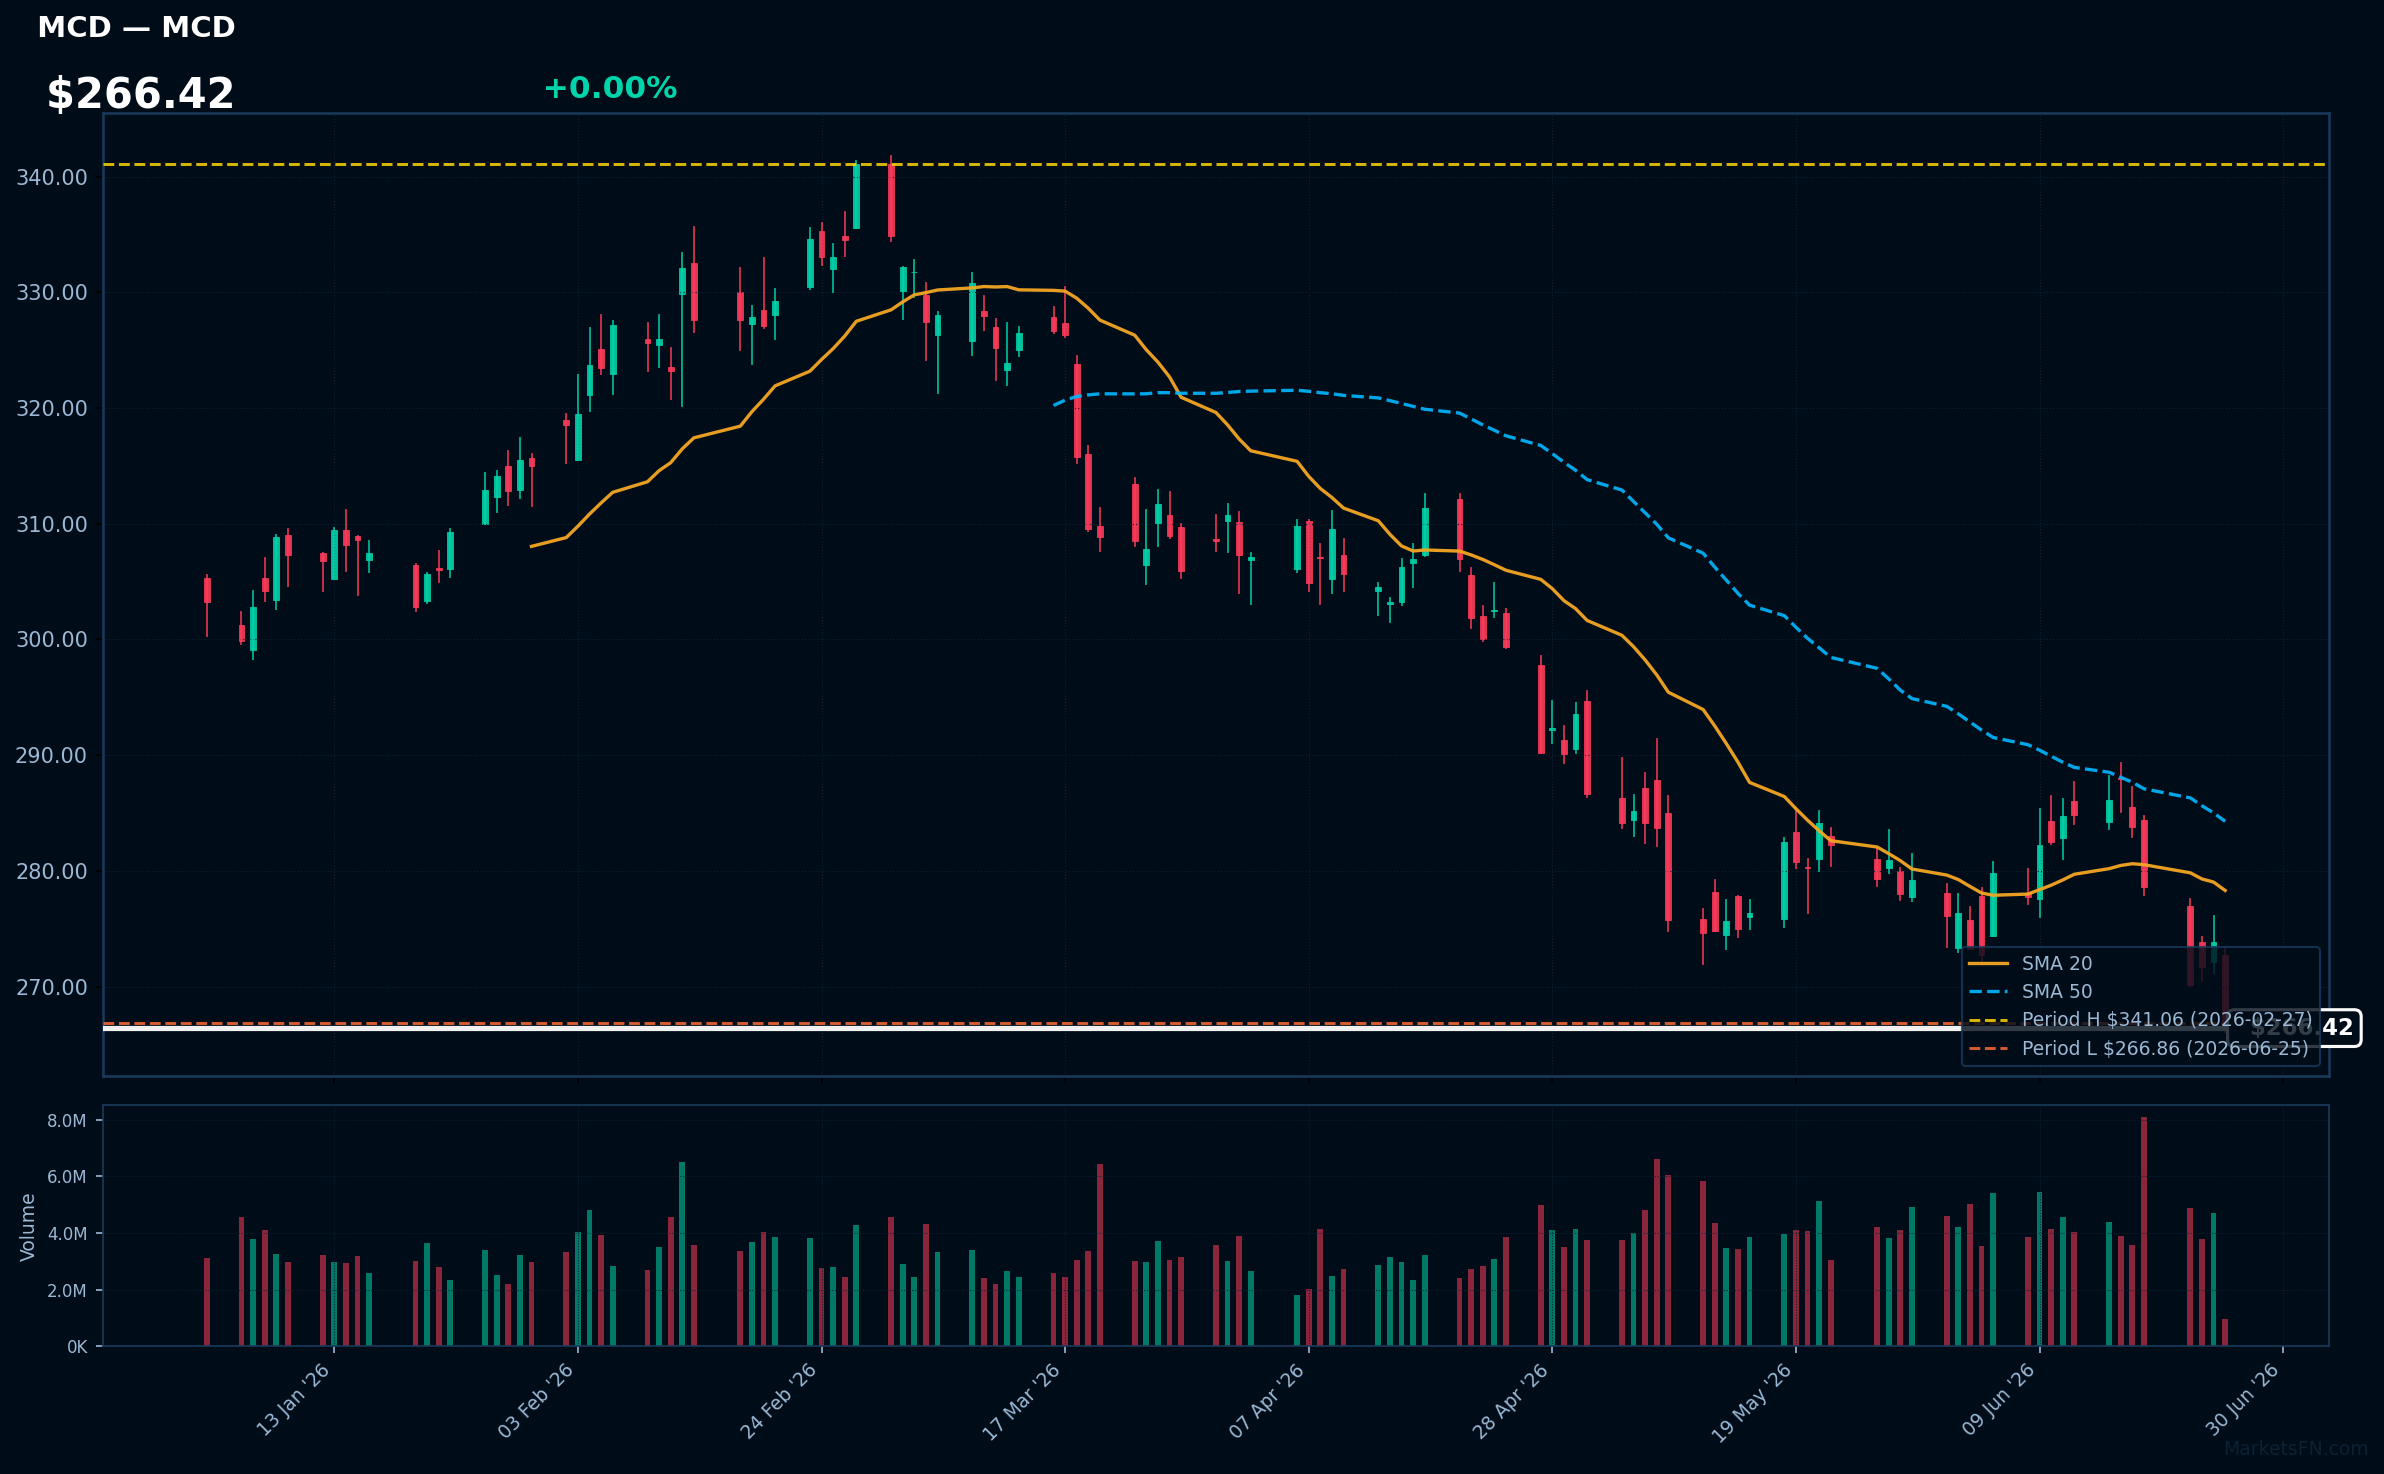
MCD | McDonald's Corp | Consumer Cyclical | Price Last: $266.86 | % Realized: -6.55% | RSI: 34.0 | % above MA200: -12.3% | Trend: Below MA20, MA50, MA200
McDonald's Corp operates quick-service restaurants, serving burgers, fries, and beverages globally. Investors should care about its brand strength, global footprint, and operational efficiency, as these factors influence revenue growth and profitability.
McDonald's Corp is in a sustained downtrend with price ($266.42) below MA20, MA50, and MA200. RSI(14) is 34.0, near oversold territory. The stock is testing major support at its 52-Week low, a warning sign. The 52-Week return is -6.5%.
Related headlines
- McDonald's is bringing back its fried apple pie for the first time in over 30 years
- McDonald's 70-Year Coke Alliance Enters New Beverage Test
- The 70-Year Marriage Between McDonald's and Coke Has Some Issues
- Running out of money: Kraft, McDonalds, Whirlpool CEOs all issue same dire warning about US consumers. Get ready now
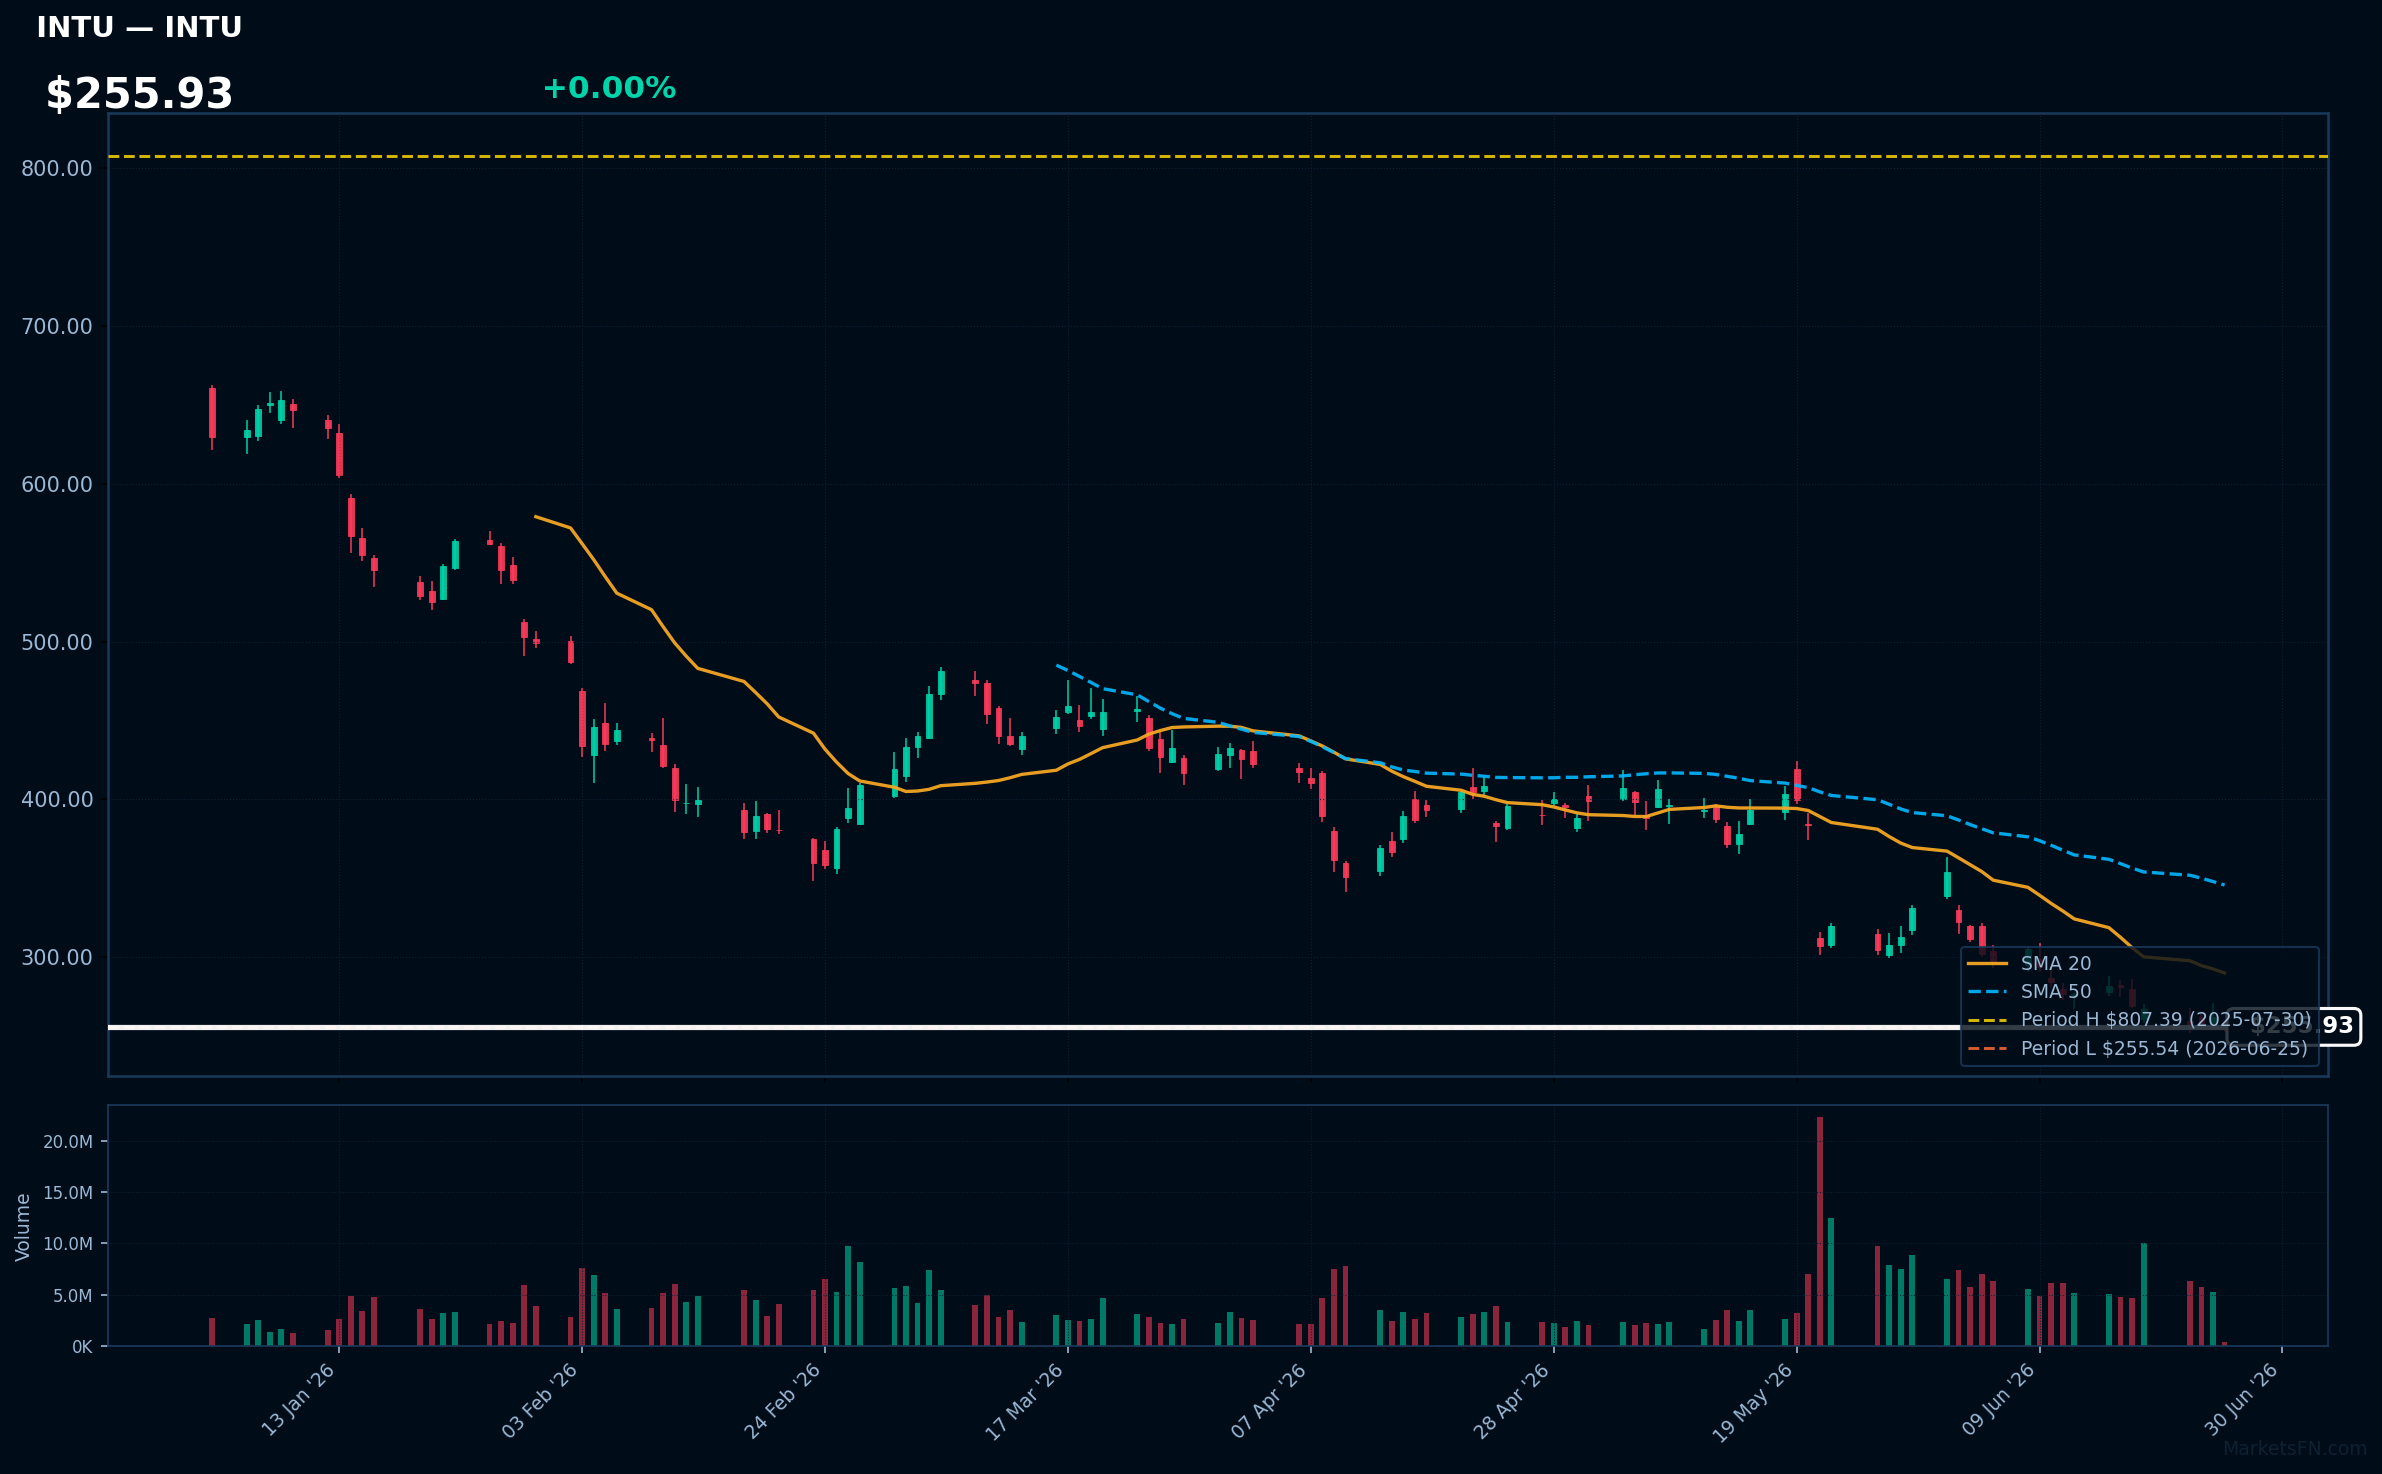
INTU | Intuit Inc | Technology | Price Last: $255.54 | % Realized: -66.28% | RSI: 30.2 | % above MA200: -50.4% | Trend: Below MA20, MA50, MA200
Intuit Inc (INTU) provides financial management solutions, including QuickBooks for small businesses and TurboTax for individual tax preparation, making it a key player in the financial software space with significant exposure to the tax preparation and accounting sectors.
INTU's technicals indicate a sustained downtrend with price ($255.93) below all key MAs (MA20, MA50, MA200), RSI(14) at 30.2, and a 52-Week low proximity of 0.0%, warning of potential further decline as it tests major support after a -66.3% 52-Week return.
Related headlines
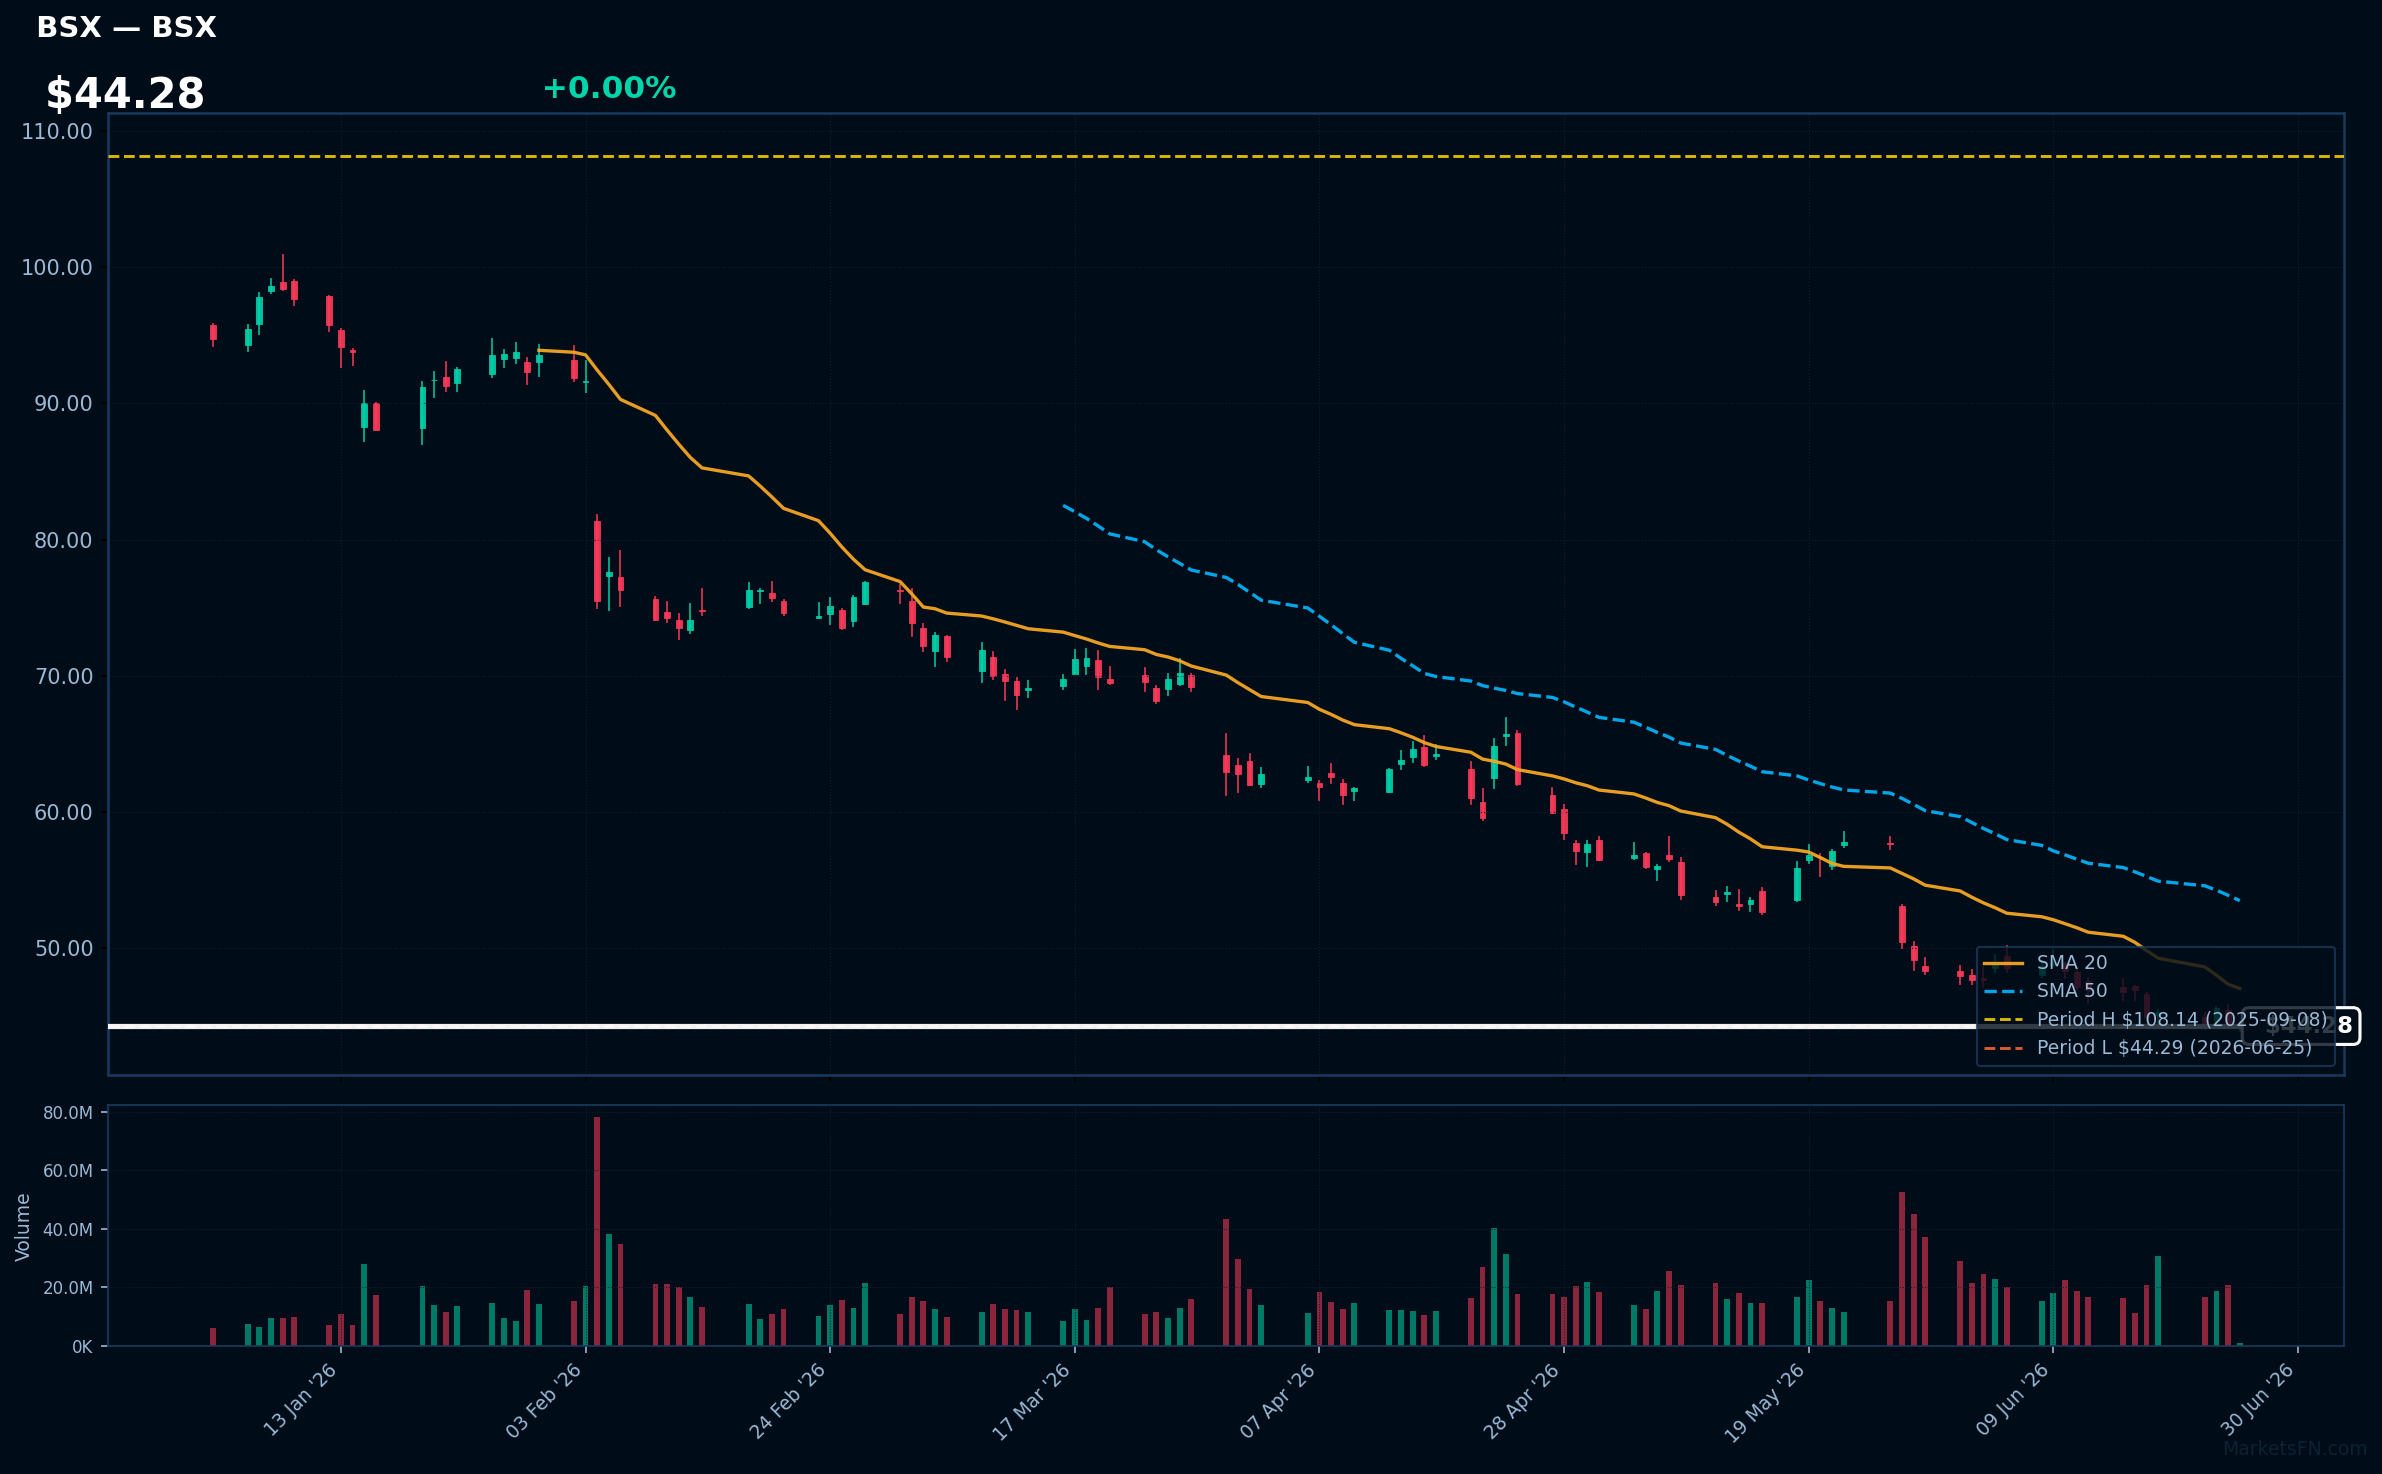
BSX | Boston Scientific Corp | Healthcare | Price Last: $44.29 | % Realized: -57.53% | RSI: 29.3 | % above MA200: -44.6% | Trend: Below MA20, MA50, MA200
Boston Scientific Corp (BSX) develops and manufactures medical devices, including stents, pacemakers, and neurovascular intervention products, addressing cardiovascular and other medical conditions. Investors should care about its innovation pipeline and market share in the medical device industry.
BSX's technical situation is bearish, with an RSI(14) of 29.3 indicating oversold conditions, and a sustained downtrend as price ($44.28) remains below MA20, MA50, and MA200. The stock is testing major support at its 52-Week low.
Related headlines
Market Commentary
The S&P 500 stocks listed are currently at 52-week extremes, with JPM, BAC, GE, CAT, and WELL at new highs and NFLX, PLTR, MCD, INTU, and BSX at new lows. Stocks reaching 52-week extremes can signal strong trend continuation or potential reversal, depending on the underlying drivers.
The stocks near 52-week highs are from diverse sectors, including finance (JPM, BAC), industrials (GE, CAT), and real estate (WELL), while those near lows span consumer discretionary (NFLX), technology (PLTR, INTU), and healthcare (BSX) with consumer staples (MCD) also represented. This mix may indicate sector rotation and varying macro themes, such as interest rate expectations influencing financials and real estate, and consumer spending impacting MCD.
Key levels to watch include the sustainability of current price levels and potential catalysts such as earnings reports and macroeconomic data releases. As these stocks are at extremes, any significant deviation from current trends or unexpected news could trigger substantial price movements.
Methodology: All 503 S&P 500 constituents screened. 52-week high = highest daily close over the past 252 trading days (approx. 1 year). 52-week low = lowest daily close over the same period. Distance = (current price / extreme − 1) × 100. Technical indicators computed on up to 1 year of daily OHLCV data.
Disclaimer: For informational purposes only. Not investment advice. Past performance is not indicative of future results.