S&P 500 52-Week Highs & Lows Radar: Lilly(Eli) & (LLY), AT&T, (T) and more
· Stocks · MarketsFN Team
S&P 500 52-Week Highs & Lows Radar: Lilly(Eli) & (LLY), AT&T, (T) and more
Screening all 503 S&P 500 constituents for stocks nearest to their 52-week high and their 52-week low. Data as of June 08, 2026. % Realized = 52-week total return.
Legend: RSI > 70 = overbought · RSI < 30 = oversold · Green % Realized = positive 52W return · Red = negative.
📈 Nearest to 52-Week High
Sectors represented: Industrials (2), Healthcare (1), Energy (1), Financial (1)
| Ticker | Company | Sector | Price Last | % Realized | 52-Week High Date | RSI | % above MA200 | Trend |
|---|---|---|---|---|---|---|---|---|
| LLY | Lilly(Eli) & Co | Healthcare | $1166.66 | +50.79% | 2026-06-08 | 72.4 | +22.8% | Above MA20, MA50, MA200 |
| CSX | CSX Corp | Industrials | $47.29 | +47.87% | 2026-06-08 | 63.3 | +22.7% | Above MA20, MA50, MA200 |
| MPC | Marathon Petroleum Corp | Energy | $269.93 | +68.42% | 2026-06-08 | 63.5 | +32.2% | Above MA20, MA50, MA200 |
| STT | State Street Corp | Financial | $163.10 | +64.98% | 2026-06-08 | 67.7 | +27.0% | Above MA20, MA50, MA200 |
| ODFL | Old Dominion Freight Line, Inc | Industrials | $245.55 | +51.38% | 2026-06-08 | 75.5 | +41.8% | Above MA20, MA50, MA200 |
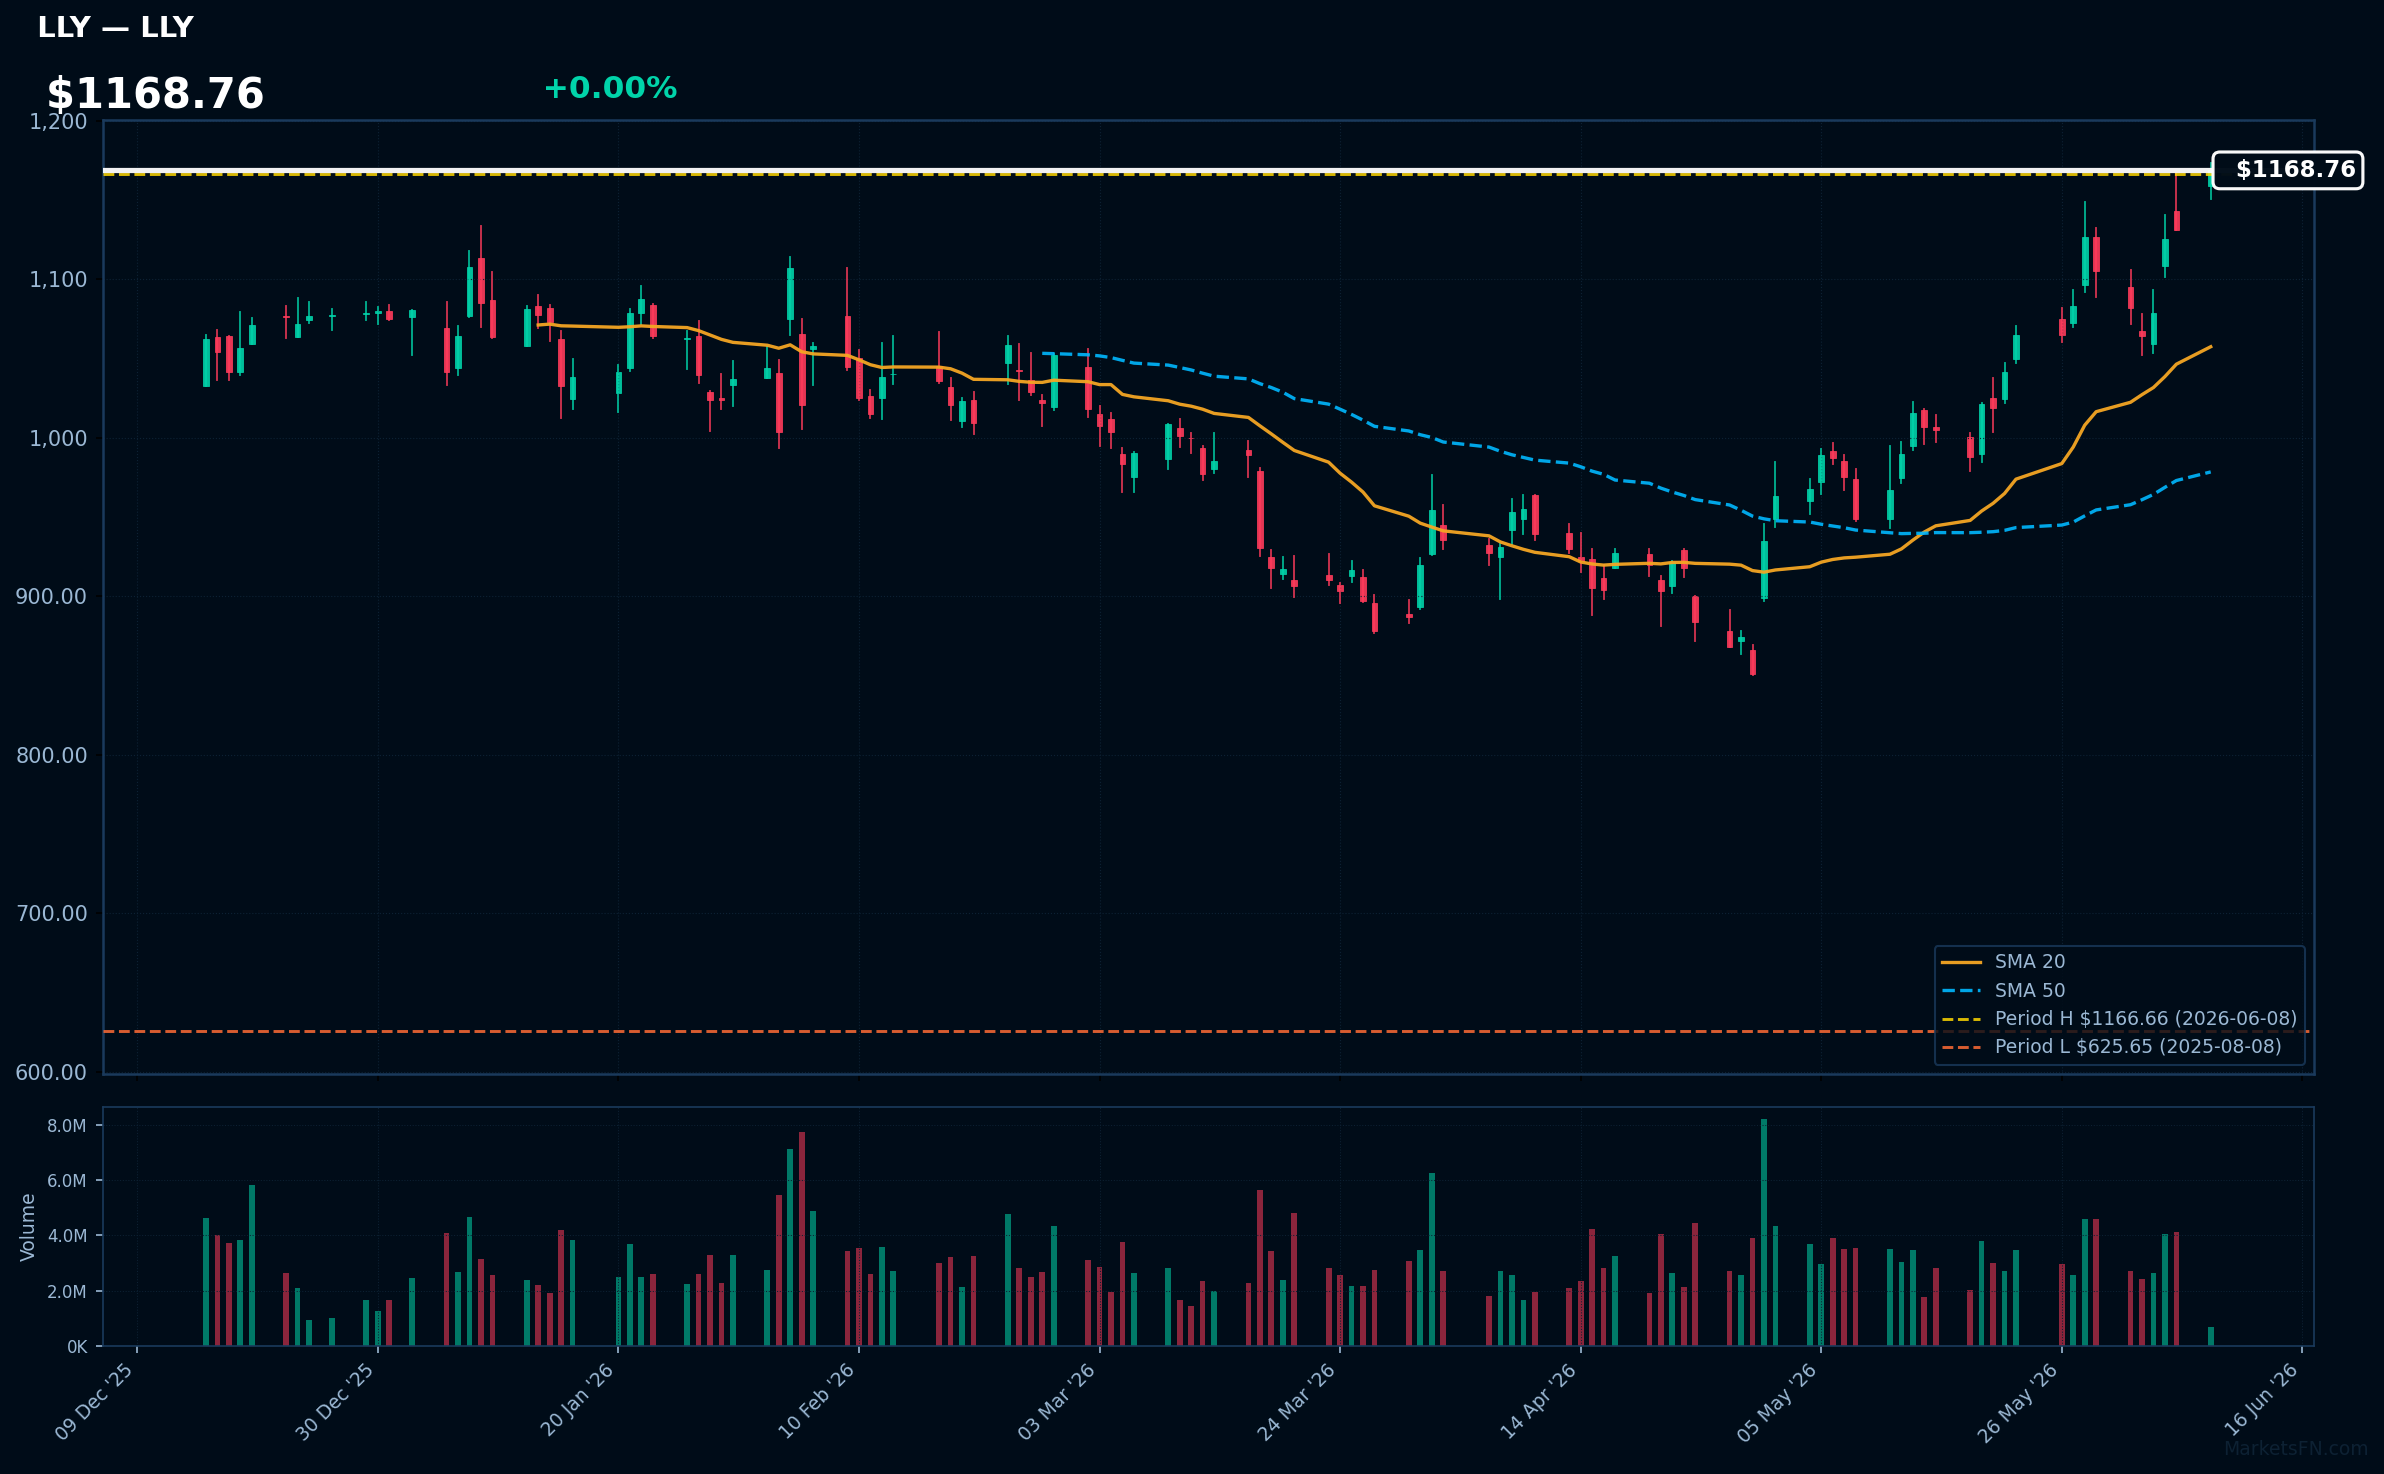
LLY | Lilly(Eli) & Co | Healthcare | Price Last: $1166.66 | % Realized: +50.79% | RSI: 72.4 | % above MA200: +22.8% | Trend: Above MA20, MA50, MA200
Eli Lilly is a pharmaceutical company developing and marketing medicines; investors should care about its pipeline and product sales. Its diabetes and obesity treatments, such as tirzepatide, drive revenue growth.
Lilly's RSI is 72.4, indicating strong momentum with price > MA20 > MA50 > MA200, a bullish alignment. The stock is 0.0% below its 52-Week high, near a potential breakout, with a 50.8% 52-Week return.
Related headlines
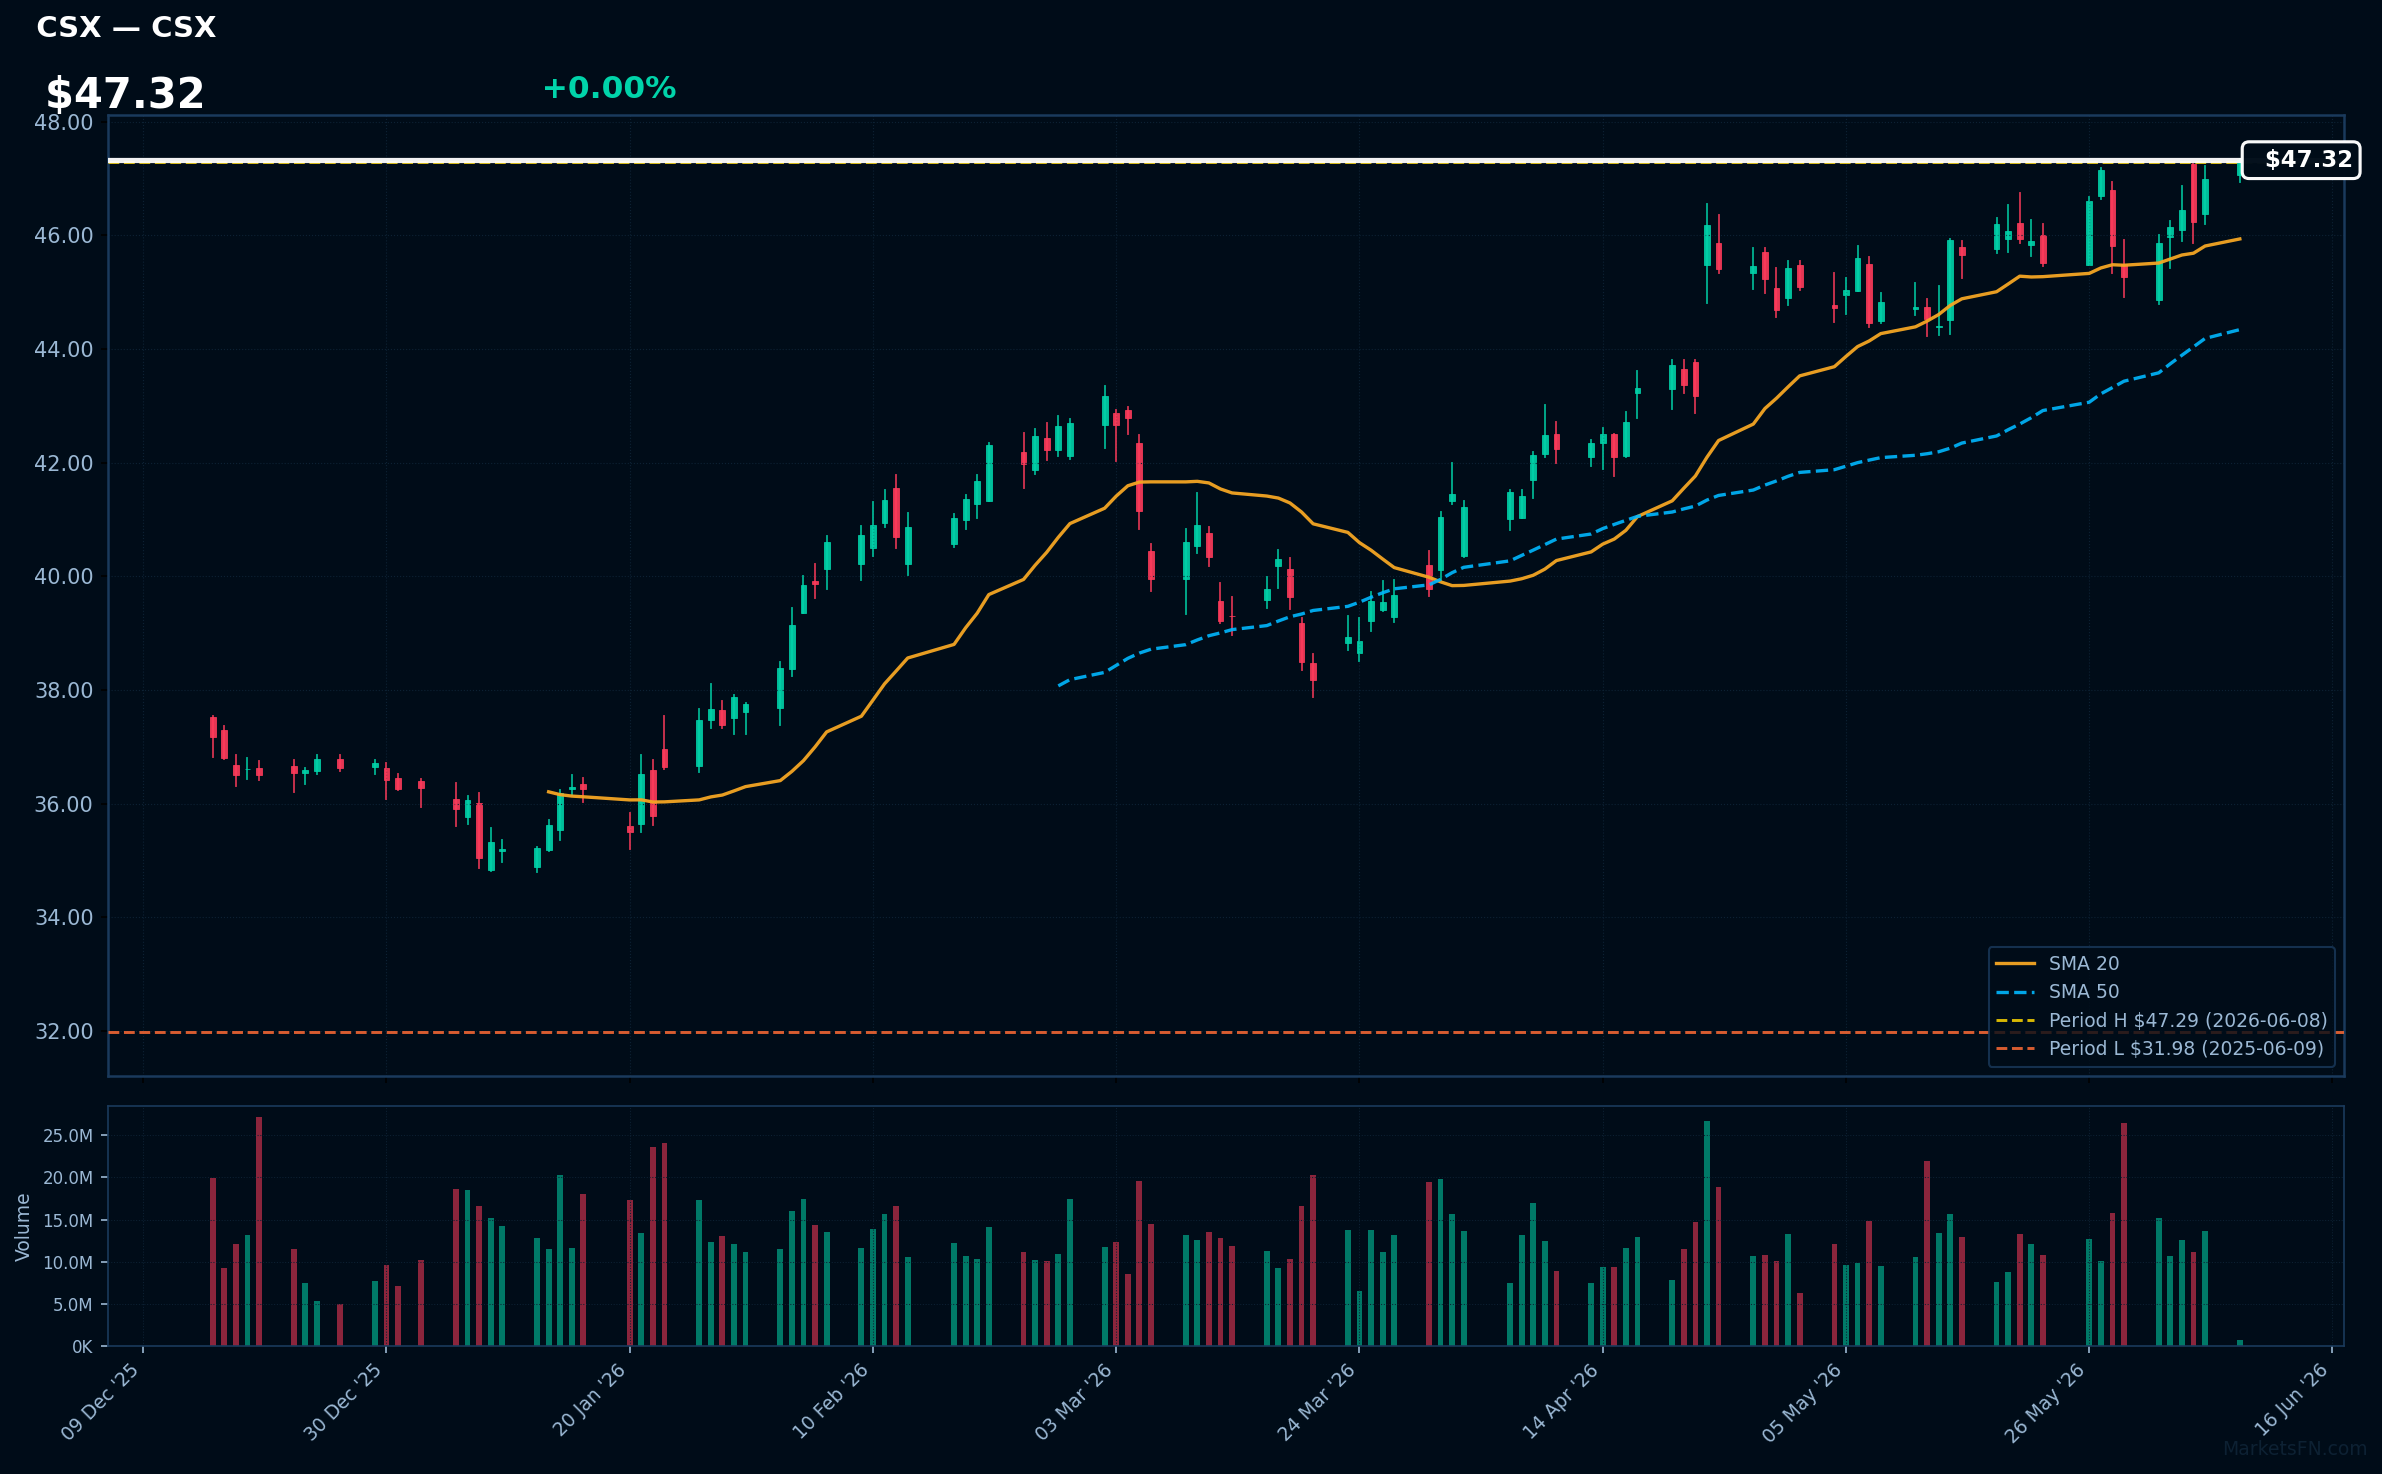
CSX | CSX Corp | Industrials | Price Last: $47.29 | % Realized: +47.87% | RSI: 63.3 | % above MA200: +22.7% | Trend: Above MA20, MA50, MA200
CSX Corp operates a rail network transporting coal, intermodal, and automotive goods. Investors should care because its rail network is a critical component of North American supply chains, and its performance can indicate industrial activity and economic health.
CSX Corp's technicals indicate momentum, with RSI(14) at 63.3, price above MA20, MA50, and MA200, and a 0.0% gap to its 52-Week high, suggesting a sustained uptrend and potential breakout.
Related headlines
- CSX Corporation Declares Quarterly Dividend
- CSX, CPKC upgrade Southeast Mexico Express with dedicated train, faster transit times
- CPKC, CSX upgrade Southeast Mexico Express with dedicated train, faster transit times
- CSX Executive Vice President and Chief Financial Officer to Address Bank of America Industrials, Transportation & Airlines Key Leaders Conference
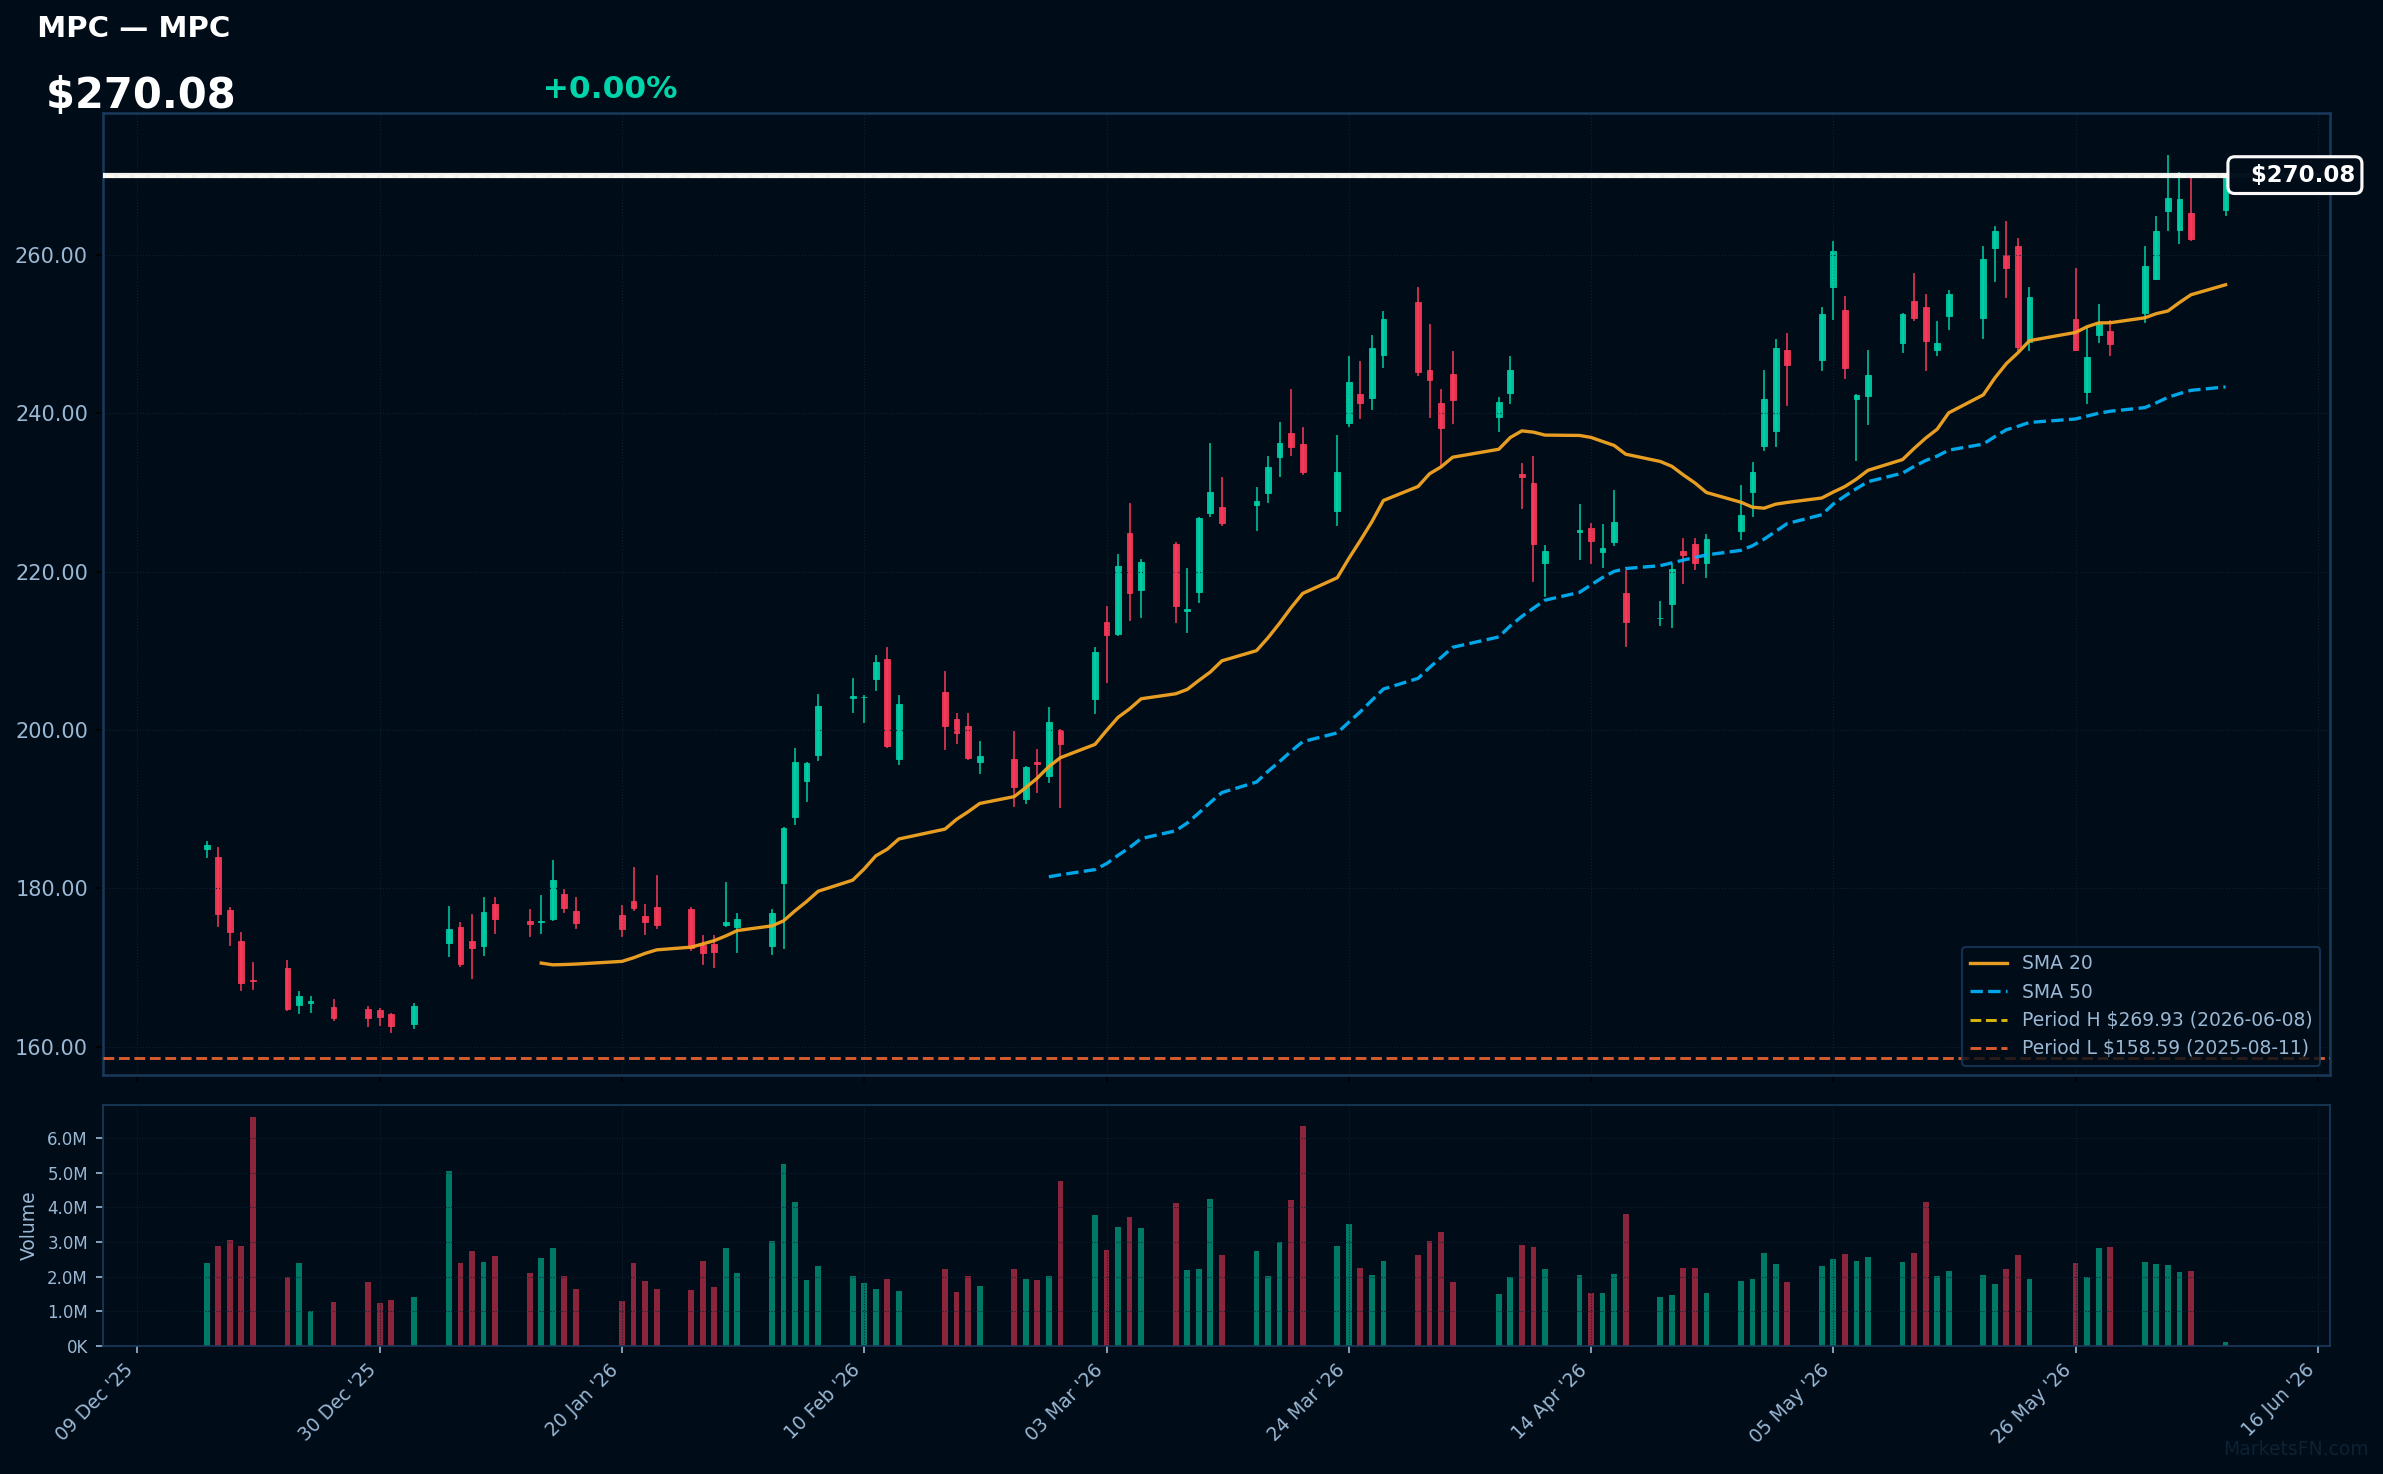
MPC | Marathon Petroleum Corp | Energy | Price Last: $269.93 | % Realized: +68.42% | RSI: 63.5 | % above MA200: +32.2% | Trend: Above MA20, MA50, MA200
Marathon Petroleum Corp (MPC) operates as a refining, marketing, and transportation company, generating revenue primarily through refining and distributing petroleum products. Investors care due to its exposure to energy market fluctuations and refining margins.
MPC's RSI(14) is 63.5, indicating rising momentum. The bullish MA alignment (price > MA20 > MA50 > MA200) and 0.0% proximity to its 52-Week high suggest a sustained uptrend near a potential breakout level.
Related headlines
- Marathon Petroleum Corp. names Brian Worthington vice president, Investor Relations; Kristina Kazarian to become vice president, Finance and Treasurer
- MPC- A US Refiner Benefitting from Tighter Jet Fuel Market
- Marathon Petroleum Corporation Q1 2026 Earnings Call Summary
- Marathon Petroleum tops expectations as refining performance drives earnings
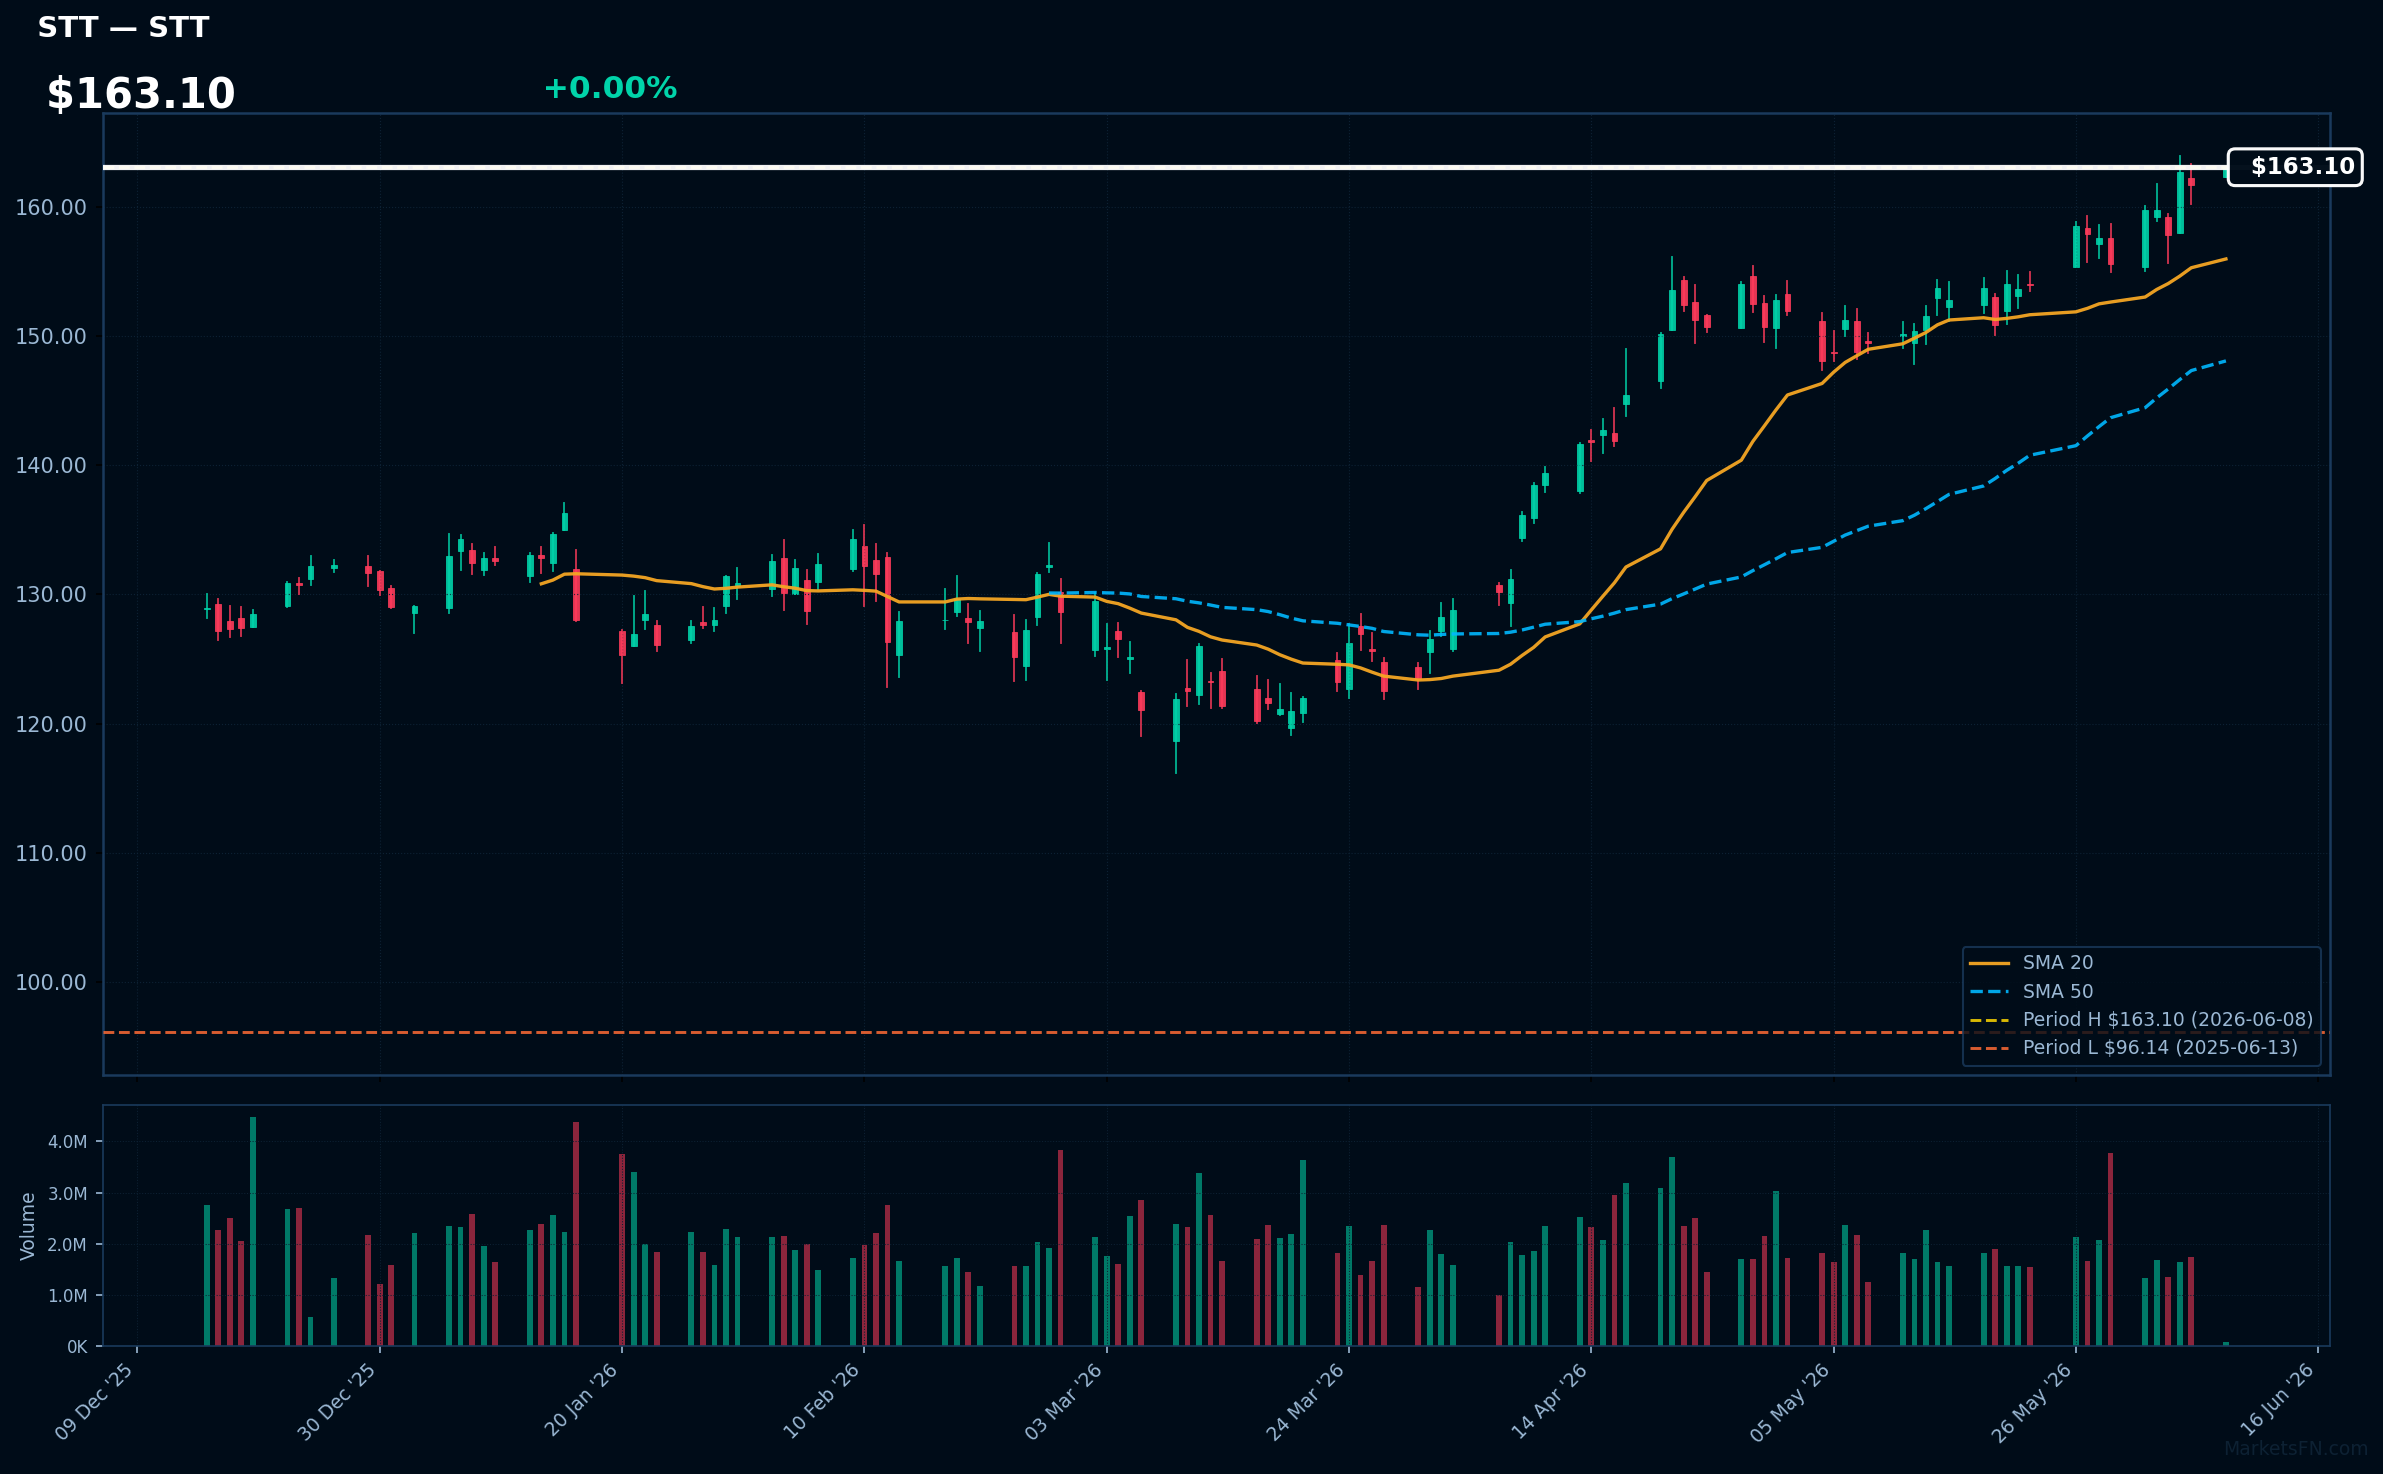
STT | State Street Corp | Financial | Price Last: $163.10 | % Realized: +64.98% | RSI: 67.7 | % above MA200: +27.0% | Trend: Above MA20, MA50, MA200
State Street Corp is a global financial services provider specializing in custody, trust, and investment management services for institutional investors. Investors care due to its significant role in the financial infrastructure and exposure to asset management trends.
State Street Corp's technical situation indicates sustained uptrend with price at $163.10 above MA20, MA50, and MA200. RSI(14) is 67.7, nearing overbought territory. The stock is 0.0% below its 52-Week high, suggesting potential breakout momentum.
Related headlines
- State Street Expands Investment Servicing Relationship with Principal Financial Group
- State Street Corporation (NYSE: STT) Announces Date for Release of Second-Quarter 2026 Financial Results and Conference Call Webcast
- State Street to Speak at the Morgan Stanley U.S. Financials Conference
- State Street Investment Management Announces Change to ETF Lineup
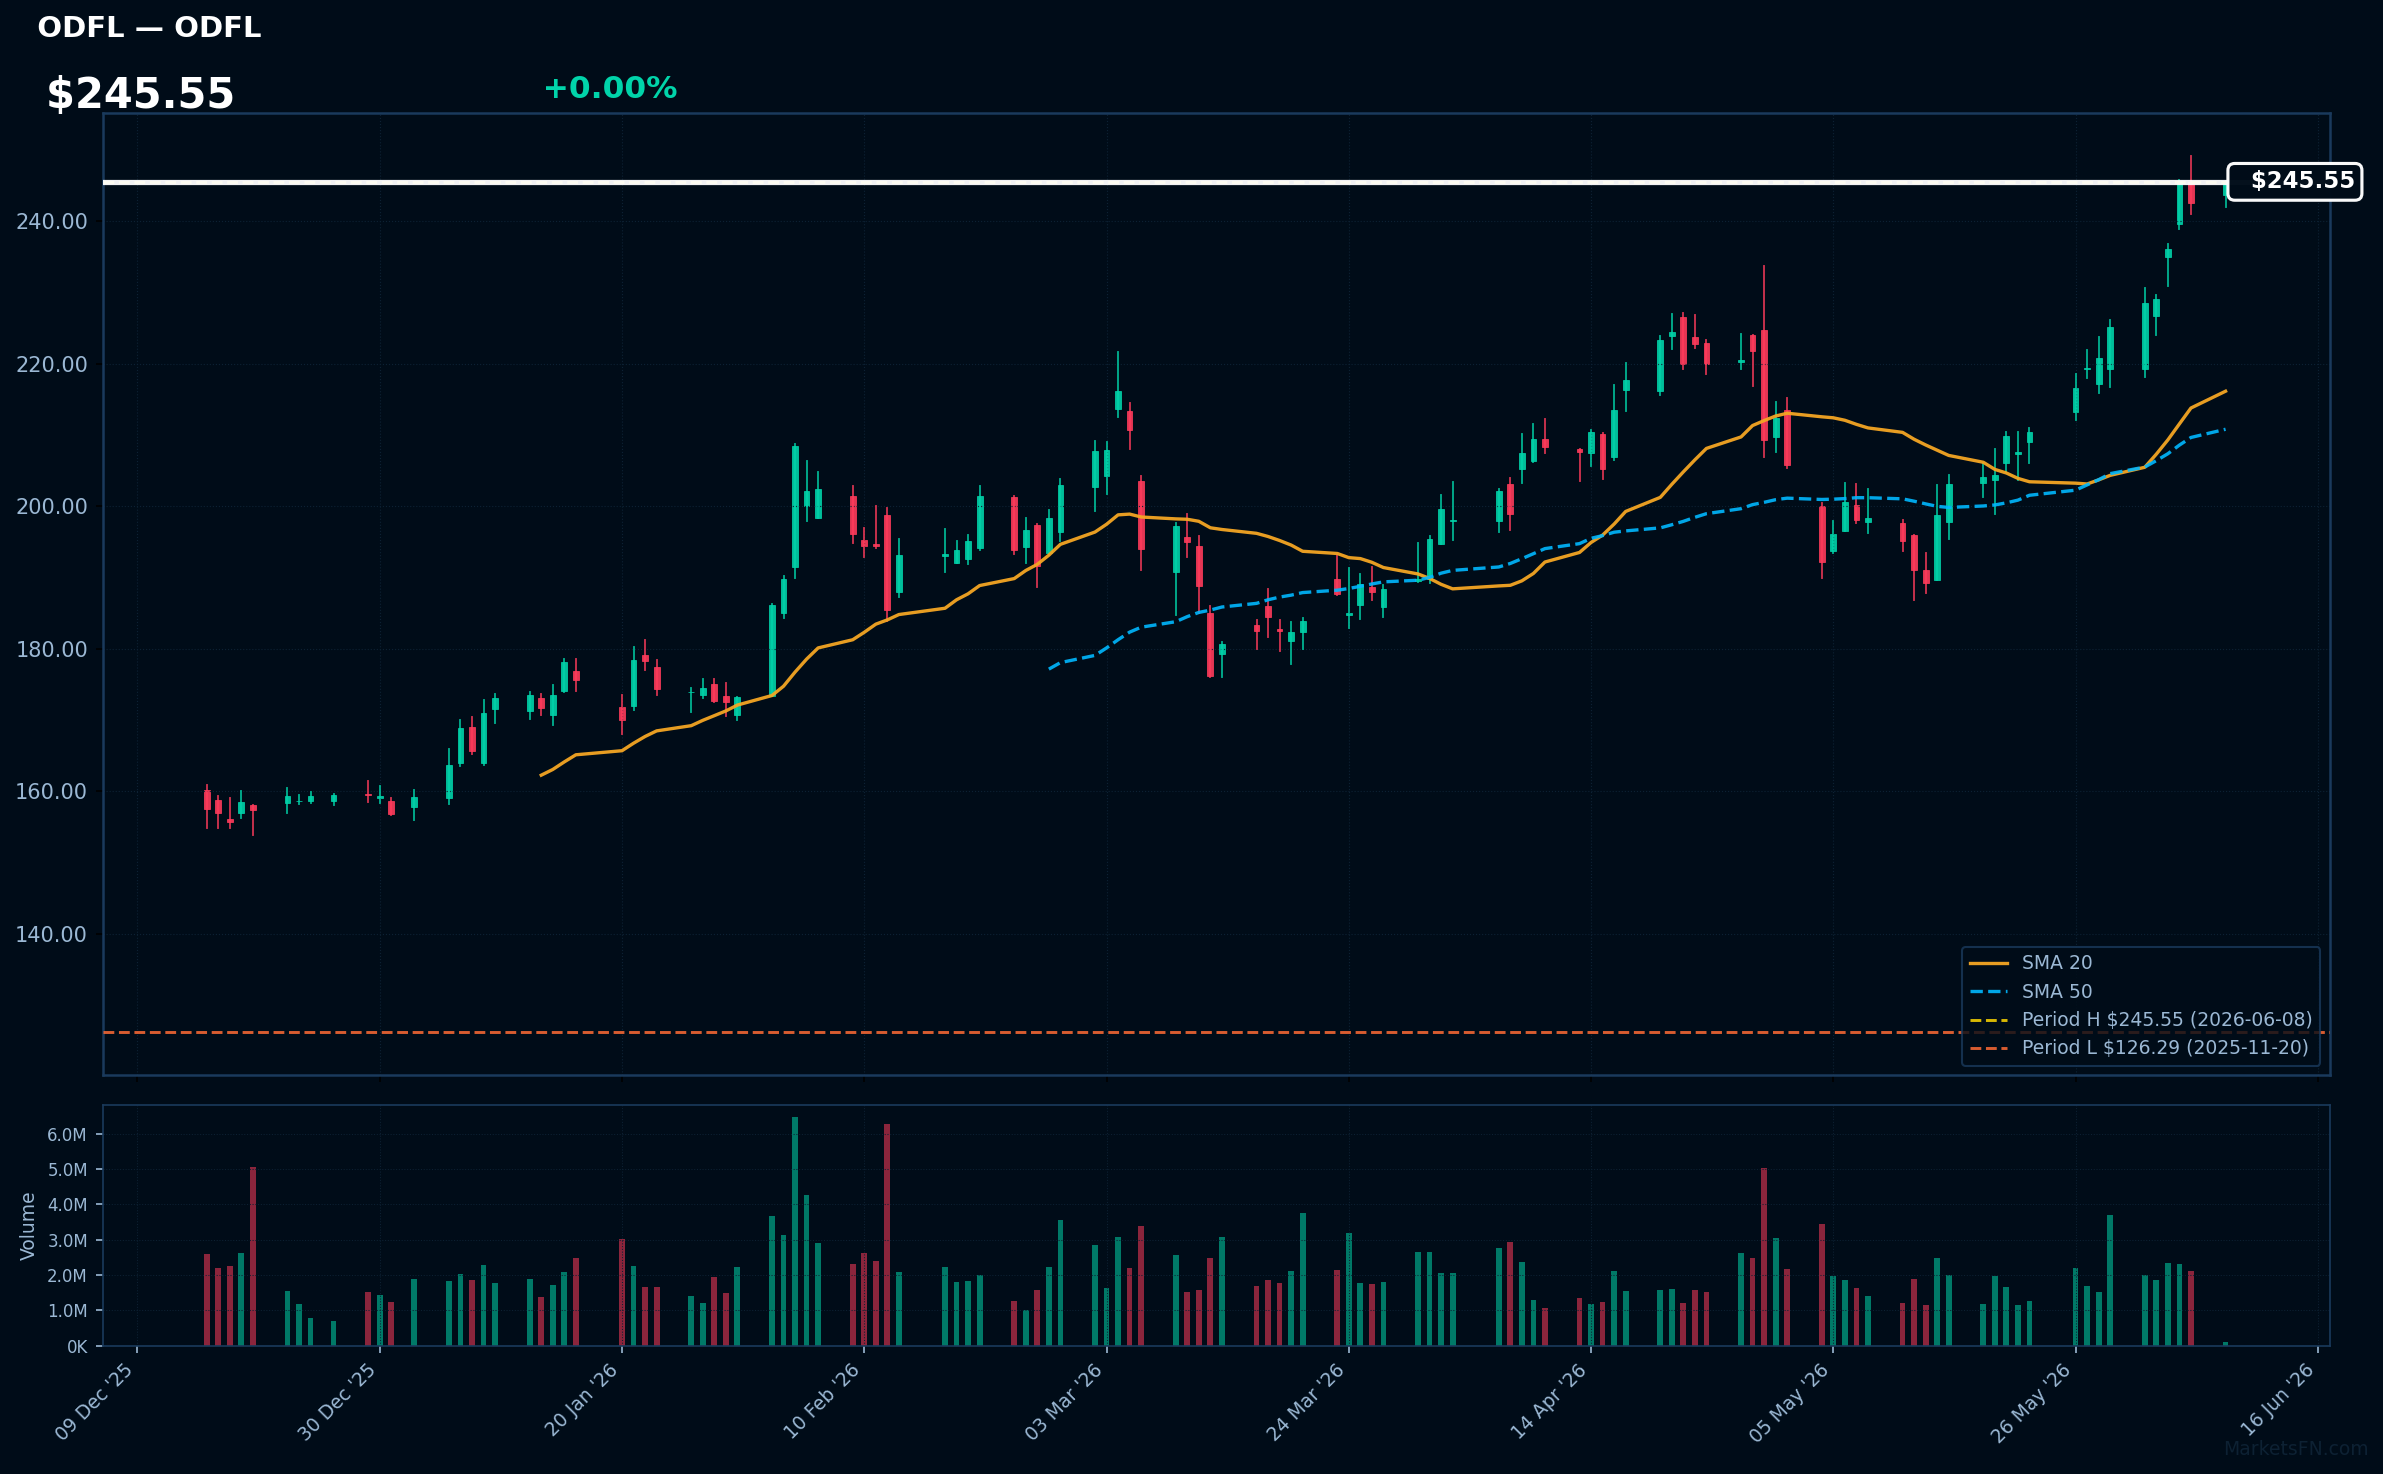
ODFL | Old Dominion Freight Line, Inc | Industrials | Price Last: $245.55 | % Realized: +51.38% | RSI: 75.5 | % above MA200: +41.8% | Trend: Above MA20, MA50, MA200
Old Dominion Freight Line, Inc is a less-than-truckload (LTL) shipping carrier, providing regional and long-haul services. Investors should care due to its exposure to the growing logistics market and potential for pricing power and volume growth.
ODFL's RSI(14) is 75.5, indicating strong momentum. The MA alignment is bullish with price > MA20 > MA50 > MA200, and it's 0.0% below its 52-Week high, suggesting a potential breakout.
Related headlines
- Old Dominions May update shows an improving LTL market
- Old Dominion Freight Line Provides Update for Second Quarter 2026
- Old Dominion Freight Line Announces $0.29 Per Share Quarterly Cash Dividend
- Old Dominion Freight Line Inc. stock underperforms Thursday when compared to competitors despite daily gains
📉 Nearest to 52-Week Low
Sectors represented: Communication Services (3), Technology (2)
| Ticker | Company | Sector | Price Last | % Realized | 52-Week Low Date | RSI | % above MA200 | Trend |
|---|---|---|---|---|---|---|---|---|
| T | AT&T, Inc | Communication Services | $22.51 | -19.19% | 2026-06-08 | 23.7 | -14.4% | Below MA20, MA50, MA200 |
| CHTR | Charter Communications Inc | Communication Services | $128.35 | -67.47% | 2026-06-08 | 28.2 | -40.8% | Below MA20, MA50, MA200 |
| FIS | Fidelity National Information Services, Inc | Technology | $40.31 | -50.65% | 2026-06-08 | 35.2 | -29.8% | Below MA20, MA50, MA200 |
| TTD | Trade Desk Inc | Communication Services | $19.38 | -72.90% | 2026-06-08 | 38.5 | -44.8% | Below MA20, MA50, MA200 |
| TRMB | Trimble Inc | Technology | $53.97 | -25.41% | 2026-06-08 | 33.2 | -25.7% | Below MA20, MA50, MA200 |
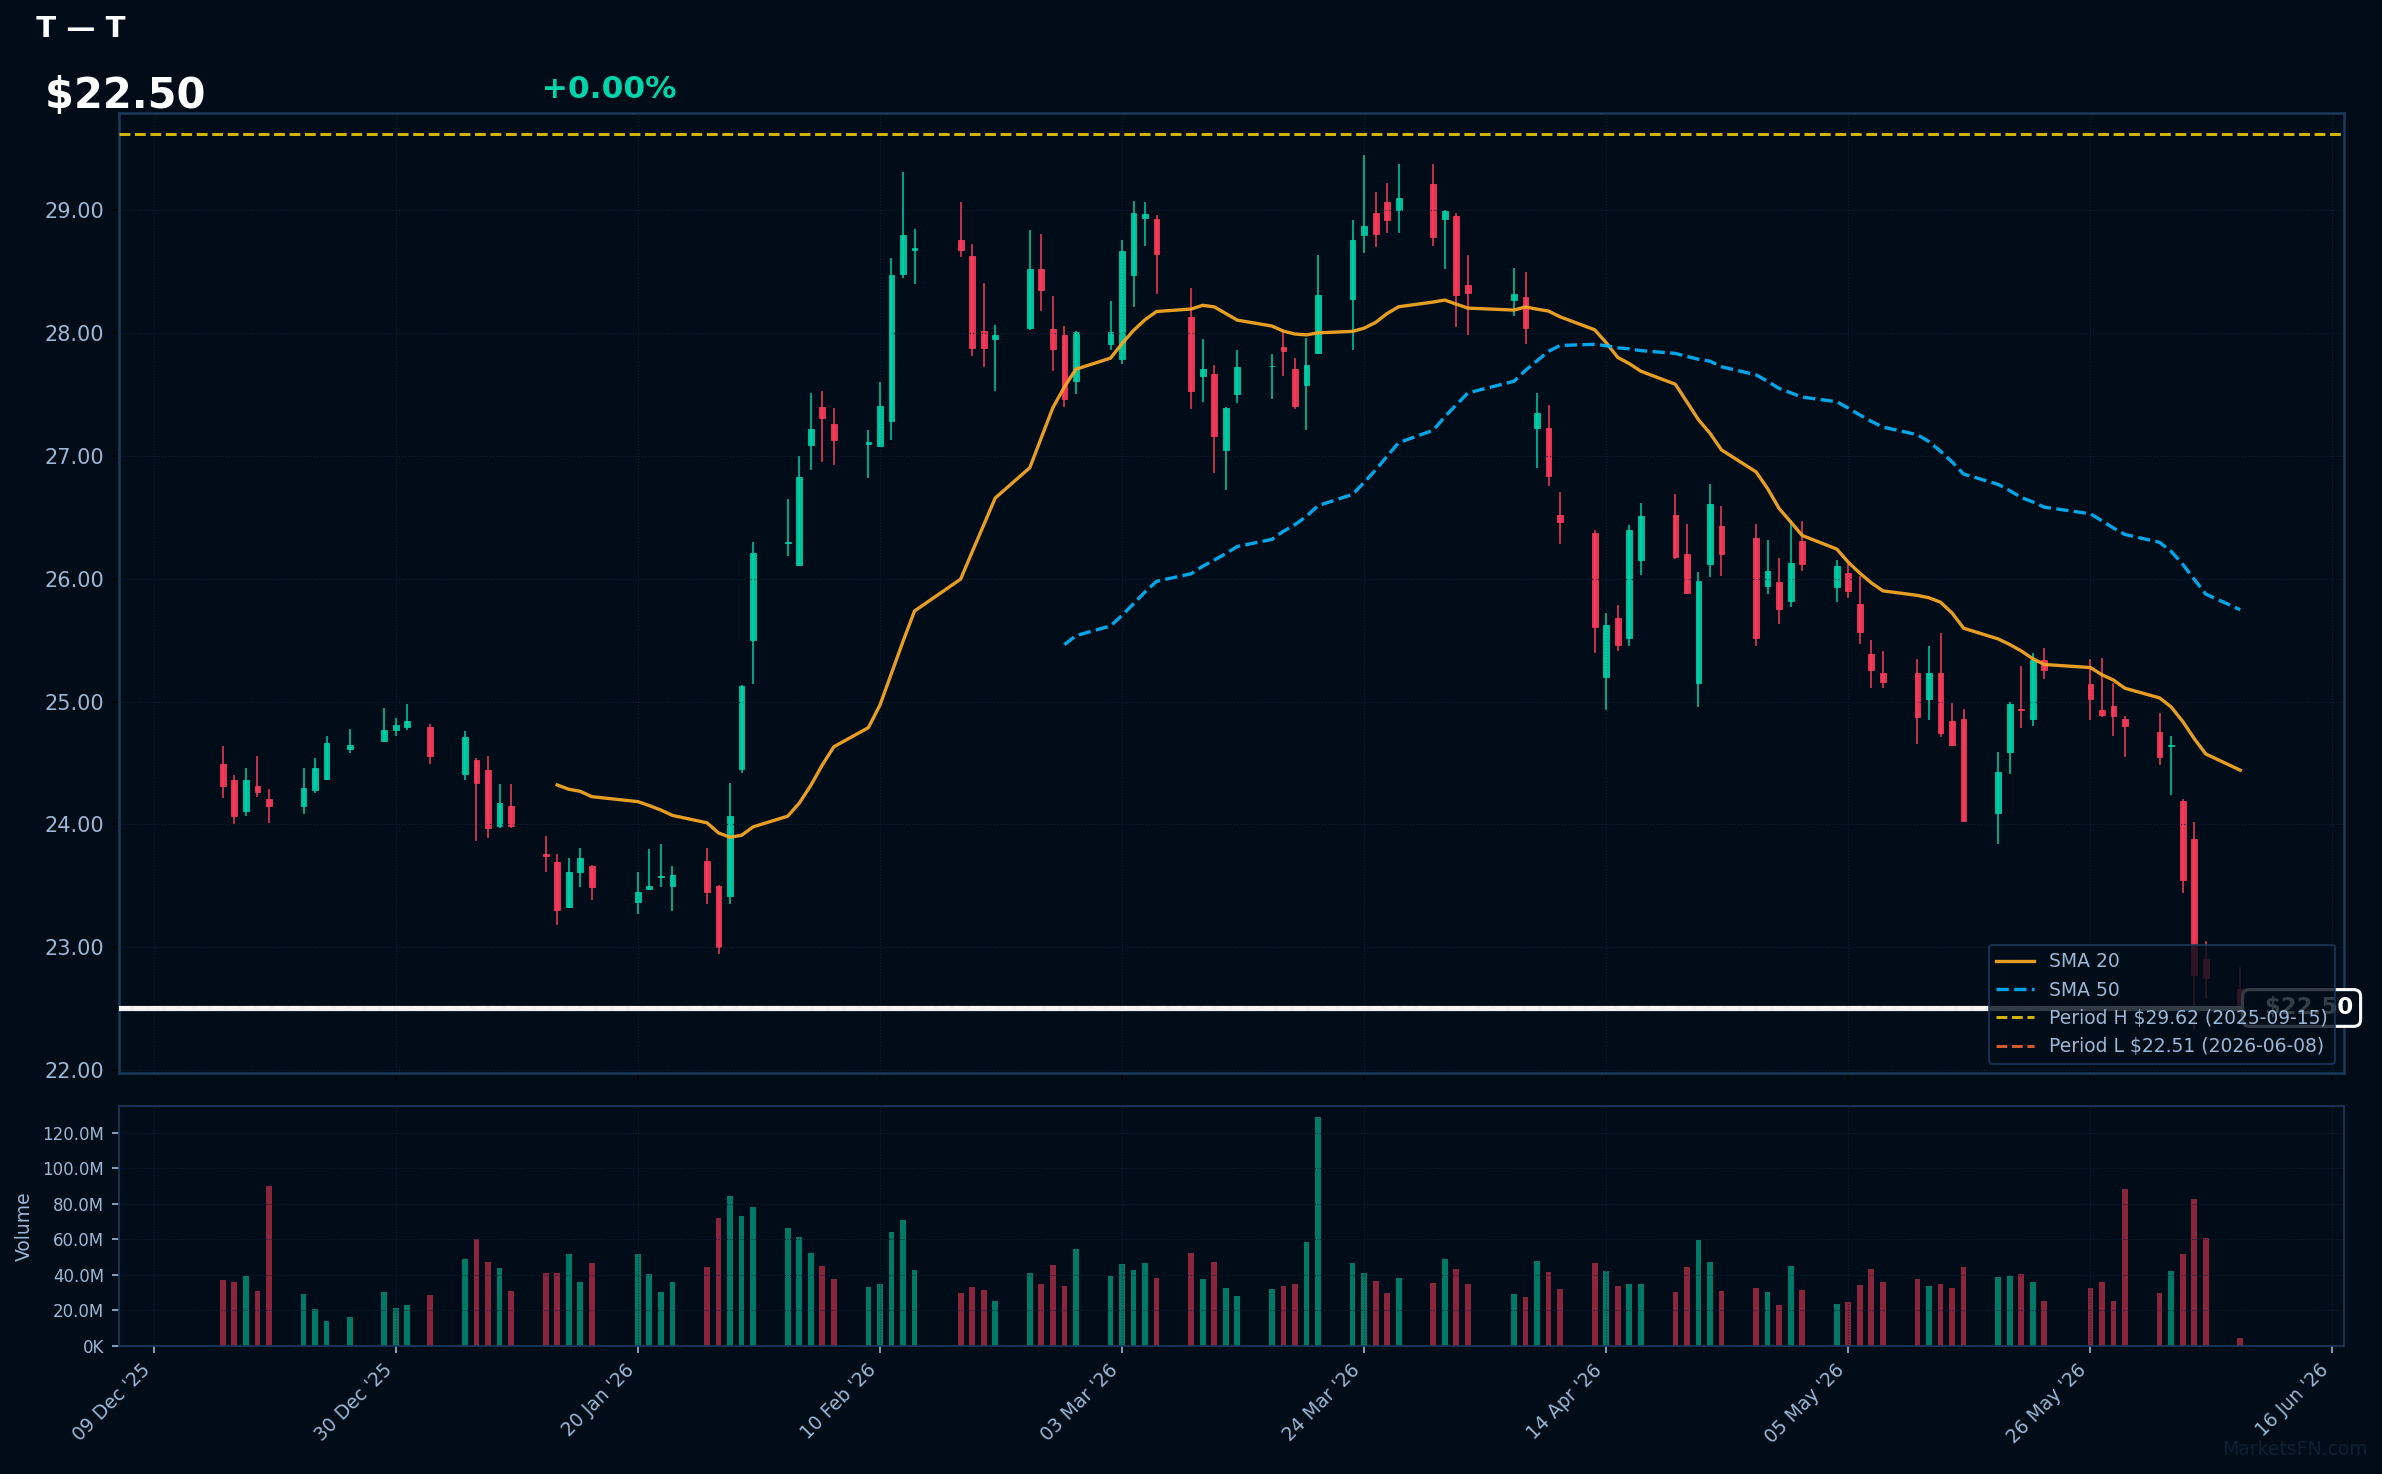
T | AT&T, Inc | Communication Services | Price Last: $22.51 | % Realized: -19.19% | RSI: 23.7 | % above MA200: -14.4% | Trend: Below MA20, MA50, MA200
AT&T, Inc is a telecommunications conglomerate providing wireless communications, local exchange, and long-distance services. Investors care due to its significant market presence and dividend yield, although its performance has been impacted by intense competition and regulatory changes.
AT&T's technical situation indicates a warning sign with an RSI(14) of 23.7, suggesting oversold conditions. The bearish MA alignment (price < MA20 < MA50 < MA200) confirms a sustained downtrend, and the stock is at its 52-Week low, testing major support.
Related headlines
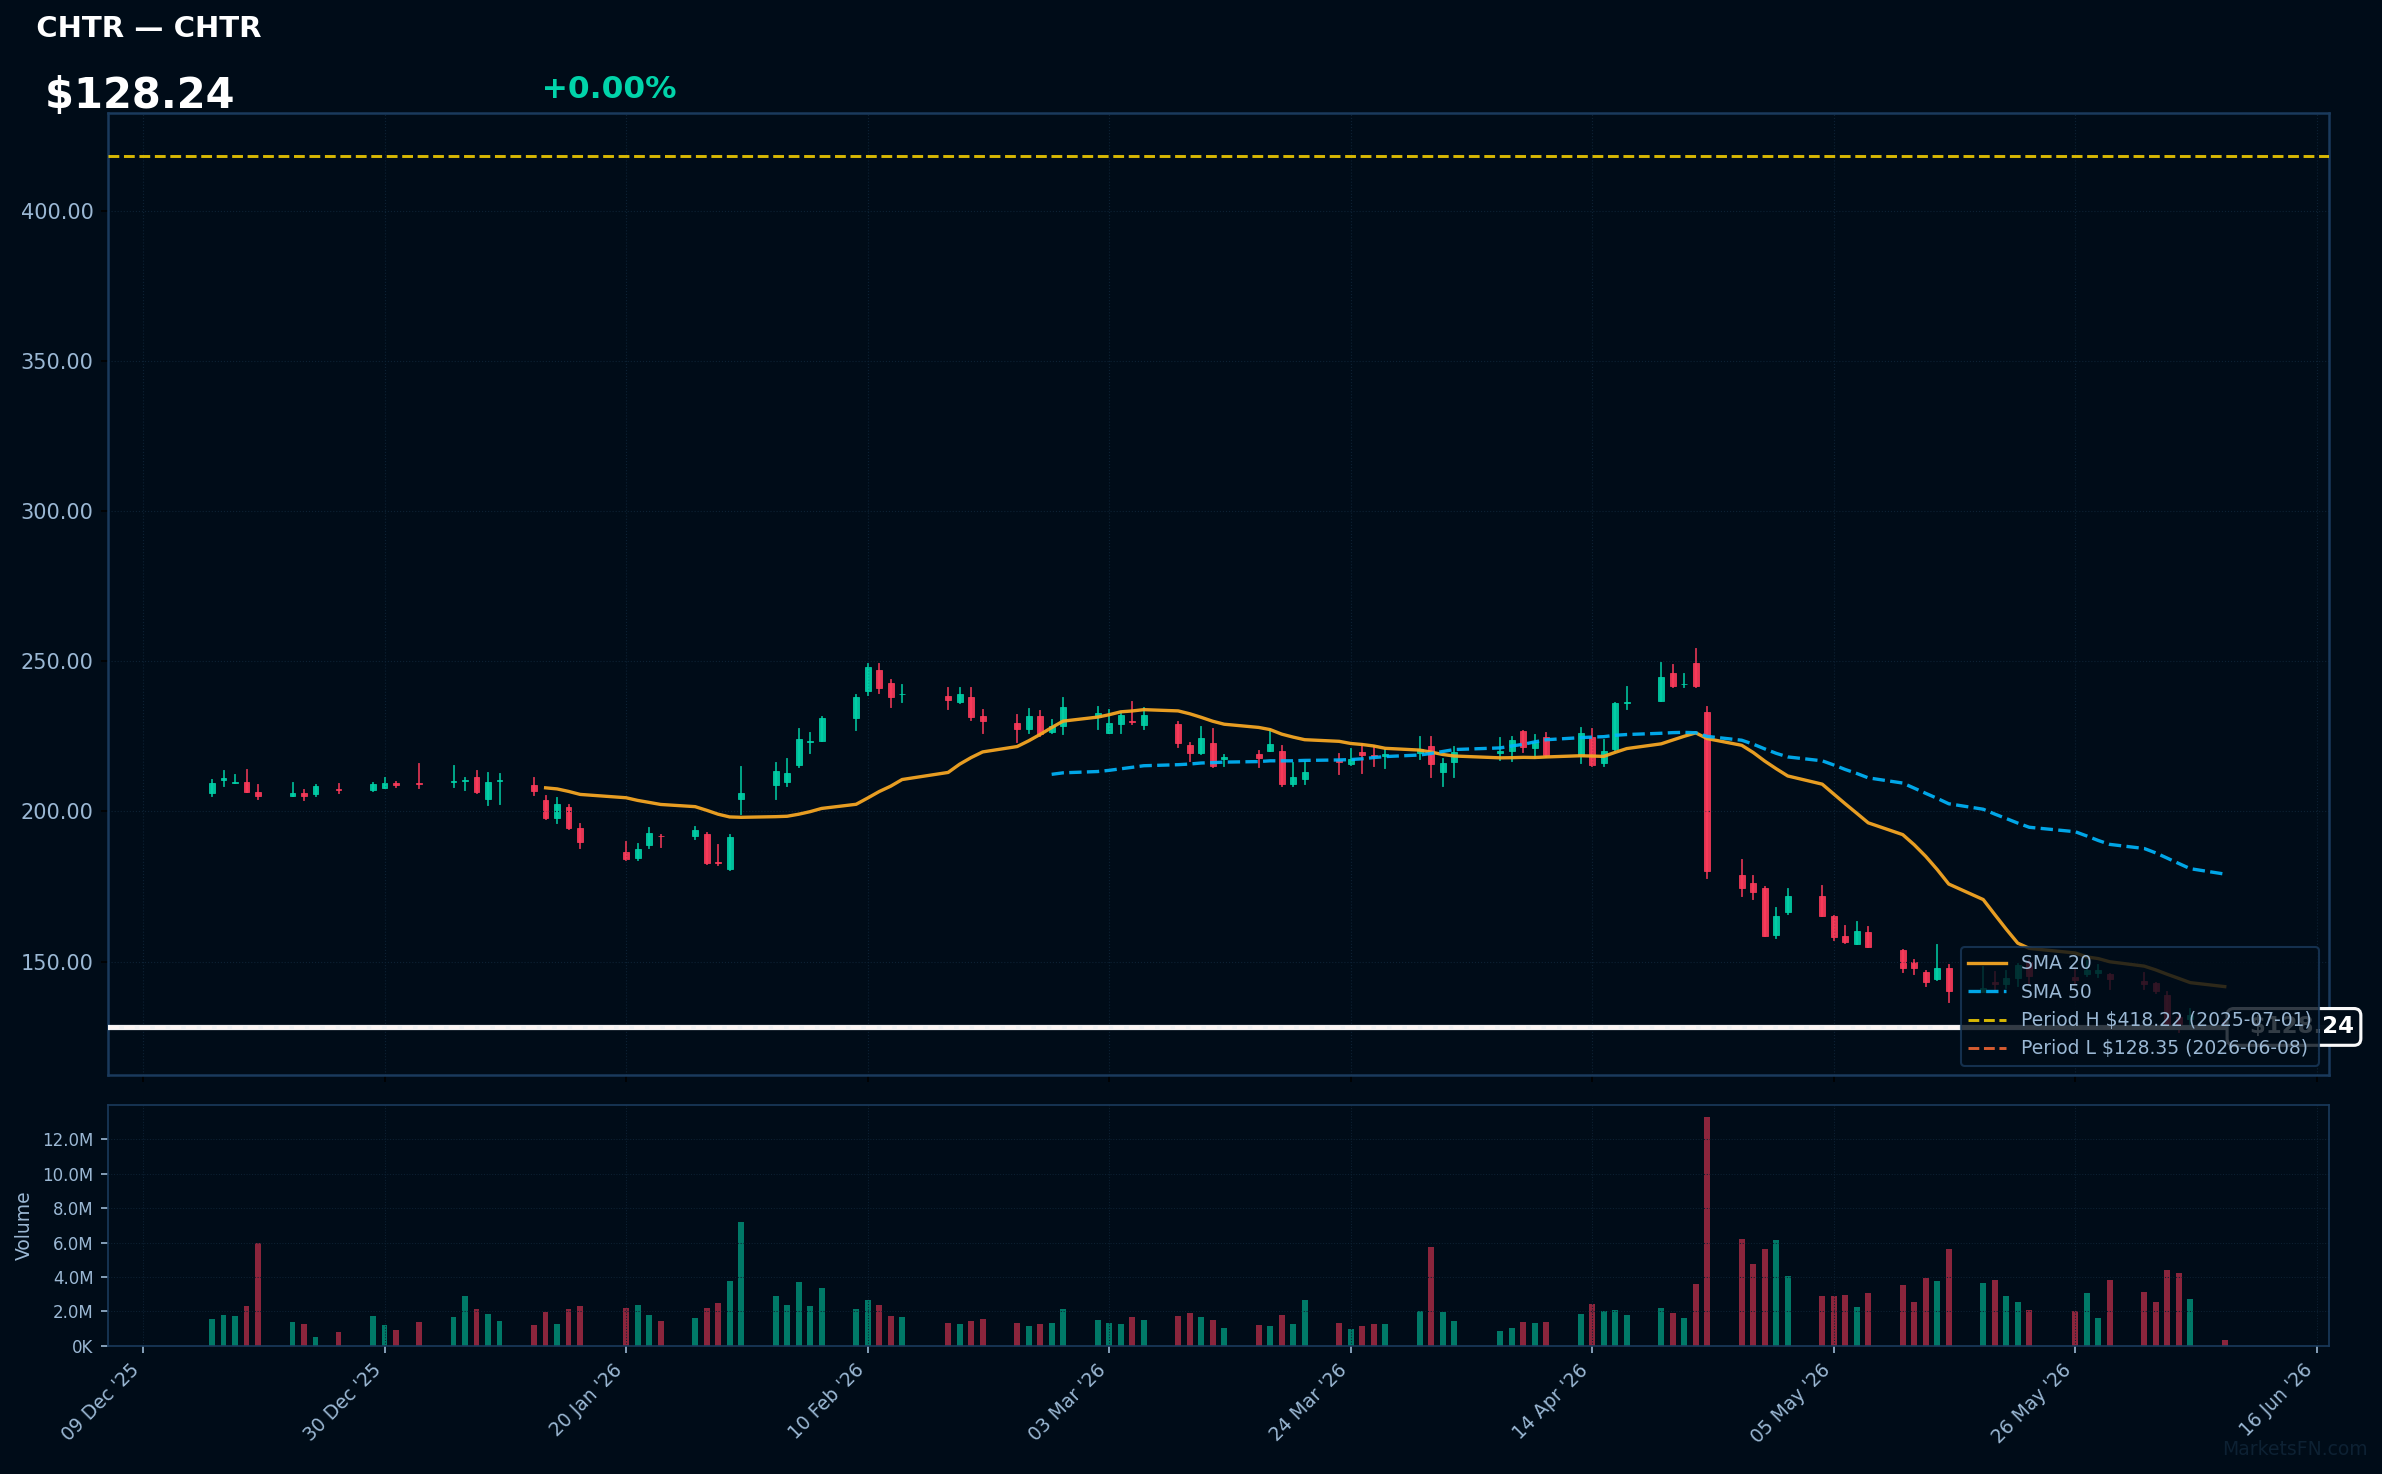
CHTR | Charter Communications Inc | Communication Services | Price Last: $128.35 | % Realized: -67.47% | RSI: 28.2 | % above MA200: -40.8% | Trend: Below MA20, MA50, MA200
Charter Communications Inc is a broadband connectivity company providing cable television, internet, and phone services to residential and commercial customers. Investors should care about its performance as it reflects the demand for high-speed internet and streaming services.
Charter Communications Inc is in a sustained downtrend with price ($128.24) below MA20, MA50, and MA200. The RSI(14) is 28.2, near oversold territory, and the stock is at its 52-Week low, indicating potential major support testing, a warning sign for investors.
Related headlines
- Charter Communications Inc. Cl A stock underperforms Wednesday when compared to competitors
- Charter Communications Inc. Cl A stock underperforms Friday when compared to competitors
- Charter to Participate in J.P. Morgan Global Technology, Media and Communications Conference
- Charter to Participate in MoffettNathanson Media, Internet & Communications Conference
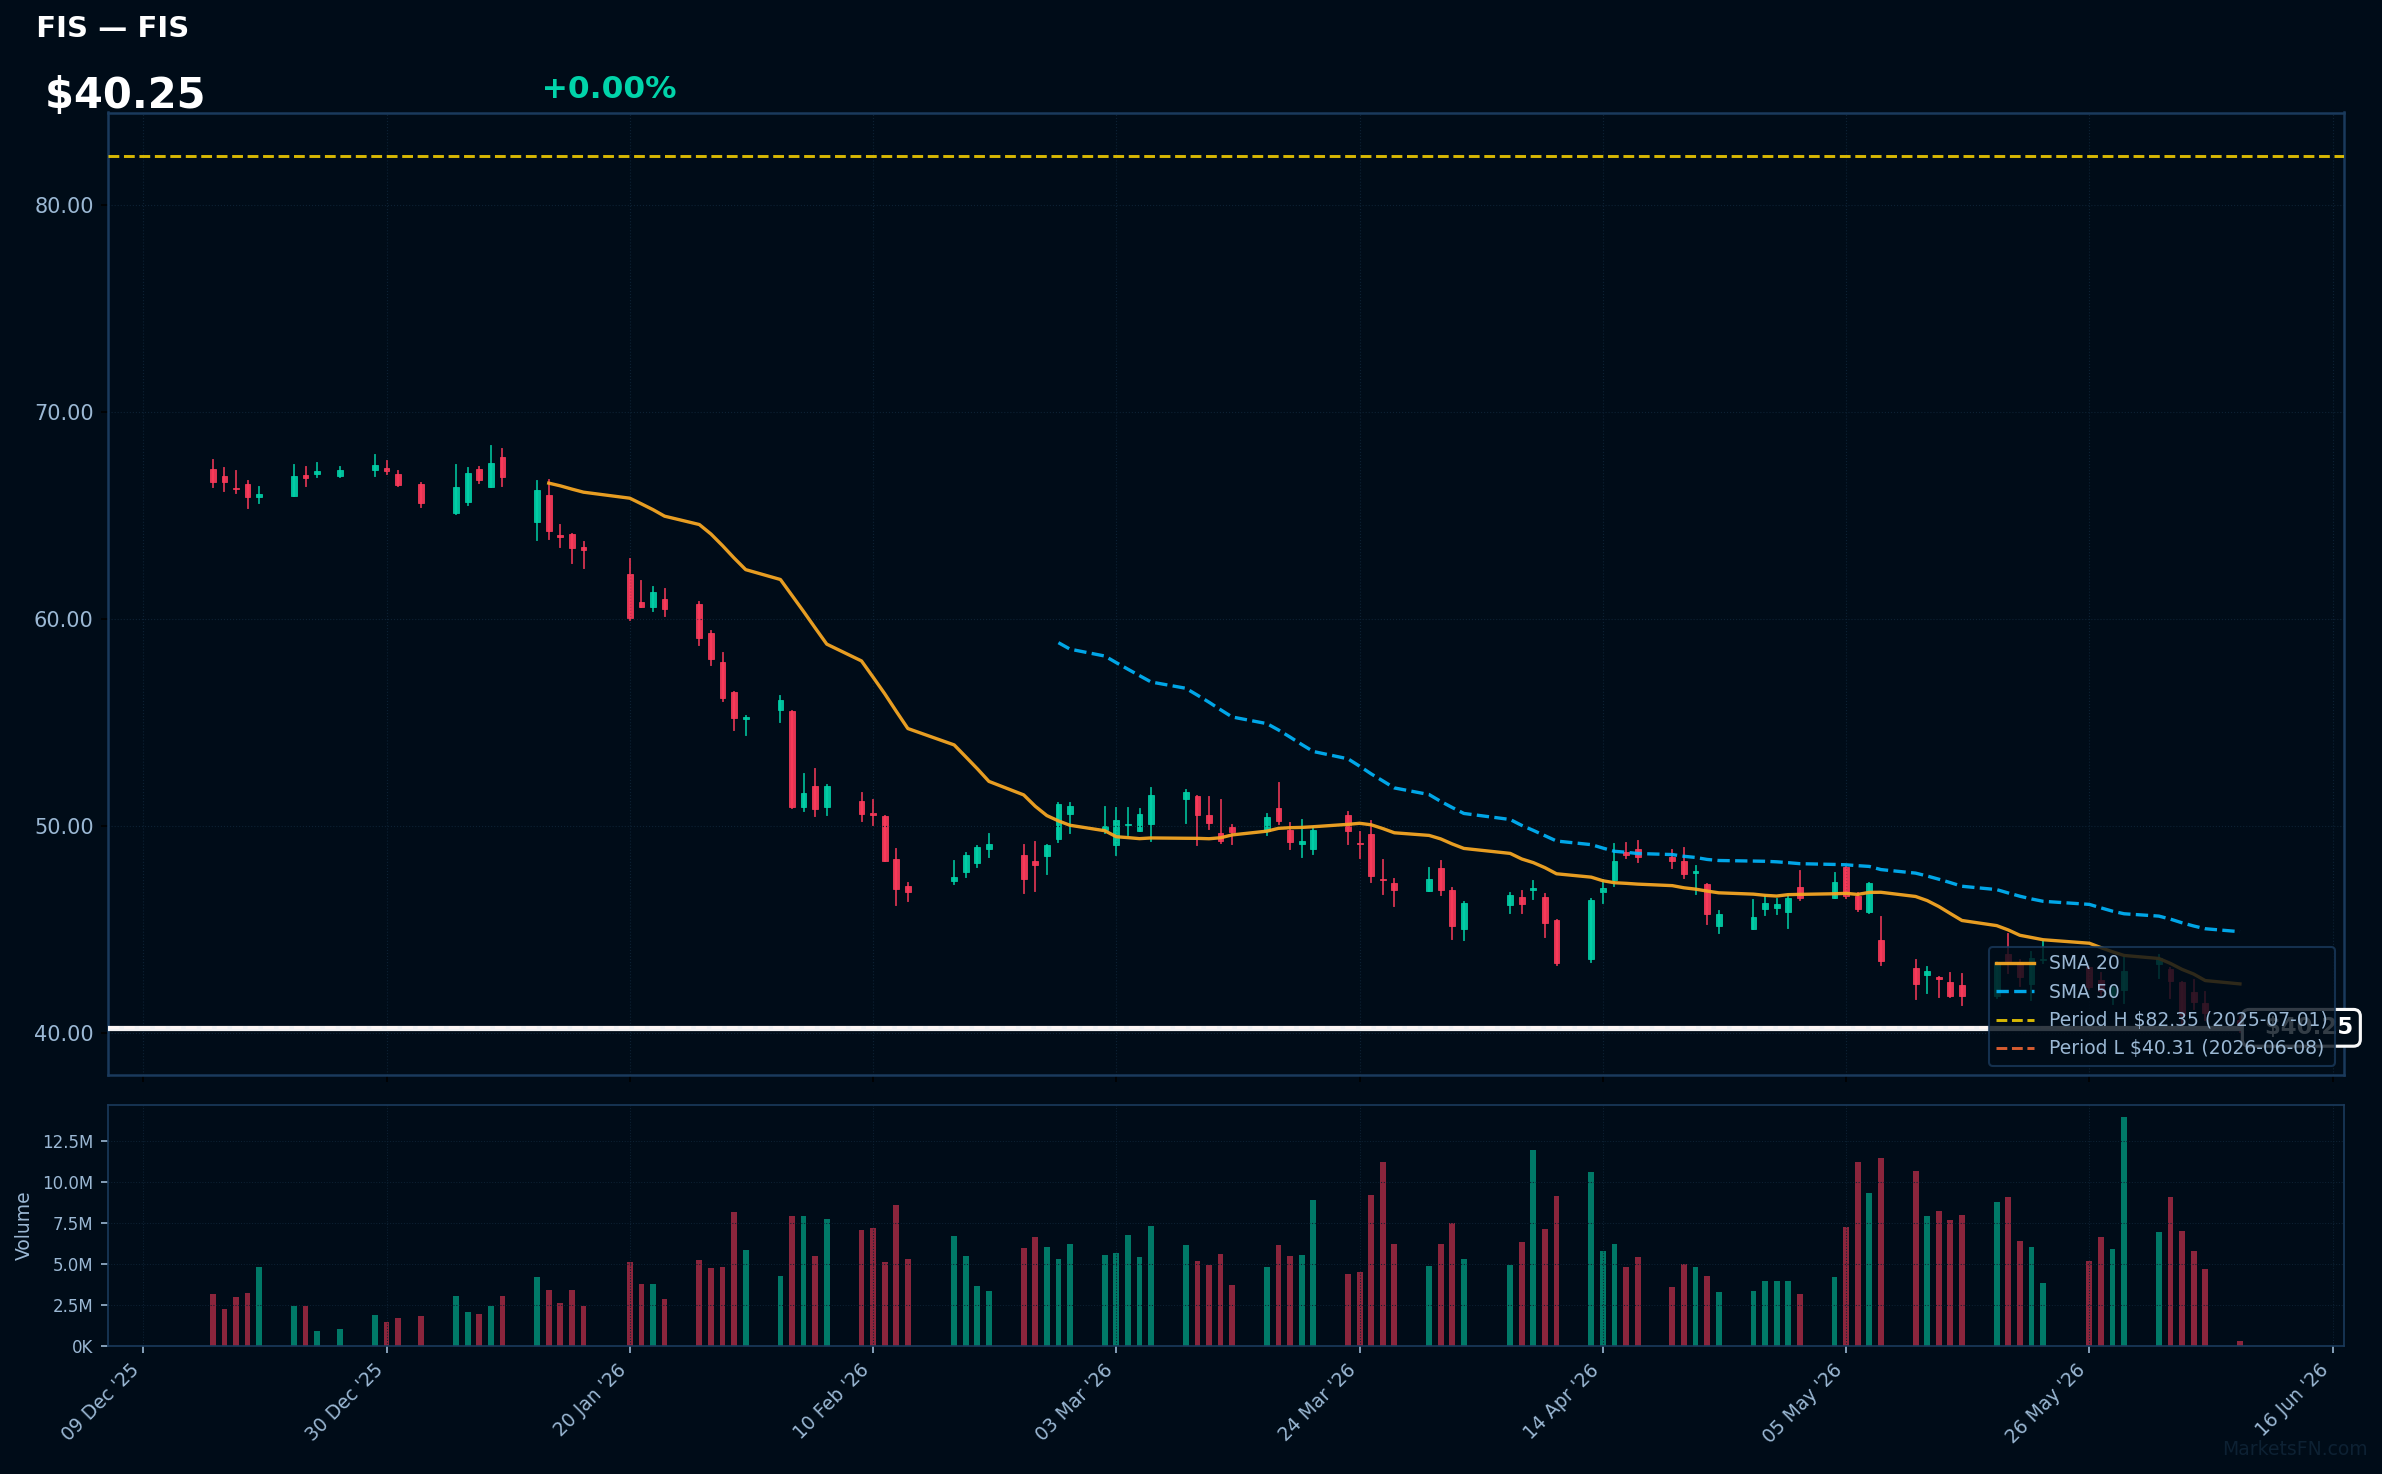
FIS | Fidelity National Information Services, Inc | Technology | Price Last: $40.31 | % Realized: -50.65% | RSI: 35.2 | % above MA200: -29.8% | Trend: Below MA20, MA50, MA200
Fidelity National Information Services, Inc (FIS) provides technology solutions for the financial services industry, including payment processing, risk management, and banking software. Investors should care about its performance as it reflects the health of the financial services sector.
FIS is in a sustained downtrend with price ($40.25) below MA20, MA50, and MA200. The RSI(14) is 35.2, near oversold territory, and the stock is at its 52-Week low, indicating a potential warning sign for investors.
Related headlines
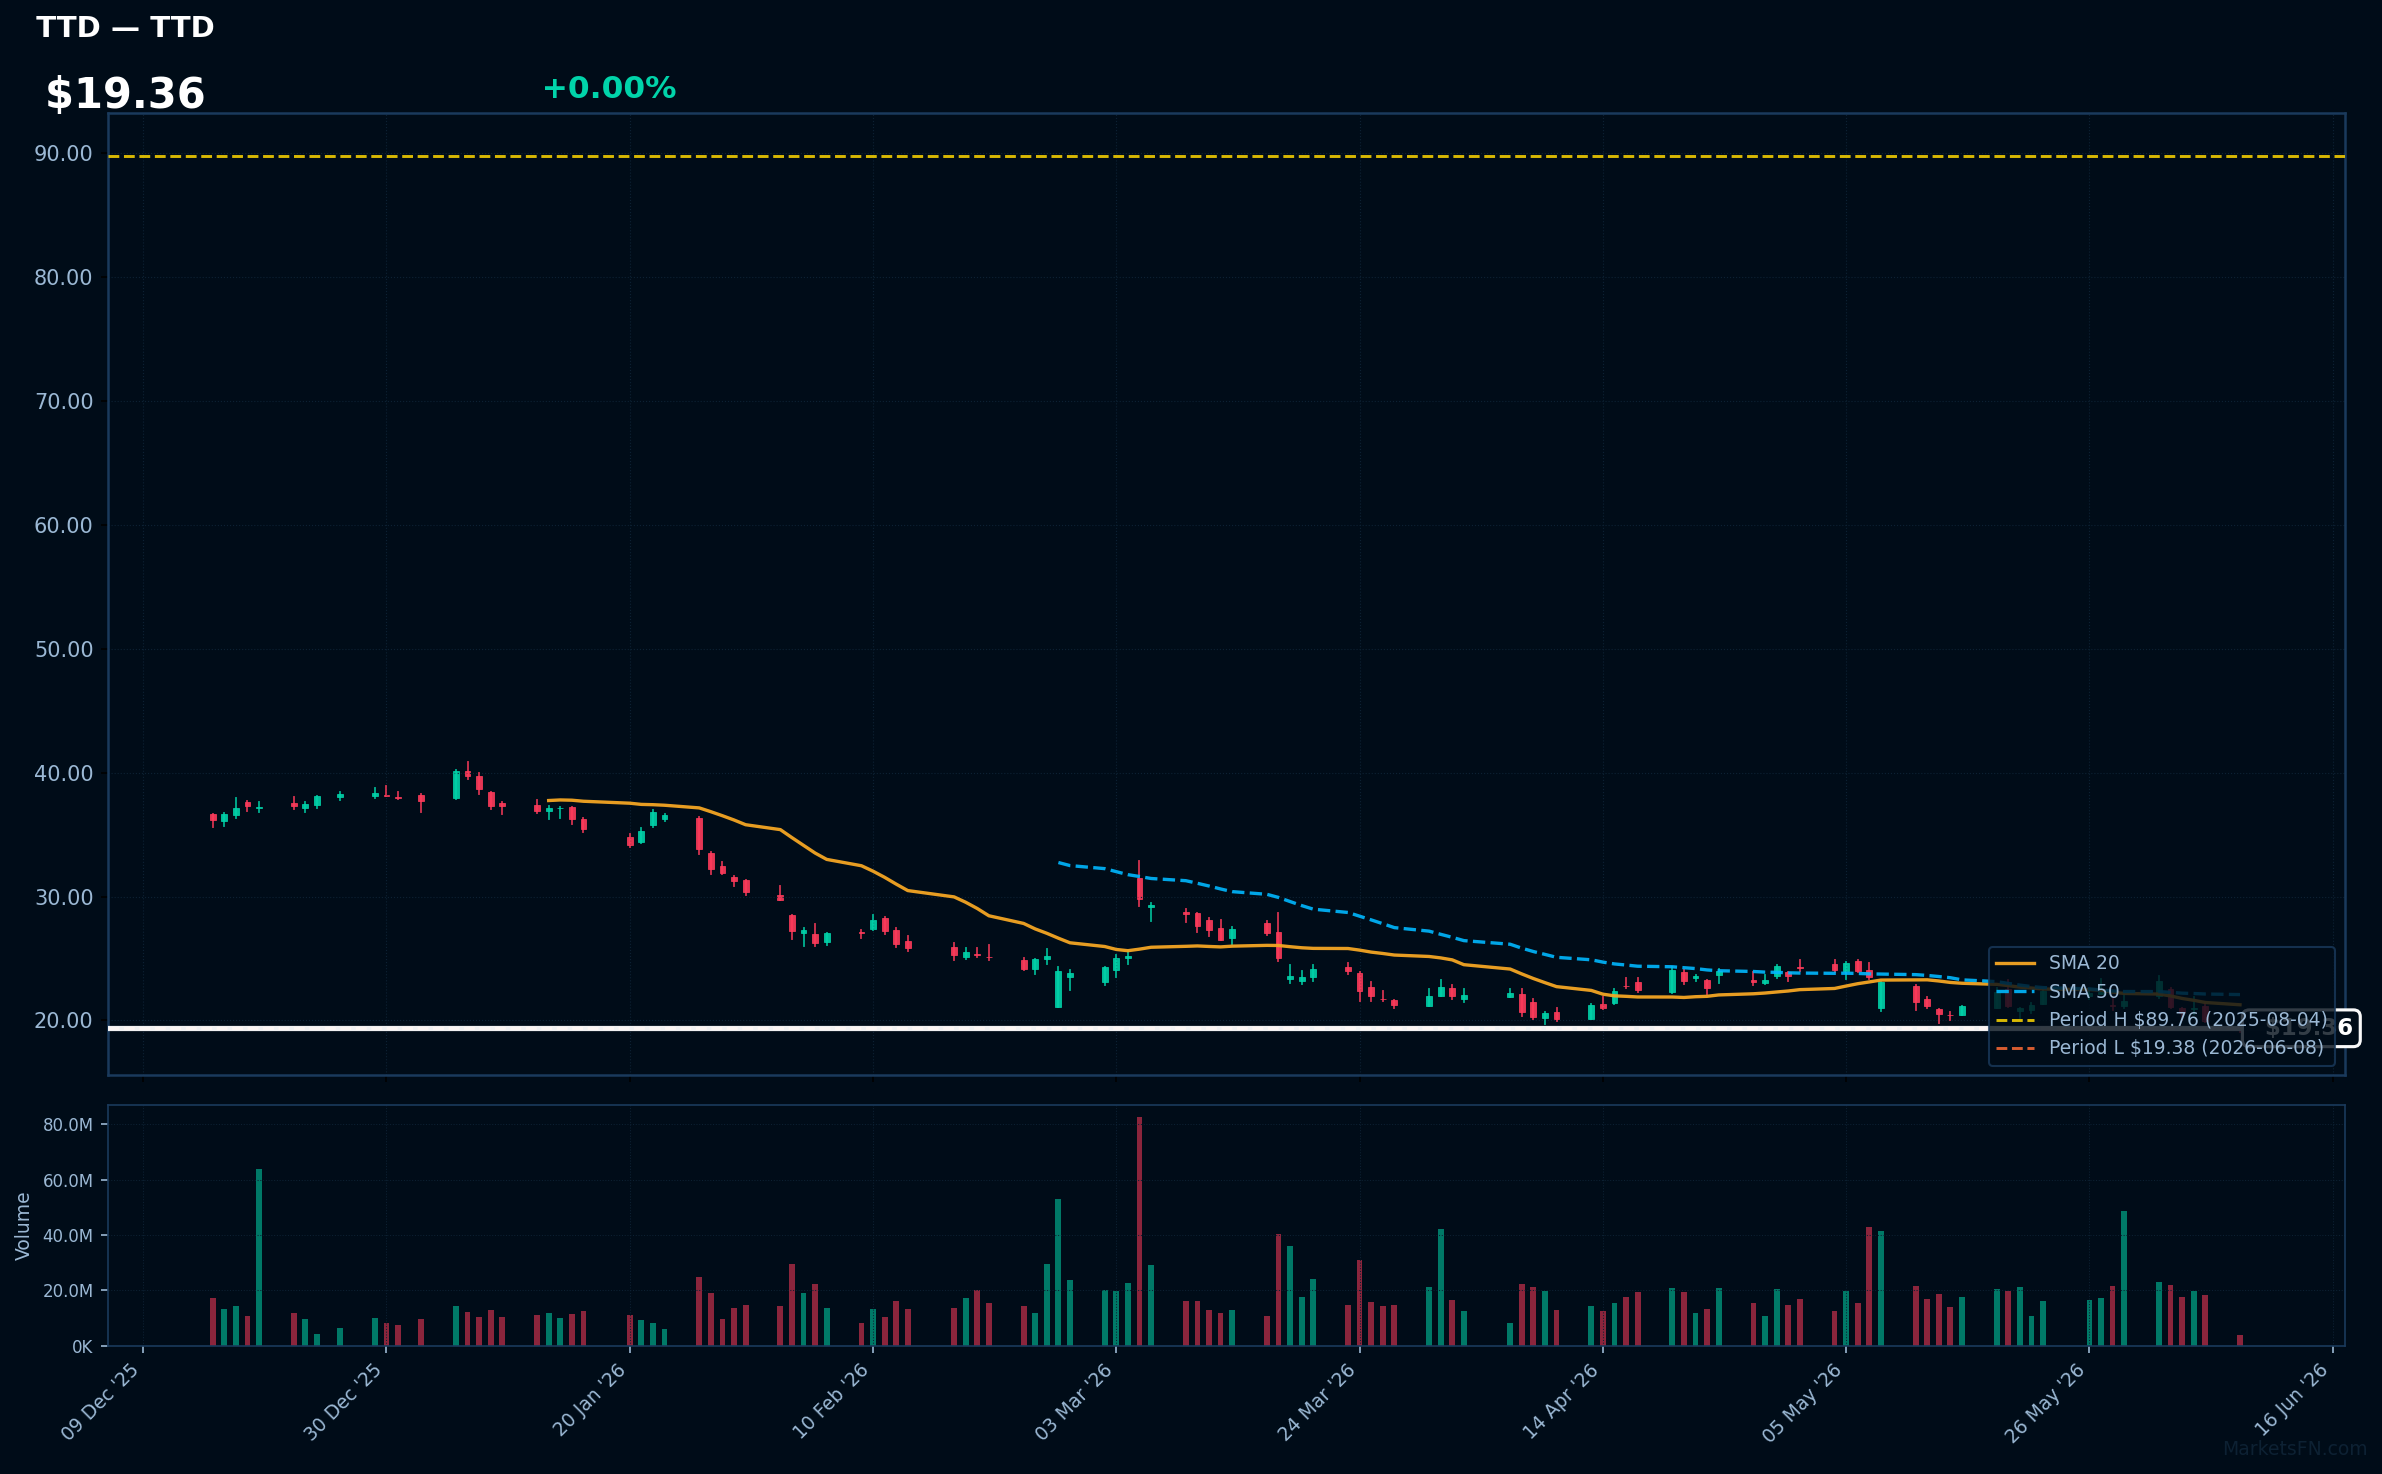
TTD | Trade Desk Inc | Communication Services | Price Last: $19.38 | % Realized: -72.90% | RSI: 38.5 | % above MA200: -44.8% | Trend: Below MA20, MA50, MA200
The Trade Desk Inc operates a demand-side platform enabling advertisers to manage digital ad campaigns across various channels and devices. Investors should care as it reflects the growth of digital advertising and the company's competitive positioning.
The stock is in a sustained downtrend with price ($19.36) below all MAs (MA20 < MA50 < MA200), RSI(14) at 38.5, and is 0.0% above its 52-Week low, indicating a warning sign with major support being tested after a -72.9% 52-Week return.
Related headlines
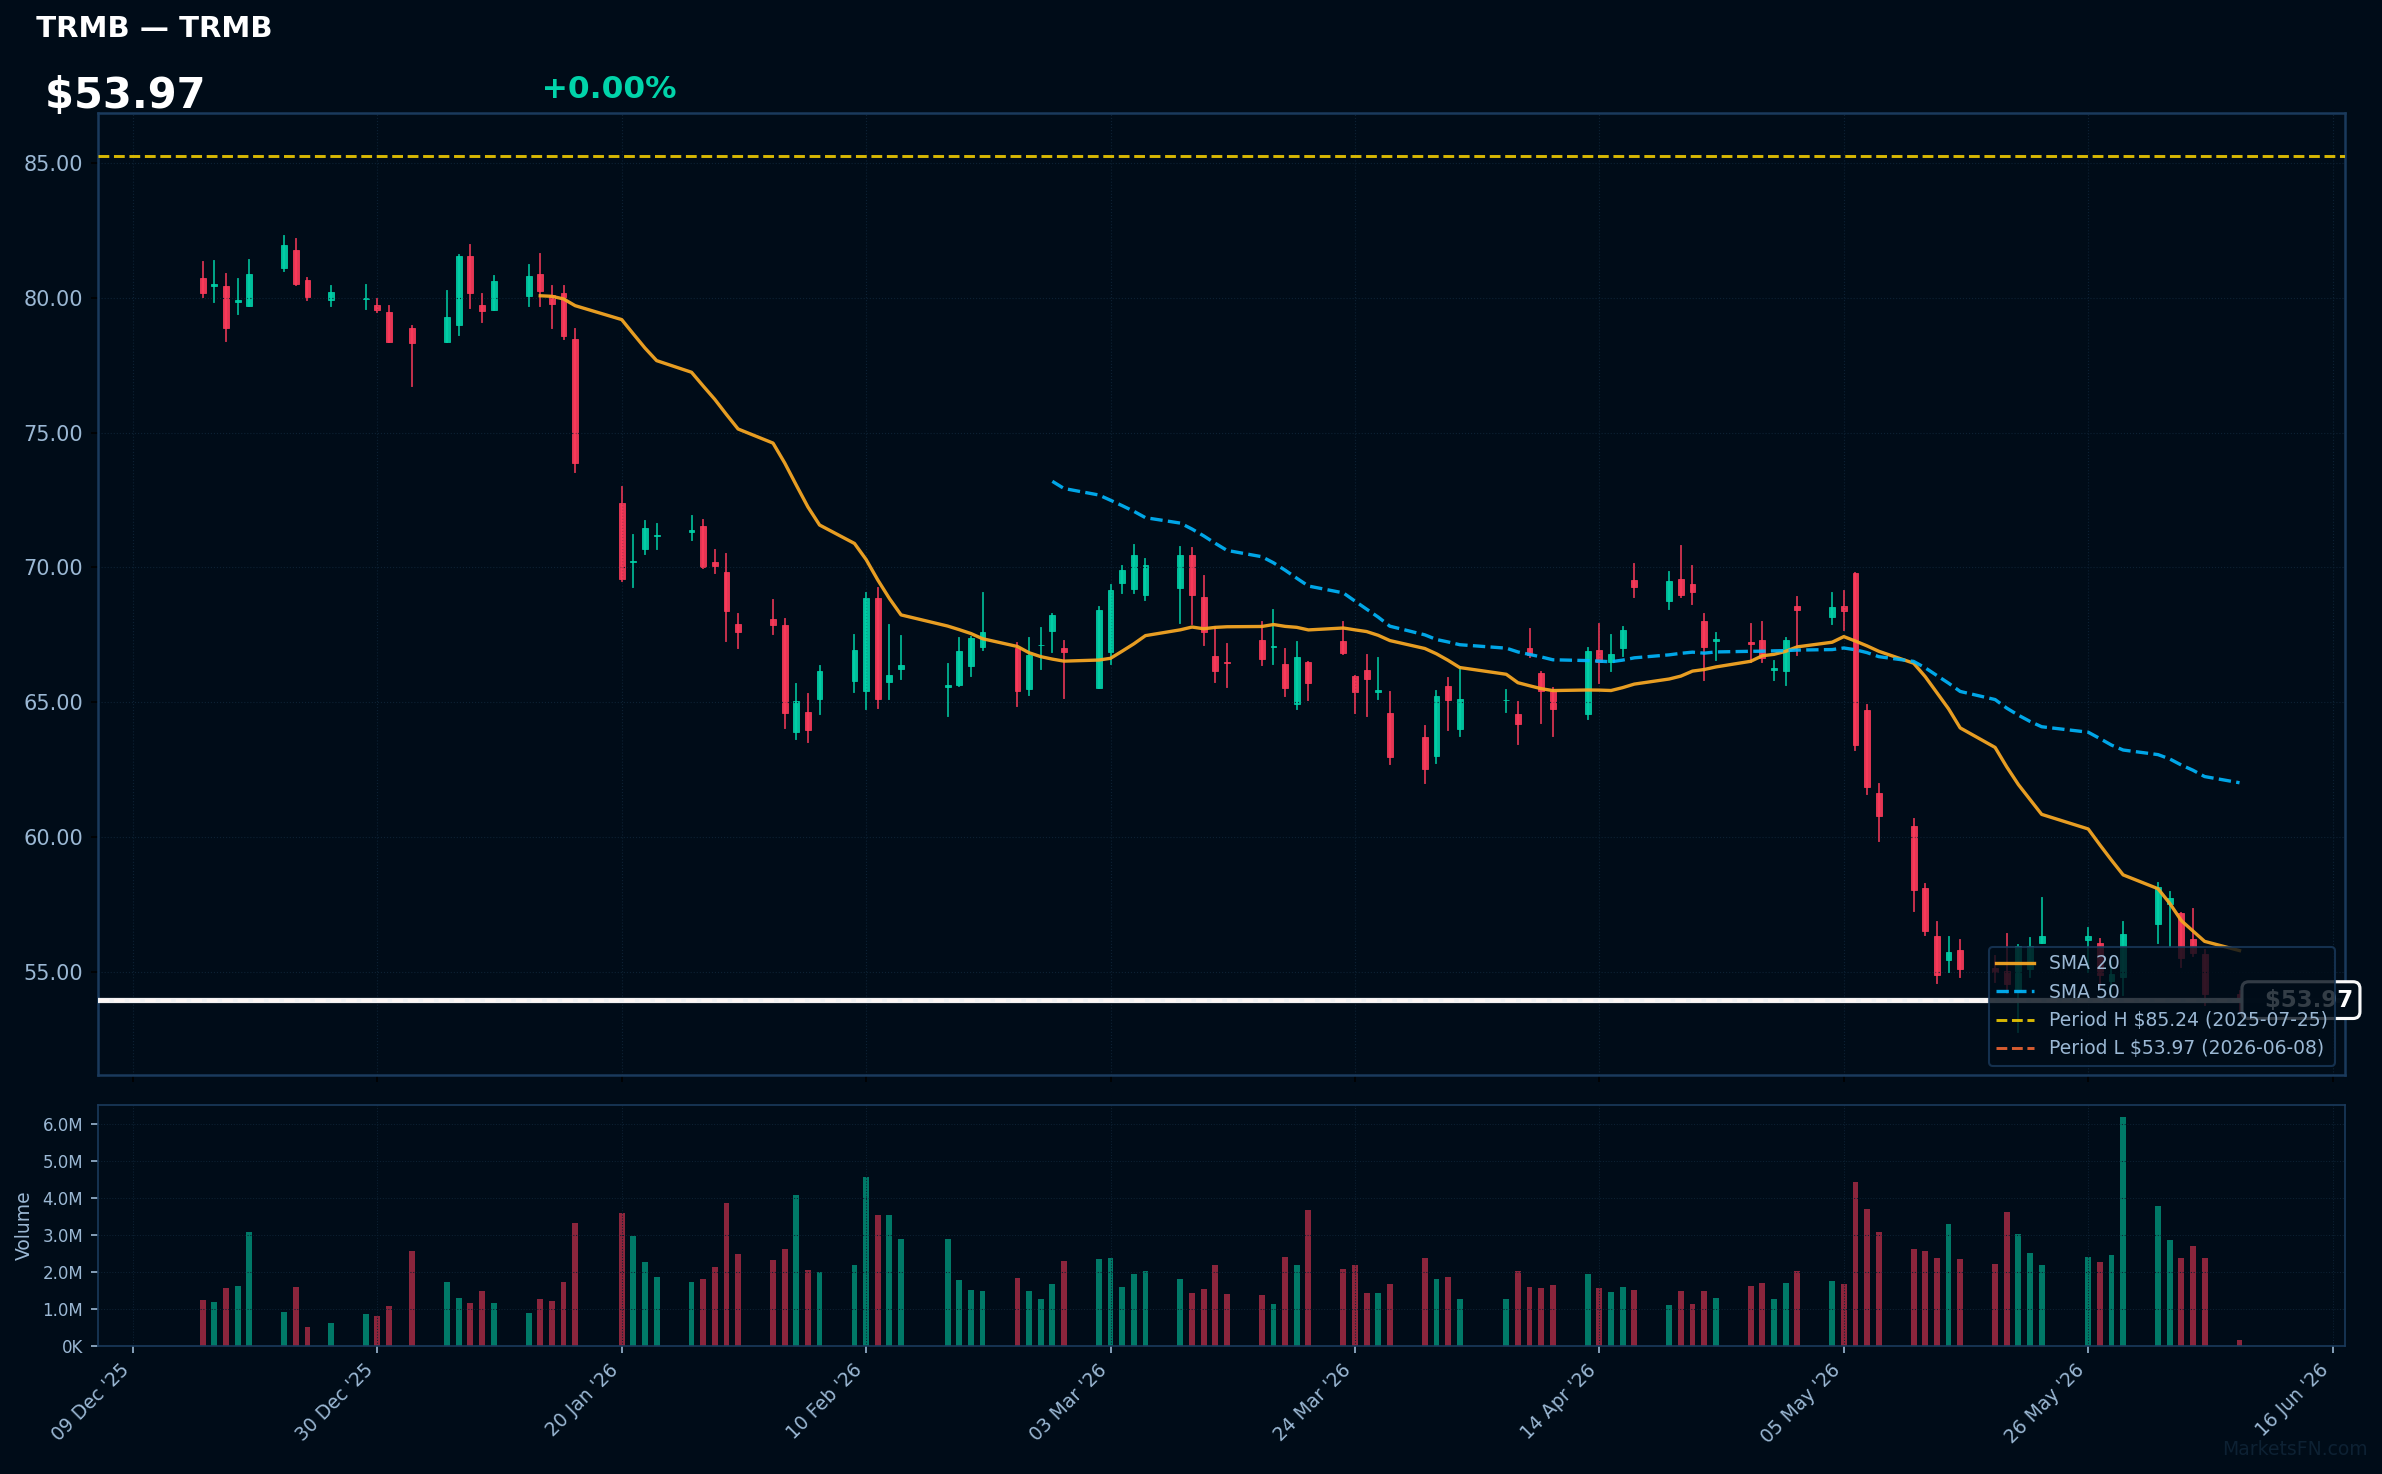
TRMB | Trimble Inc | Technology | Price Last: $53.97 | % Realized: -25.41% | RSI: 33.2 | % above MA200: -25.7% | Trend: Below MA20, MA50, MA200
Trimble Inc provides software, hardware, and services for industries like construction, agriculture, and transportation, enhancing productivity through precision technology and data analytics, making it a key player in the $60+ billion geospatial and construction technology market.
Trimble Inc's technical situation is bearish, with an RSI(14) of 33.2 indicating oversold conditions, and a sustained downtrend as price ($53.97) remains below MA20, MA50, and MA200, with the stock testing major support at its 52-Week low.
Related headlines
Market Commentary
The S&P 500 stocks listed are currently at 52-week extremes, with some at highs and others at lows. Stocks like LLY, CSX, MPC, STT, and ODFL are at their 52-week highs, while T, CHTR, FIS, TTD, and TRMB are at their 52-week lows. Being at these extremes can signal strong trends, either bullish or bearish, and may indicate a significant shift in market sentiment.
The stocks near 52-week highs are from diverse sectors, including healthcare (LLY), industrials (CSX, ODFL), energy (MPC), and financials (STT), suggesting broad-based strength. Conversely, the stocks near 52-week lows are from communications services (T, CHTR), financials (FIS), and technology (TTD, TRMB), potentially indicating sector-specific challenges. This dichotomy may be driven by sector rotation and macro themes such as economic growth, interest rates, and technological disruption.
Key levels to watch include the sustainability of these extreme price levels and potential catalysts such as earnings reports, economic data releases, and industry trends. Investors should monitor these stocks and their respective sectors for signs of trend continuation or reversal, as they can provide valuable insights into broader market dynamics.
Methodology: All 503 S&P 500 constituents screened. 52-week high = highest daily close over the past 252 trading days (approx. 1 year). 52-week low = lowest daily close over the same period. Distance = (current price / extreme − 1) × 100. Technical indicators computed on up to 1 year of daily OHLCV data.
Disclaimer: For informational purposes only. Not investment advice. Past performance is not indicative of future results.