S&P 500 52-Week Highs & Lows Radar: Lilly(Eli) & (LLY), Intuit (INTU) and more
· Stocks · MarketsFN Team
S&P 500 52-Week Highs & Lows Radar: Lilly(Eli) & (LLY), Intuit (INTU) and more
Screening all 503 S&P 500 constituents for stocks nearest to their 52-week high and their 52-week low. Data as of June 05, 2026. % Realized = 52-week total return.
Legend: RSI > 70 = overbought · RSI < 30 = oversold · Green % Realized = positive 52W return · Red = negative.
📈 Nearest to 52-Week High
Sectors represented: Healthcare (2), Financial (1), Consumer Cyclical (1), Real Estate (1)
| Ticker | Company | Sector | Price Last | % Realized | 52-Week High Date | RSI | % above MA200 | Trend |
|---|---|---|---|---|---|---|---|---|
| LLY | Lilly(Eli) & Co | Healthcare | $1146.95 | +49.79% | 2026-06-05 | 70.1 | +21.0% | Above MA20, MA50, MA200 |
| BK | Bank Of New York Mellon Corp | Financial | $144.02 | +62.59% | 2026-06-04 | 68.7 | +22.4% | Above MA20, MA50, MA200 |
| MAR | Marriott International, Inc | Consumer Cyclical | $391.47 | +50.68% | 2026-06-05 | 68.6 | +24.9% | Above MA20, MA50, MA200 |
| ELV | Elevance Health Inc | Healthcare | $411.99 | +7.11% | 2026-06-05 | 67.8 | +22.2% | Above MA20, MA50, MA200 |
| SPG | Simon Property Group, Inc | Real Estate | $208.38 | +29.63% | 2026-06-05 | 61.3 | +10.3% | Above MA20, MA50, MA200 |
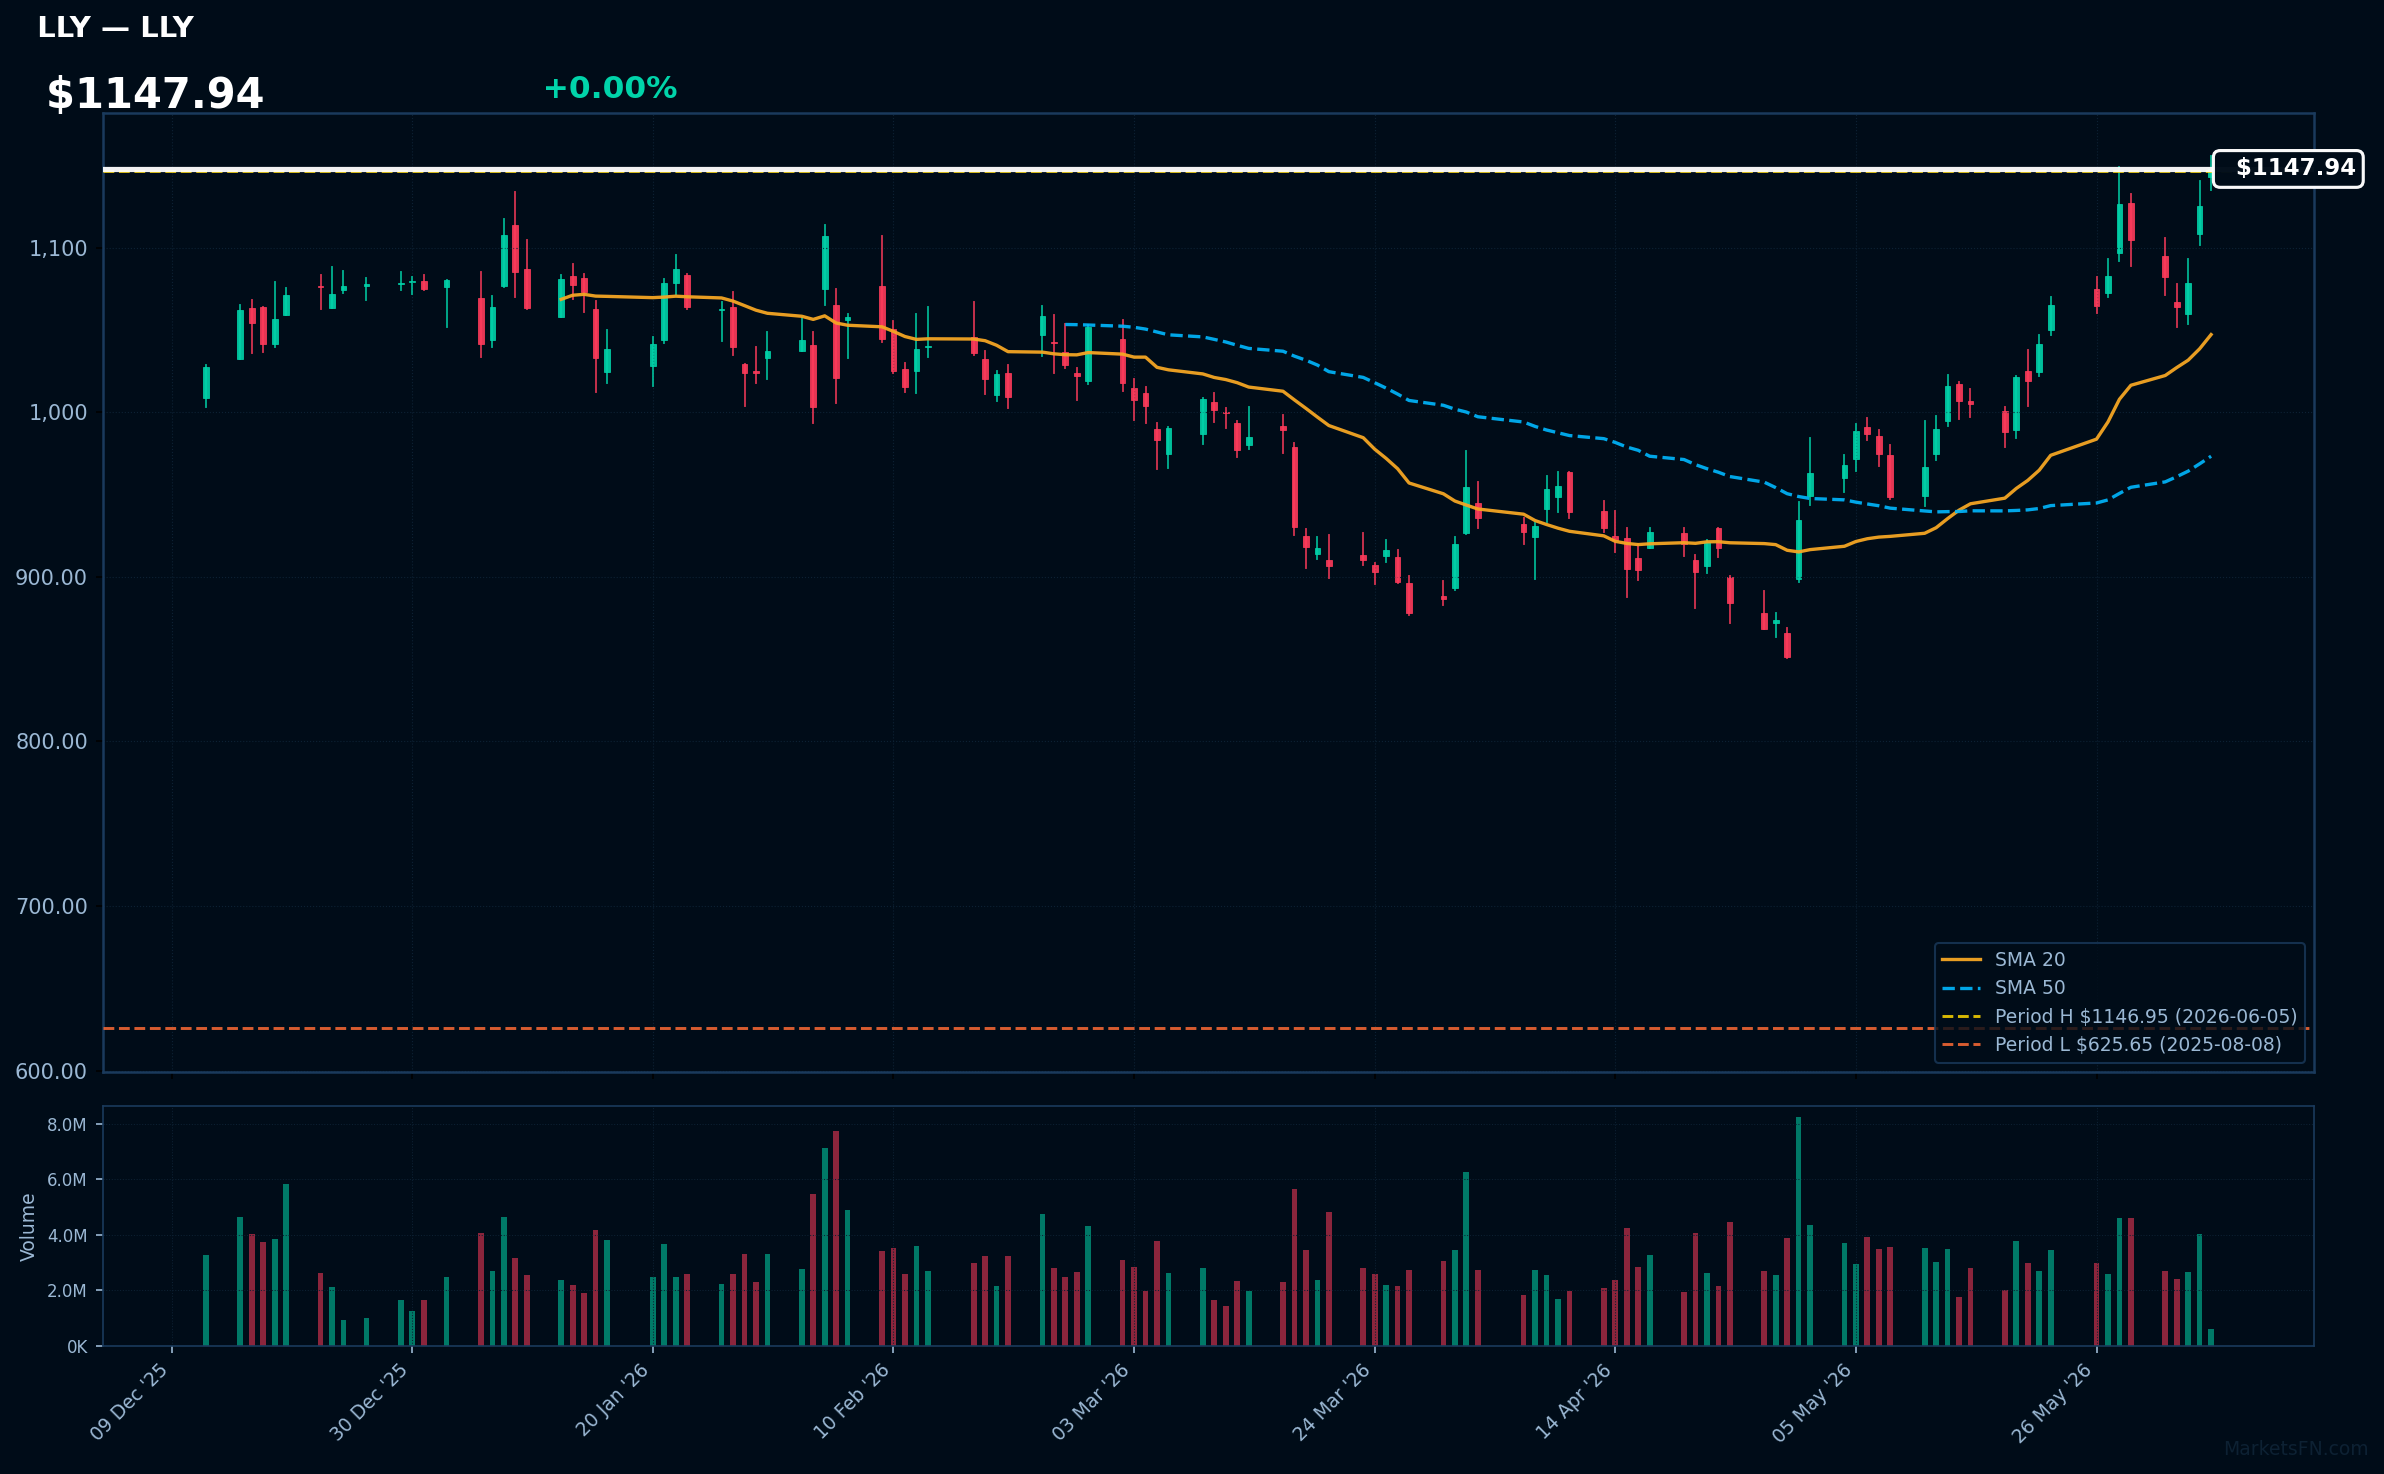
LLY | Lilly(Eli) & Co | Healthcare | Price Last: $1146.95 | % Realized: +49.79% | RSI: 70.1 | % above MA200: +21.0% | Trend: Above MA20, MA50, MA200
Eli Lilly is a pharmaceutical company developing and marketing medicines; investors should care about its pipeline and product sales. Specifically, its diabetes and obesity treatments are significant revenue drivers.
Lilly's technicals indicate strong momentum: RSI(14) is 70.1, and the stock is in a sustained uptrend with price > MA20 > MA50 > MA200. It's 0.0% below its 52-Week high, near a potential breakout.
Related headlines
- TD Cowen Raises GLP-1 Sales Forecast To $150B By 2030 Industry Leaders LLY, NVO To Remain Dominant
- HIMS Stock Slides Overnight: CEO Sees Healthcare Potential In Anthropic's AI Leap As Lilly, WeightWatchers Turn Up The Heat
- Gilead, Merck, Eli Lilly Lead $106B Biopharma Takeover Wave In 2026
- 75% Upside For LLY Stock?
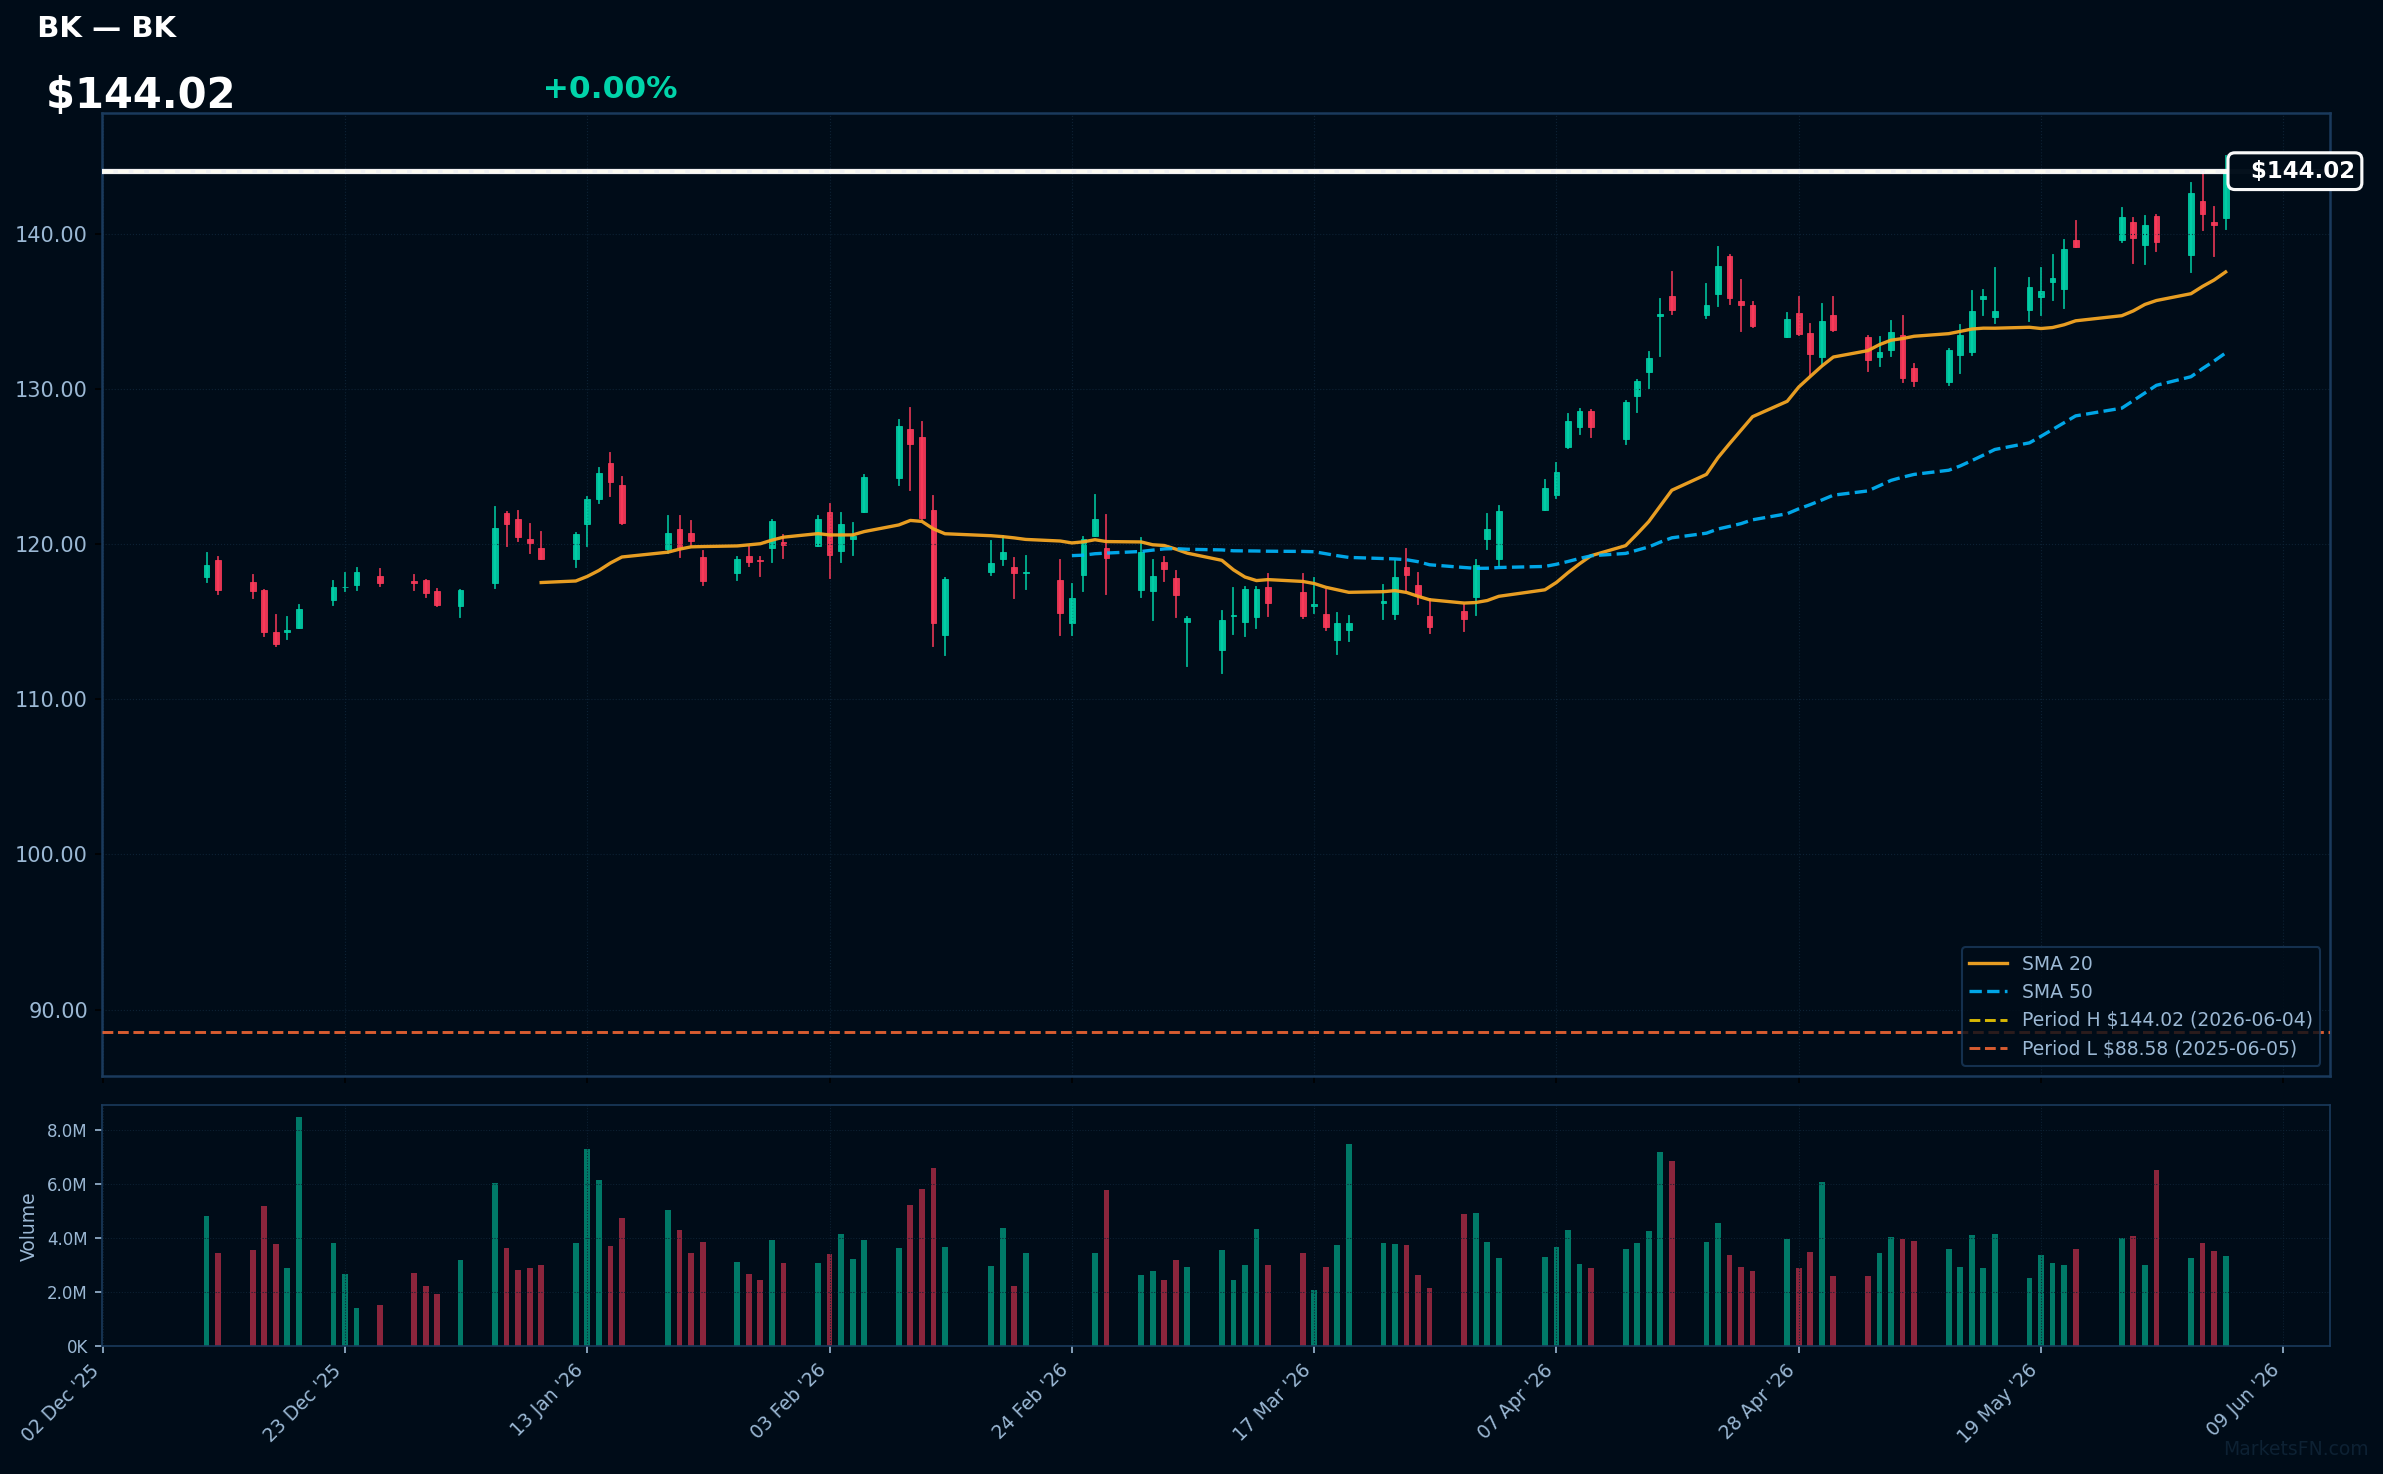
BK | Bank Of New York Mellon Corp | Financial | Price Last: $144.02 | % Realized: +62.59% | RSI: 68.7 | % above MA200: +22.4% | Trend: Above MA20, MA50, MA200
Bank Of New York Mellon Corp is a financial services company providing custody and trust services, securities lending, and asset management. Investors care about its stable revenue streams and exposure to growing asset management trends.
The stock shows bullish MA alignment with price > MA20 > MA50 > MA200 and RSI(14) at 68.7, indicating sustained uptrend and strong momentum. It's 0.0% below its 52-Week high, near a potential breakout level.
Related headlines
- Bank of New York Mellon Corp (BK) Q1 2026 Earnings Call Highlights: Record Revenue and AI ...
- The Bank of New York Mellon Corporation Q1 2026 Earnings Call Summary
- BNY Announces Redemption of Fixed Rate / Floating Rate Callable Senior Bank Notes Due 2027, Floating Rate Callable Senior Bank Notes Due 2027 and Fixed Rate / Floating Rate Callable Senior Notes Due 2027
- BNYs BKDV Large-Cap Value ETF Passes $1 Billion in AUM
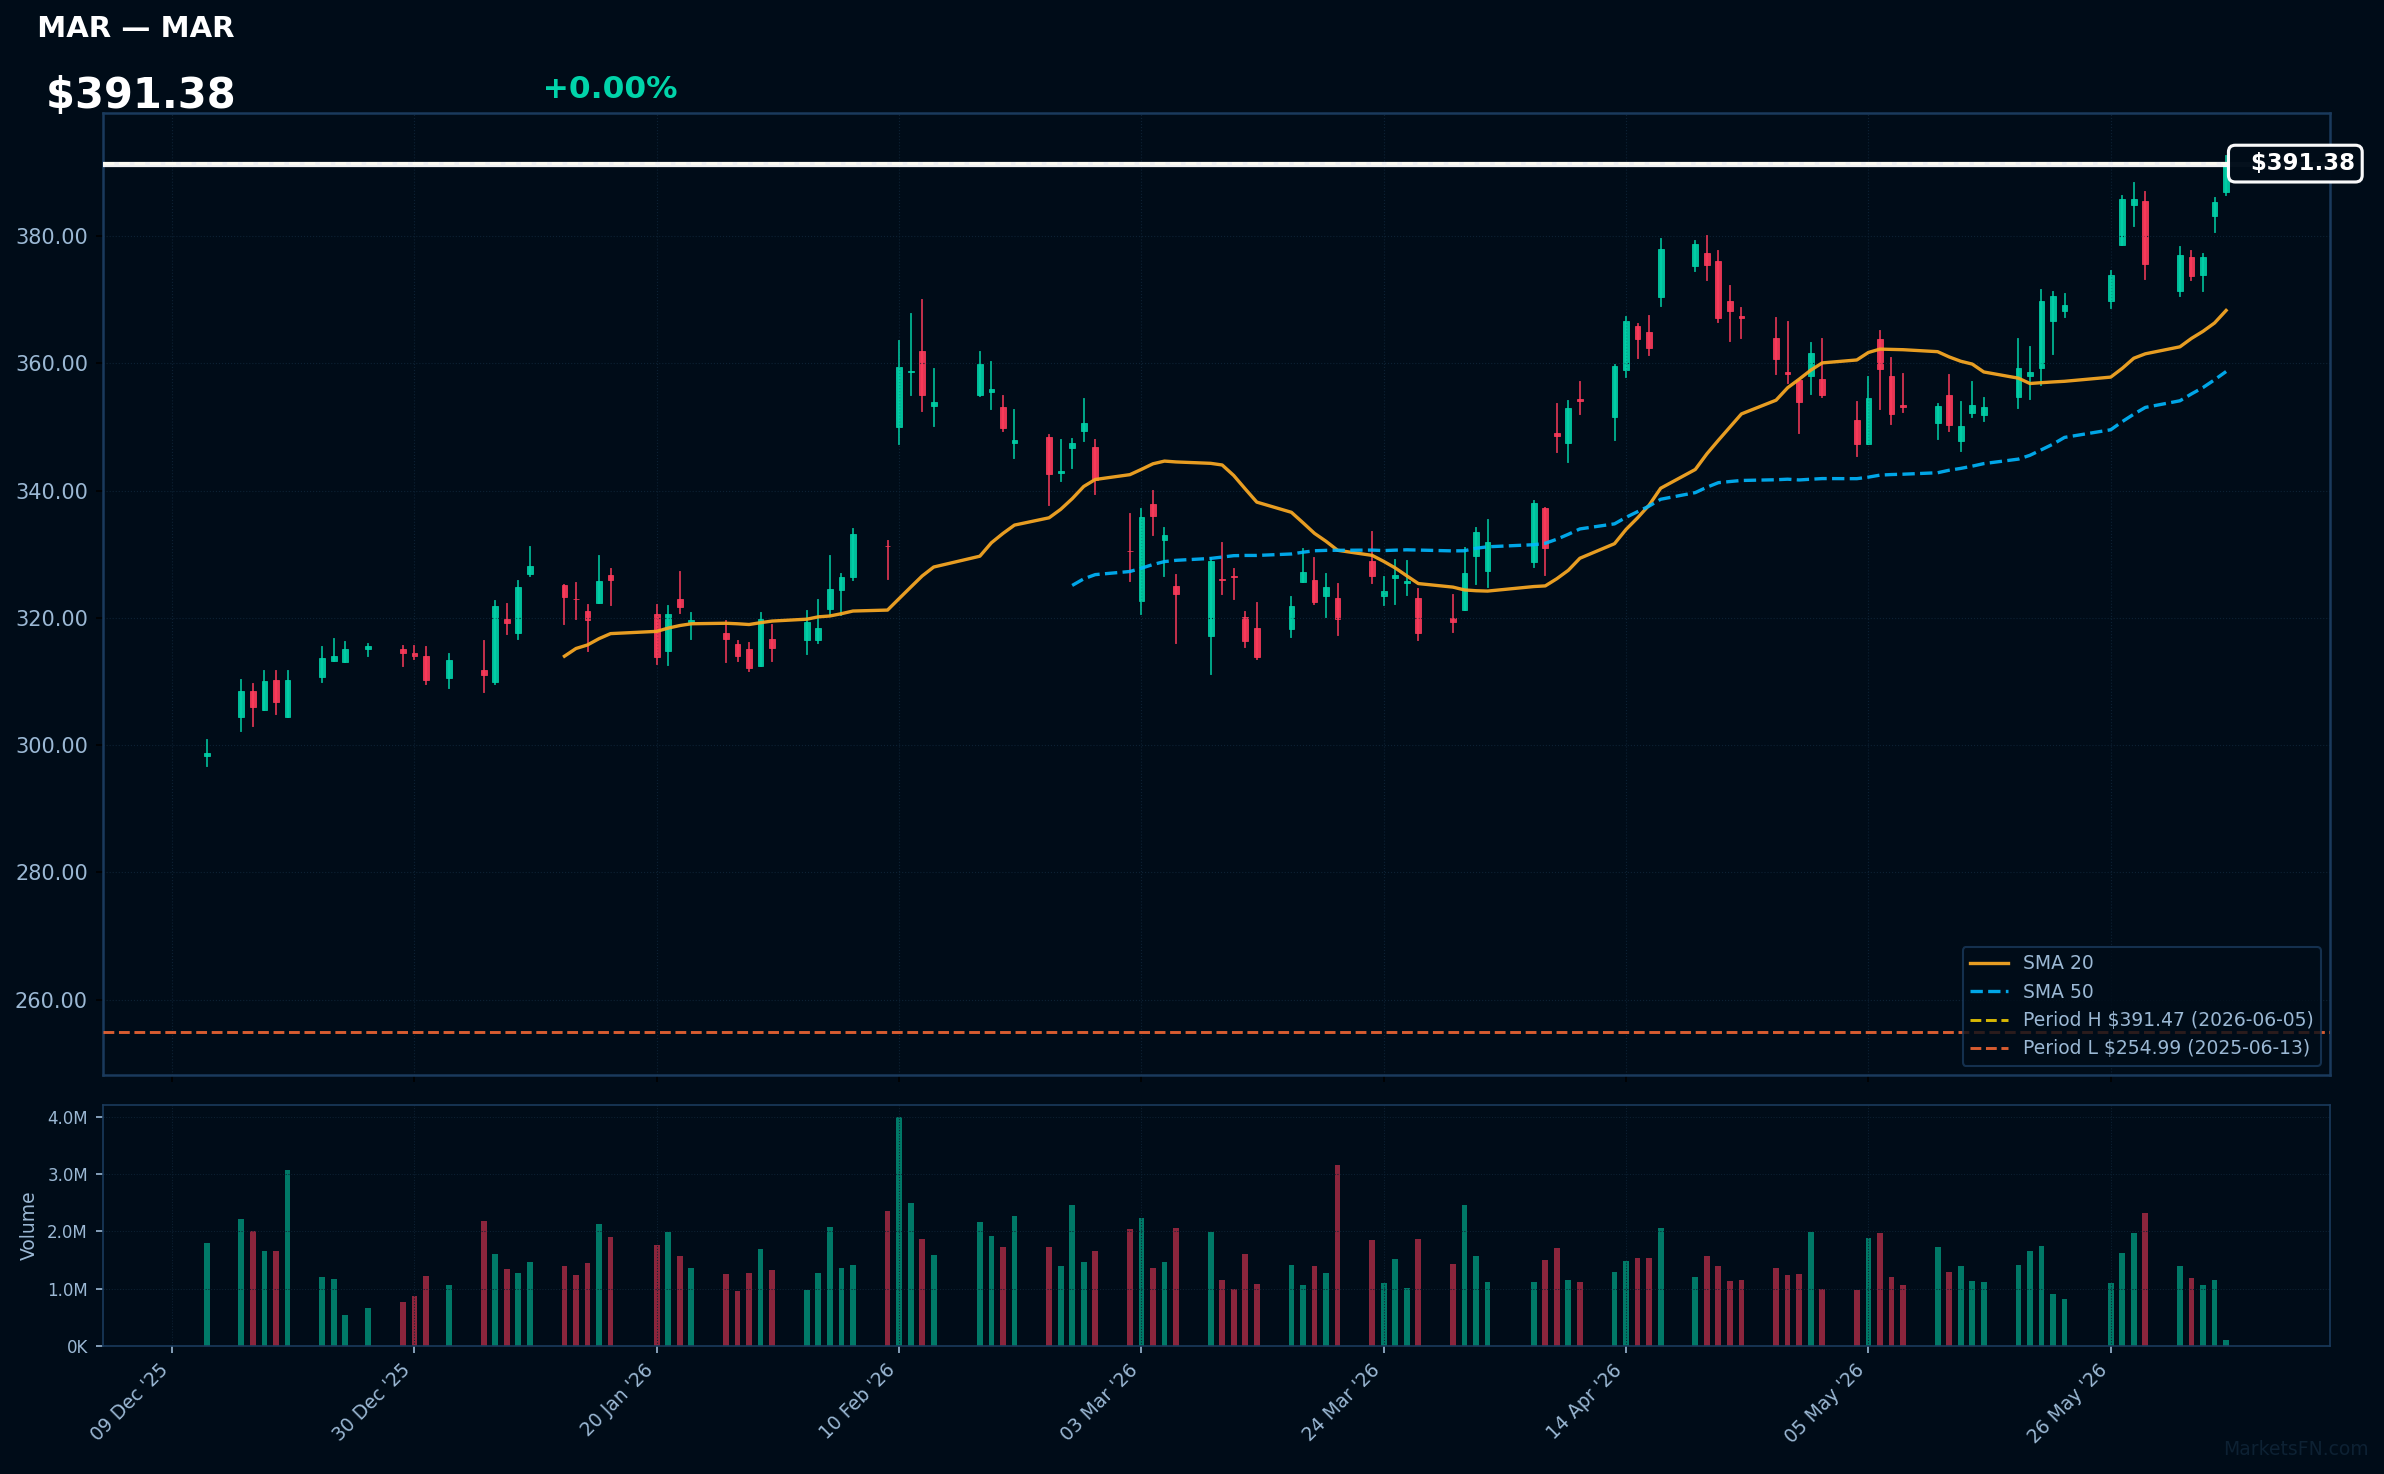
MAR | Marriott International, Inc | Consumer Cyclical | Price Last: $391.47 | % Realized: +50.68% | RSI: 68.6 | % above MA200: +24.9% | Trend: Above MA20, MA50, MA200
Marriott International, Inc (MAR) operates a global network of hotels and resorts, generating revenue through room bookings, food and beverage sales, and loyalty programs, making it a significant player in the hospitality industry.
MAR's technicals indicate sustained uptrend with price at $391.38, RSI(14) at 68.6, and MA alignment: price > MA20 > MA50 > MA200; it's 0.0% below its 52-Week high, suggesting potential breakout momentum.
Related headlines
- Earn up to 125,000 Marriott Bonvoy points with this limited-time offer
- Marriott, Stock Of The Day, Near Buy Zone As 2026 FIFA World Cup Looms
- Marriott International and The Fern Hotels & Resorts Celebrate 75 Signings and 50 Openings for Series by Marriott in India
- New Hilton and Marriott credit card offers earn up to 175,000 points
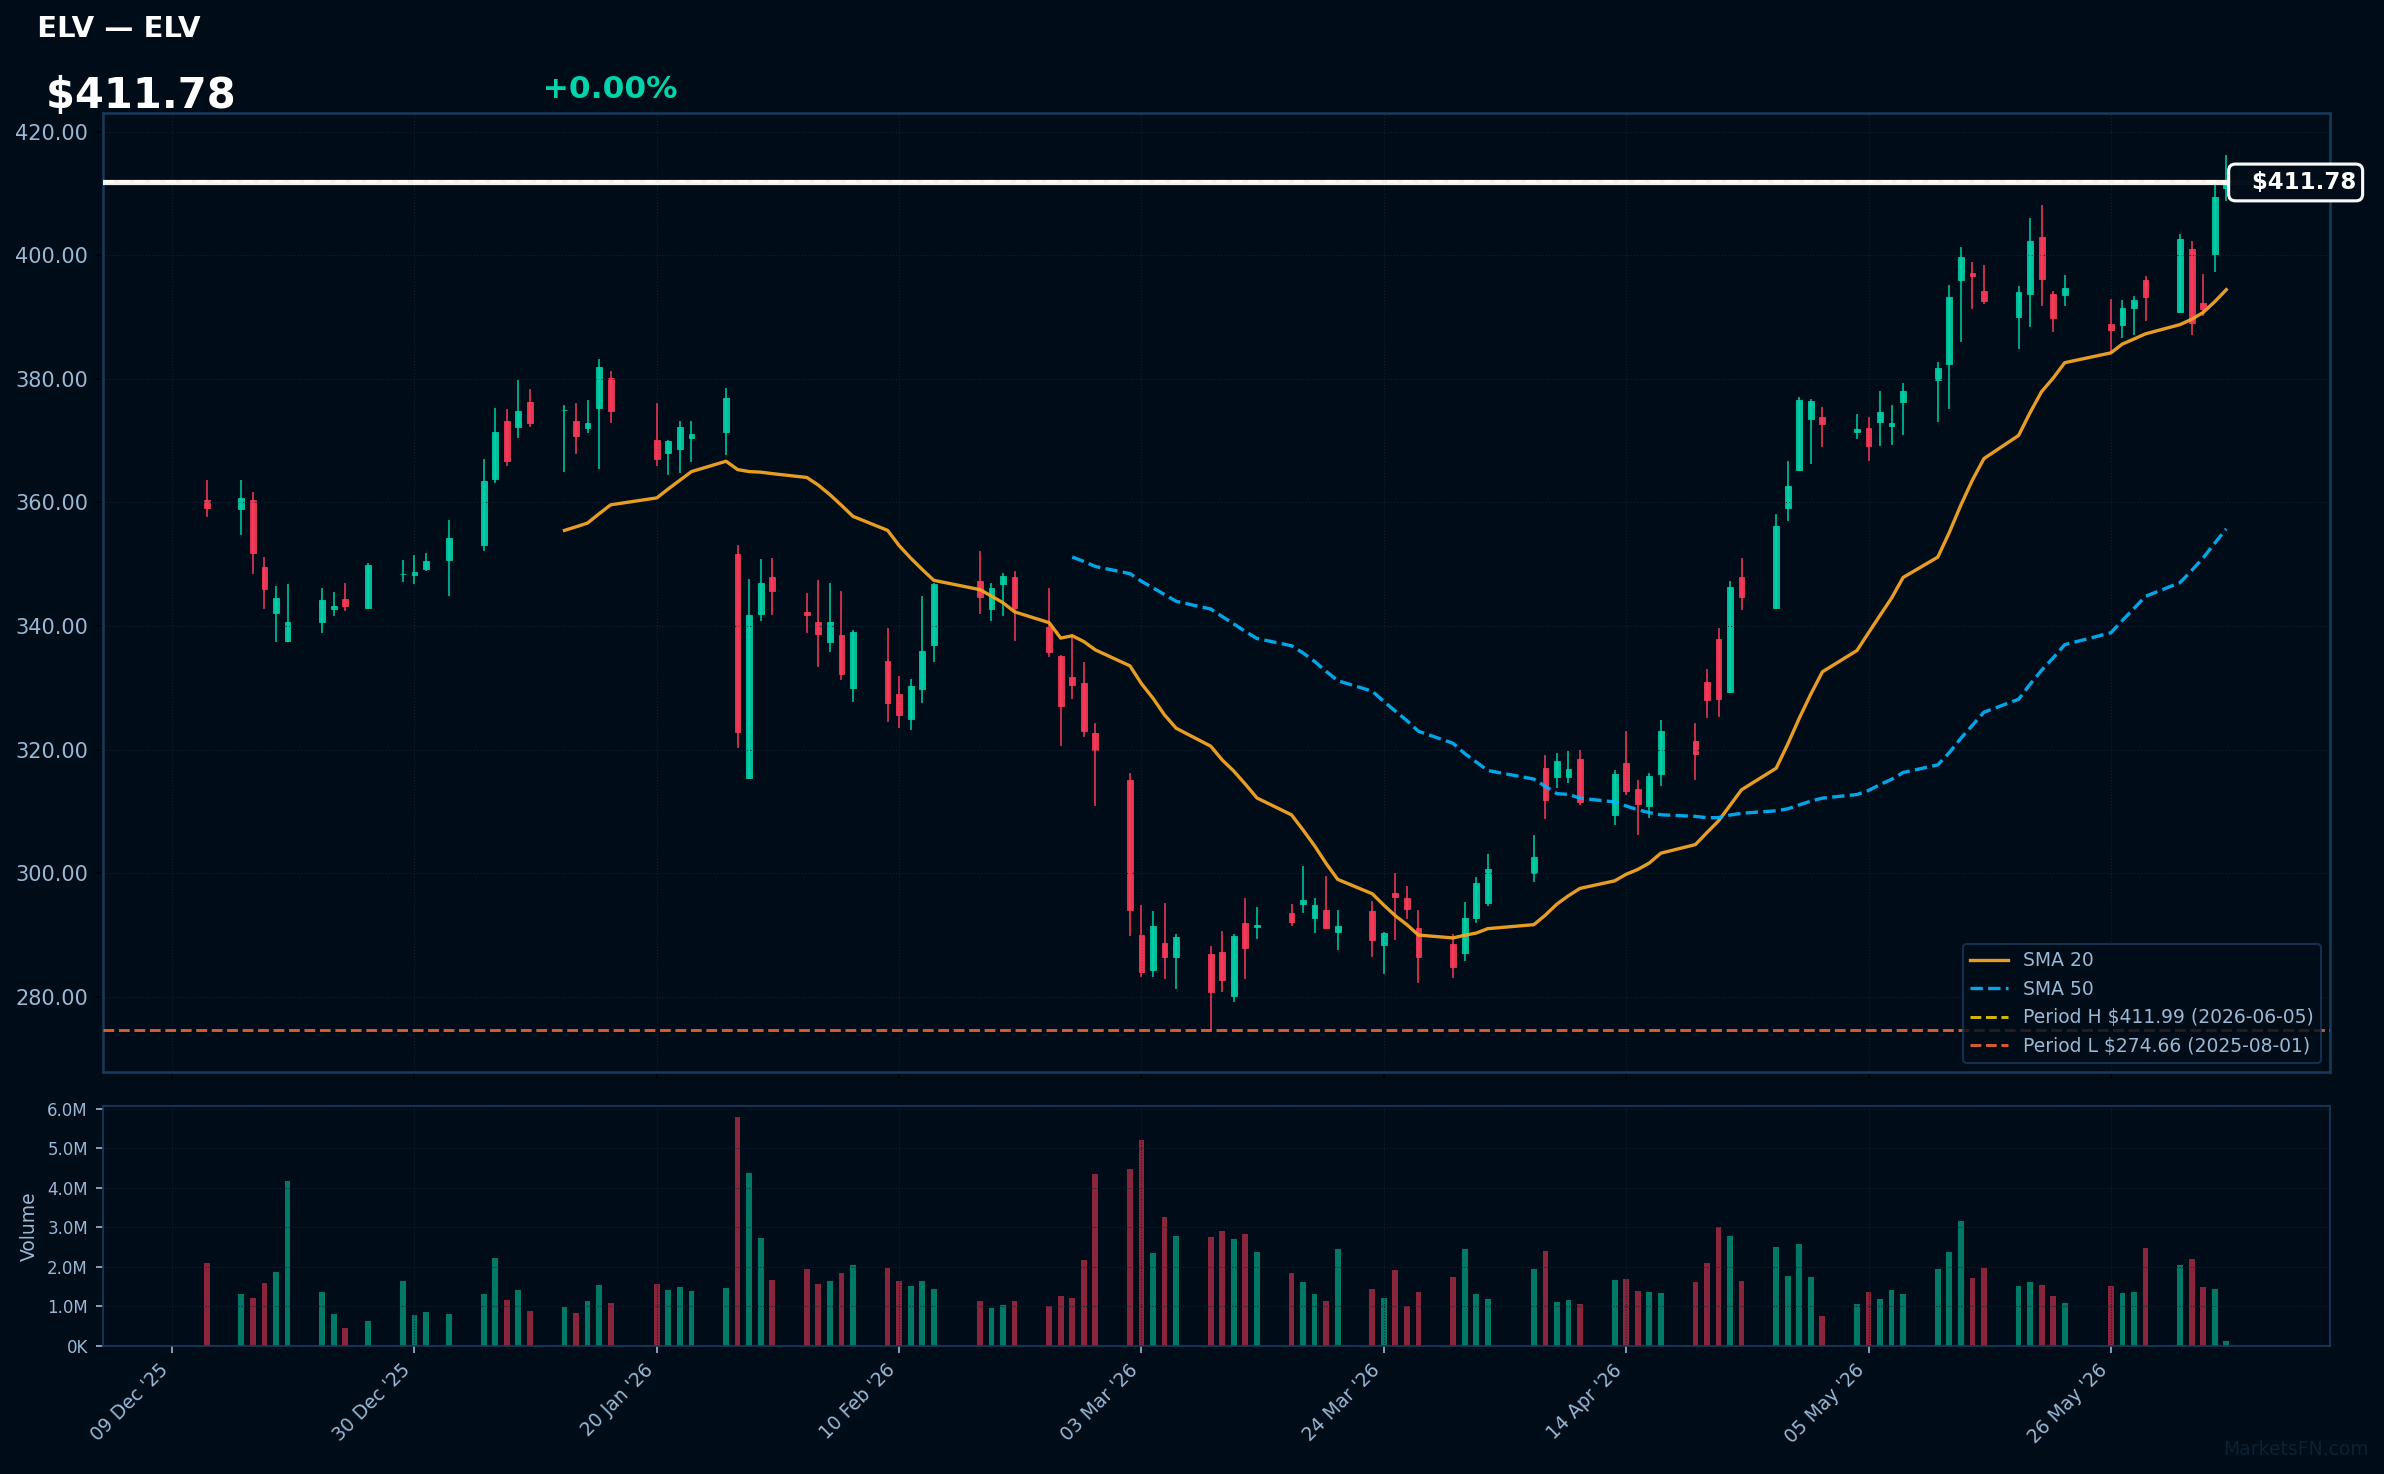
ELV | Elevance Health Inc | Healthcare | Price Last: $411.99 | % Realized: +7.11% | RSI: 67.8 | % above MA200: +22.2% | Trend: Above MA20, MA50, MA200
Elevance Health Inc is a health insurance provider offering medical, dental, and vision plans. Investors should care because its performance reflects healthcare industry trends and regulatory changes, impacting its stock.
Elevance Health Inc shows bullish technicals with RSI(14) at 67.8, price above MA20, MA50, and MA200, and is 0.0% below its 52-Week high, indicating sustained uptrend and potential breakout momentum.
Related headlines
- Elevance again avoids Medicare Advantage sanctions, but threat remains
- Elevance Health Advances Efforts to Close Critical Gaps in Mental Health Care
- Elevance Healths Affiliated Health Plans Deliver More Predictable, Lower Healthcare Costs for Small Businesses
- Elevance Health and 2 More Stocks to Buy. Better Days Are Ahead for Medicaid Providers.
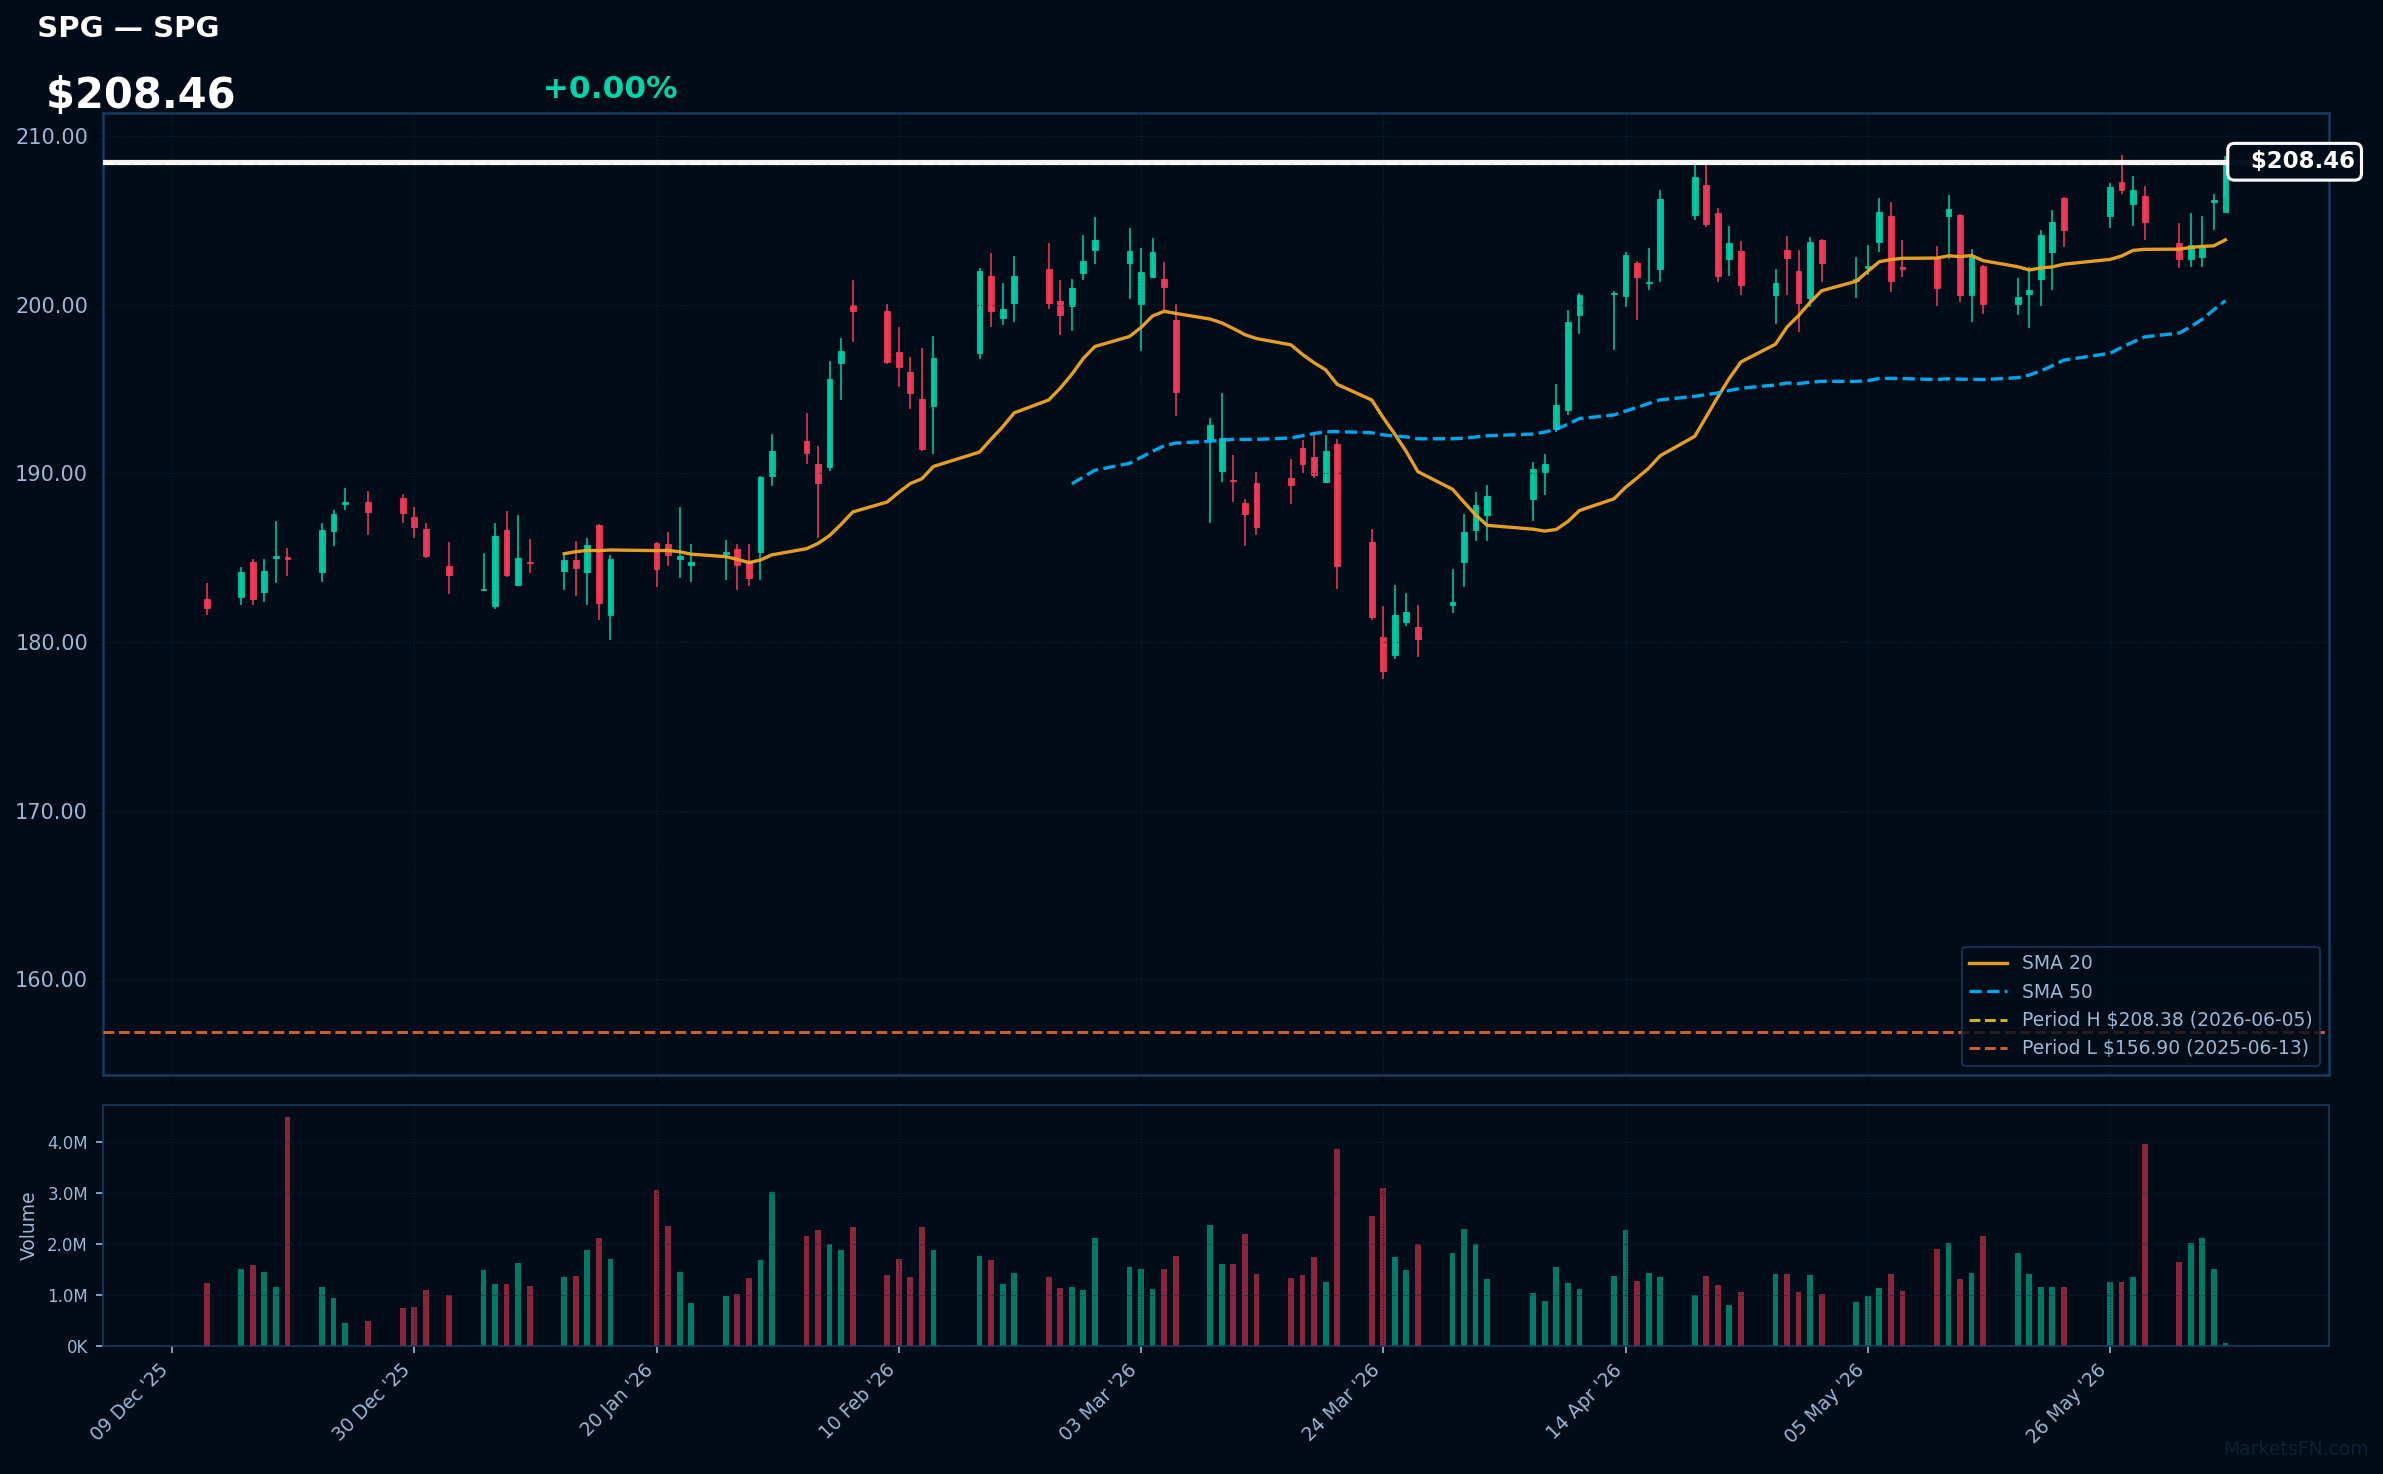
SPG | Simon Property Group, Inc | Real Estate | Price Last: $208.38 | % Realized: +29.63% | RSI: 61.3 | % above MA200: +10.3% | Trend: Above MA20, MA50, MA200
Simon Property Group, Inc (SPG) is a real estate investment trust that owns and operates shopping malls and premium outlets. Investors should care because its performance reflects consumer spending trends and retail market health.
SPG's technicals indicate sustained uptrend with price at $208.46, RSI(14) at 61.3, and bullish MA alignment (price > MA20 > MA50 > MA200). It's near a breakout level, 0.0% below its 52-Week high, after a 29.6% 52-Week return, signaling strong momentum.
Related headlines
- Simon is Teaming up with adidas to Offer Fan Experiences for a Summer of Global Soccer
- Simon Property Group Inc (SPG) Q1 2026 Earnings Call Highlights: Strong Occupancy and FFO ...
- Simon Reports First Quarter 2026 Results, Increases Full Year 2026 Real Estate FFO Per Share Guidance and Raises Quarterly Dividend
- Simon Property Stock Rallies 34.3% in a Year: Will the Trend Last?
📉 Nearest to 52-Week Low
Sectors represented: Technology (3), Consumer Cyclical (1), Financial (1)
| Ticker | Company | Sector | Price Last | % Realized | 52-Week Low Date | RSI | % above MA200 | Trend |
|---|---|---|---|---|---|---|---|---|
| INTU | Intuit Inc | Technology | $298.31 | -61.09% | 2026-06-05 | 35.5 | -44.8% | Below MA20, MA50, MA200 |
| LULU | Lululemon Athletica inc | Consumer Cyclical | $114.69 | -65.33% | 2026-06-05 | 28.0 | -33.0% | Below MA20, MA50, MA200 |
| JKHY | Jack Henry & Associates, Inc | Technology | $130.30 | -28.02% | 2026-06-05 | 30.1 | -19.7% | Below MA20, MA50, MA200 |
| MKTX | MarketAxess Holdings Inc | Financial | $119.20 | -47.29% | 2026-06-05 | 17.2 | -29.7% | Below MA20, MA50, MA200 |
| FIS | Fidelity National Information Services, Inc | Technology | $40.95 | -49.16% | 2026-06-03 | 37.7 | -28.9% | Below MA20, MA50, MA200 |
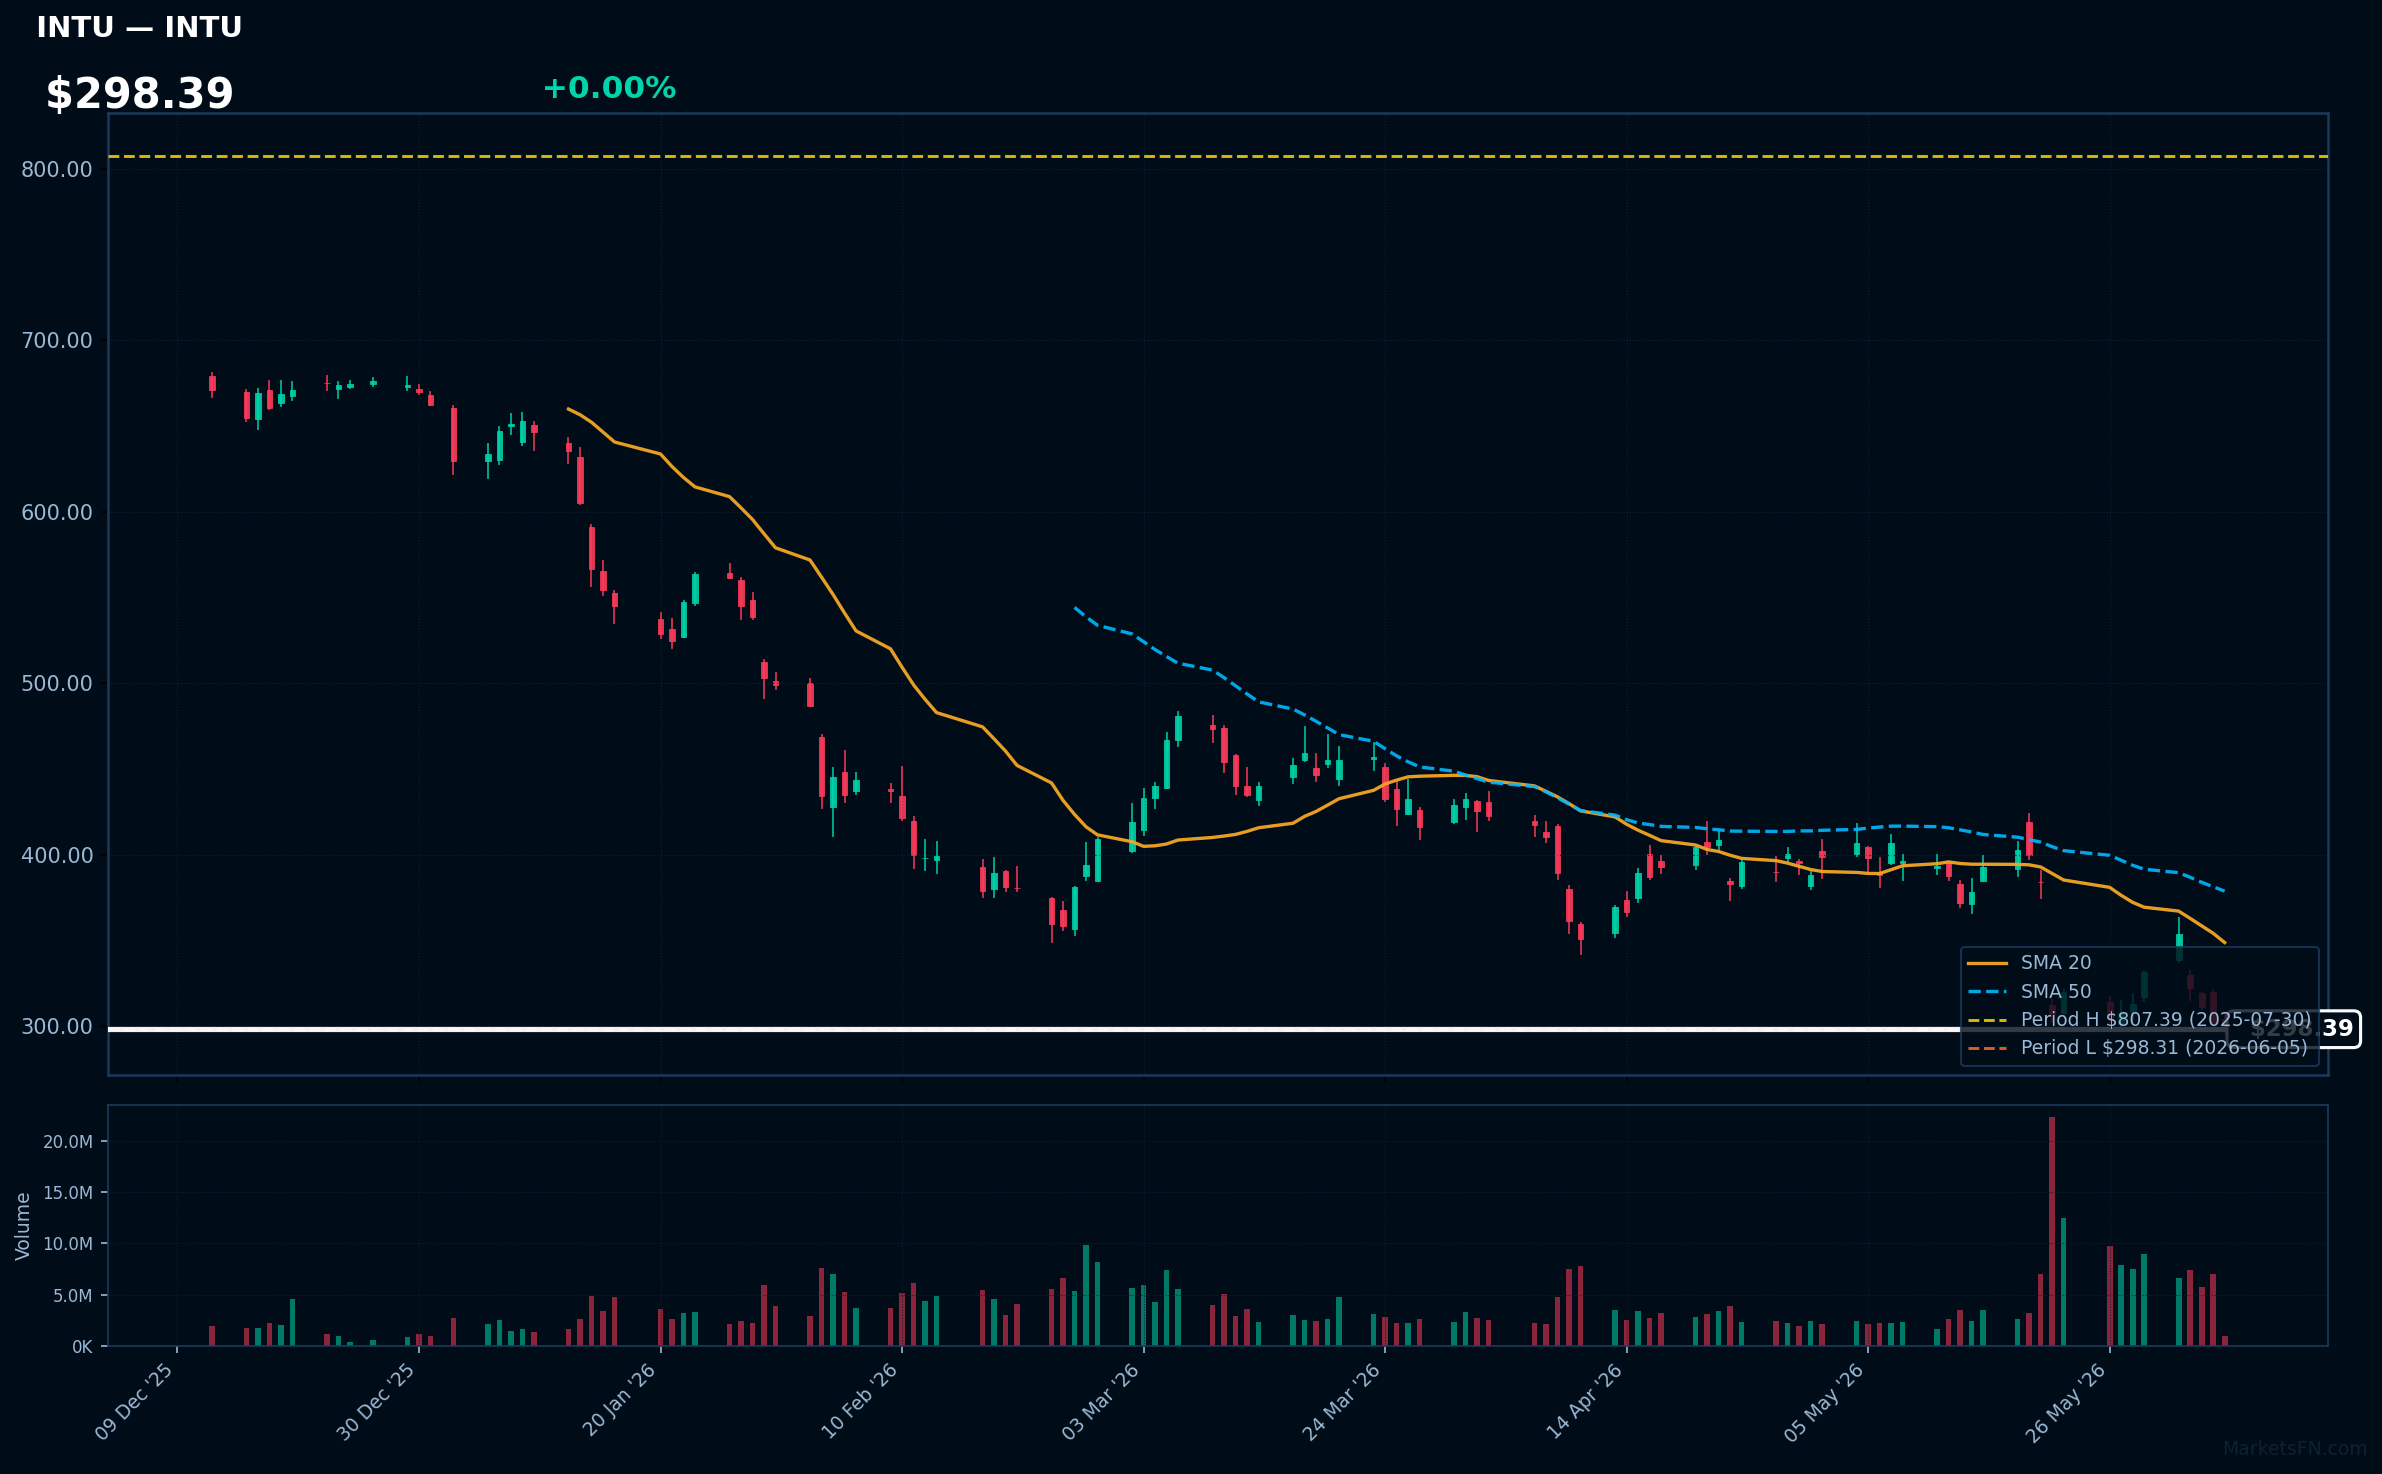
INTU | Intuit Inc | Technology | Price Last: $298.31 | % Realized: -61.09% | RSI: 35.5 | % above MA200: -44.8% | Trend: Below MA20, MA50, MA200
Intuit Inc (INTU) provides financial management solutions, including QuickBooks for small businesses and TurboTax for individual tax preparation, making it a key player in the financial software space with significant exposure to the US tax and accounting markets.
INTU's technicals indicate a sustained downtrend with price ($298.39) below all key MAs (MA20, MA50, MA200) and an RSI(14) of 35.5, nearing oversold territory, with the stock testing its 52-Week low, a potential warning sign for further downside.
Related headlines
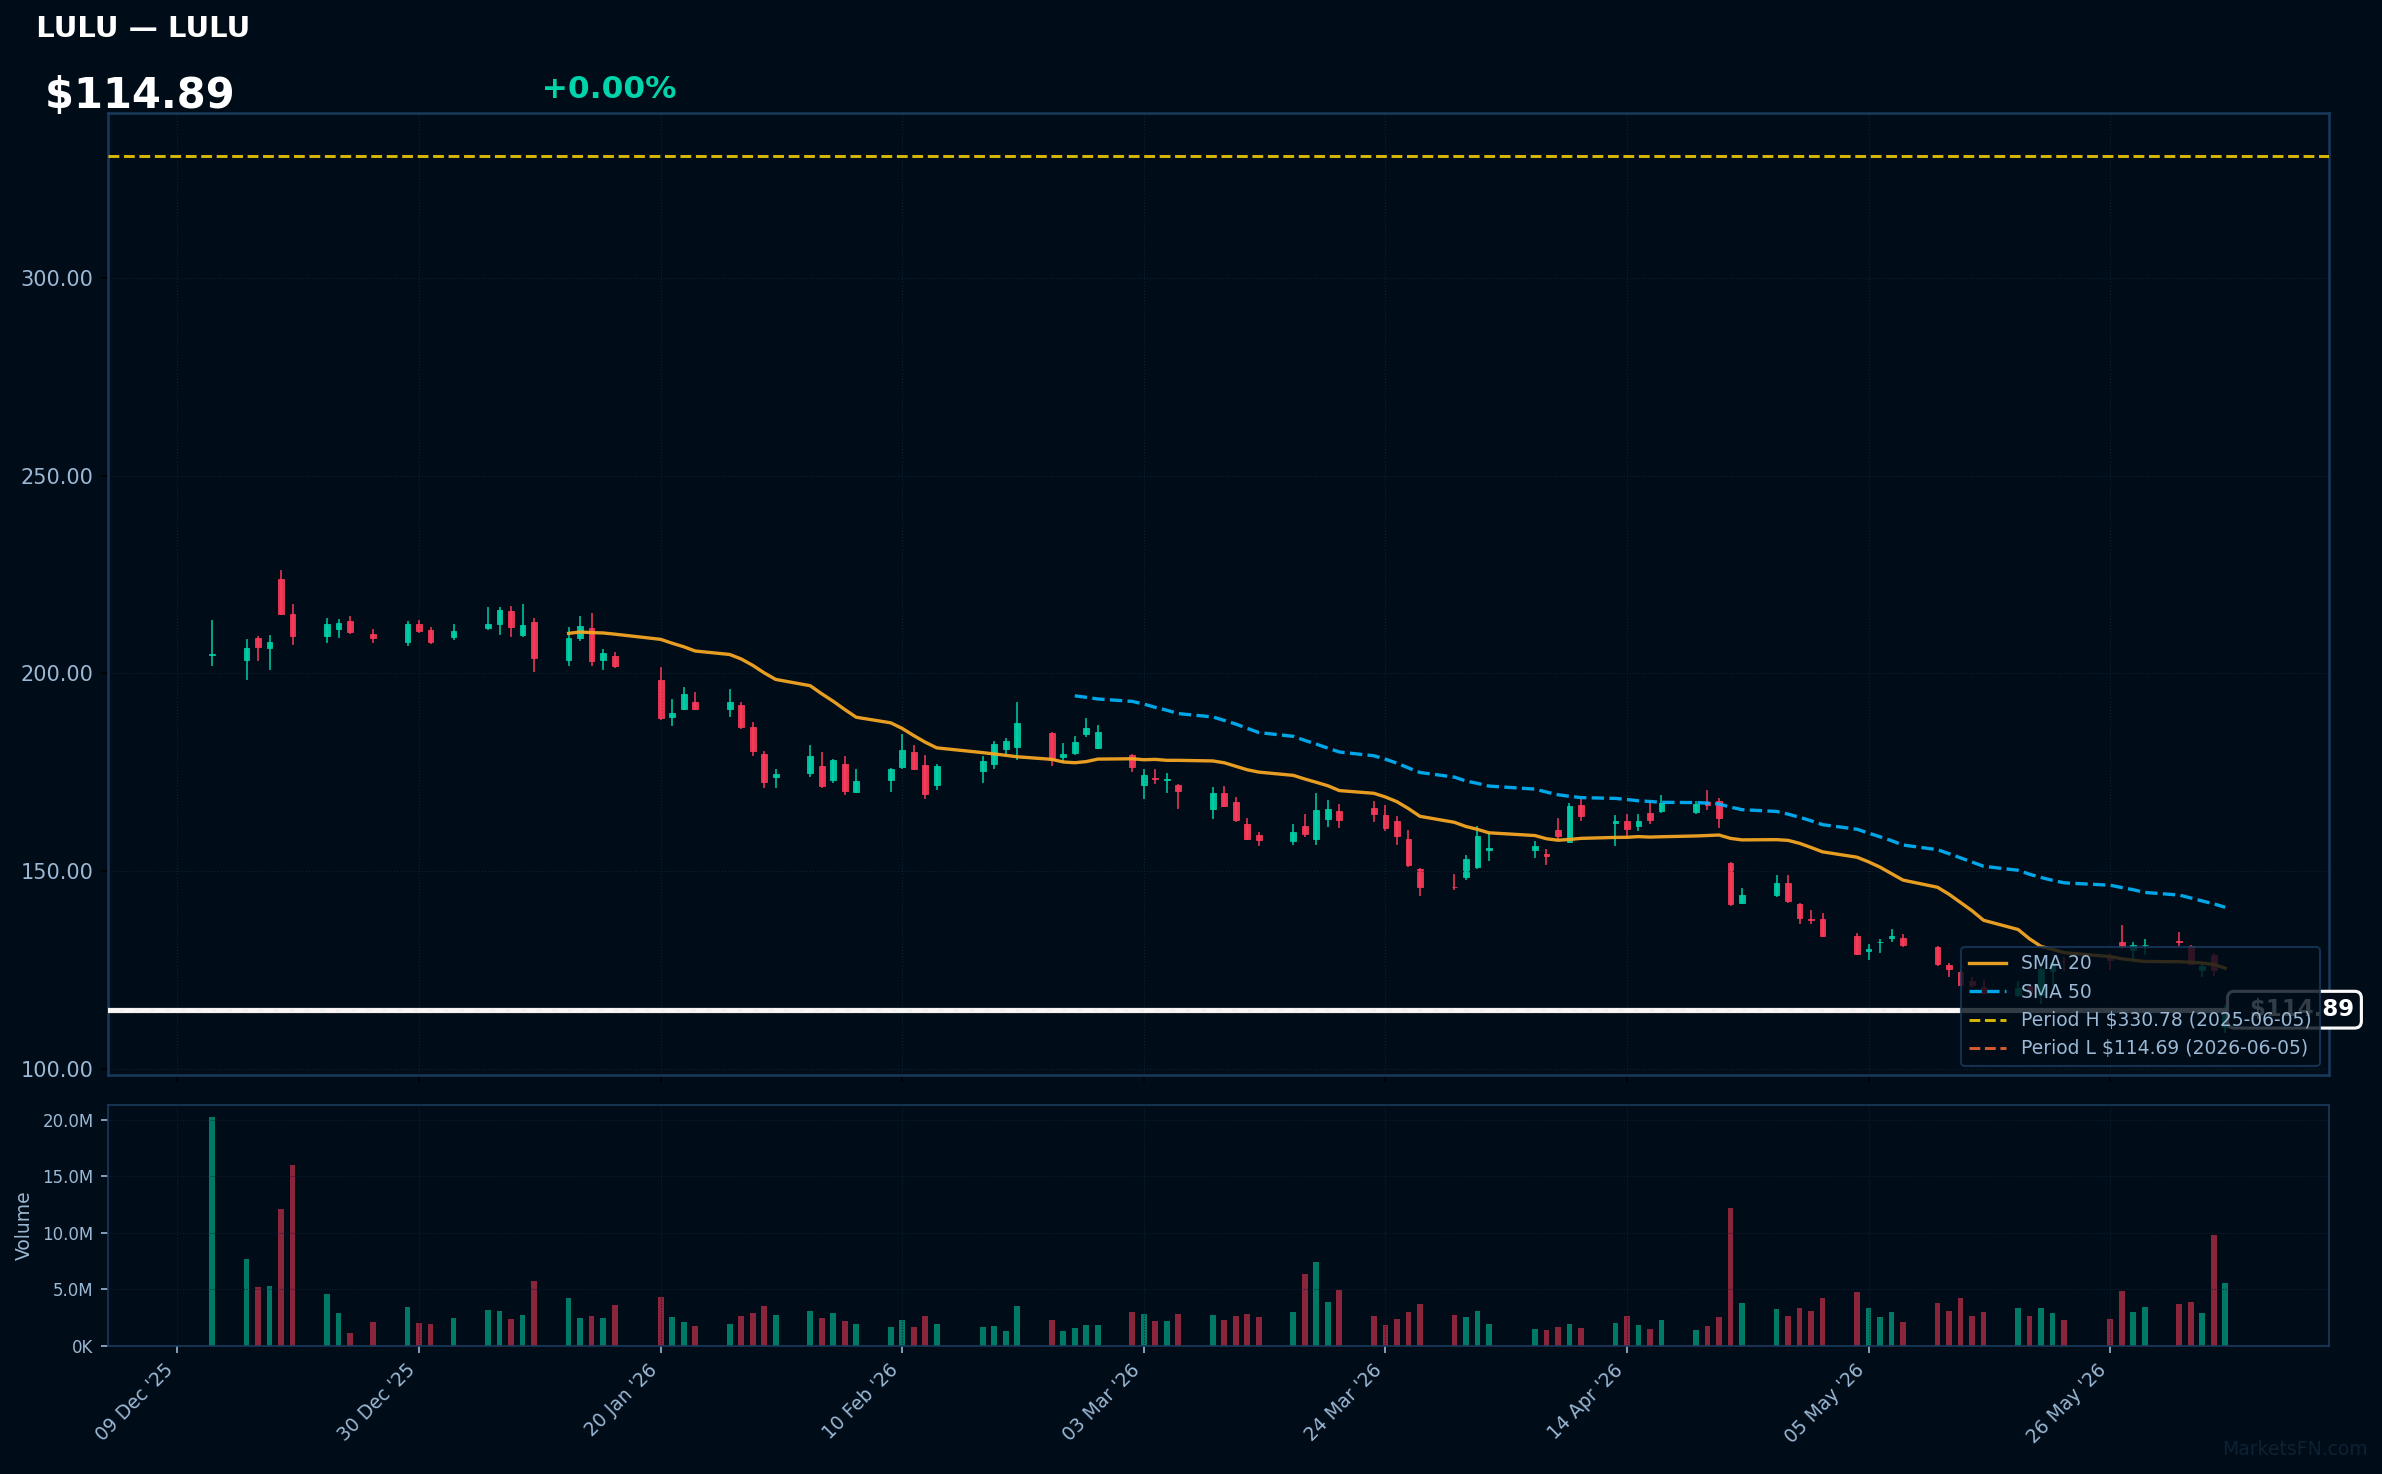
LULU | Lululemon Athletica inc | Consumer Cyclical | Price Last: $114.69 | % Realized: -65.33% | RSI: 28.0 | % above MA200: -33.0% | Trend: Below MA20, MA50, MA200
Lululemon Athletica inc designs and sells yoga and athletic wear. Investors care about its brand strength, product innovation, and market expansion, which drive sales growth and profitability.
Lululemon's technical situation is bearish, with RSI(14) at 28.0, indicating oversold conditions, and a sustained downtrend as price ($114.89) remains below MA20, MA50, and MA200, with the stock testing major support at its 52-Week low.
Related headlines
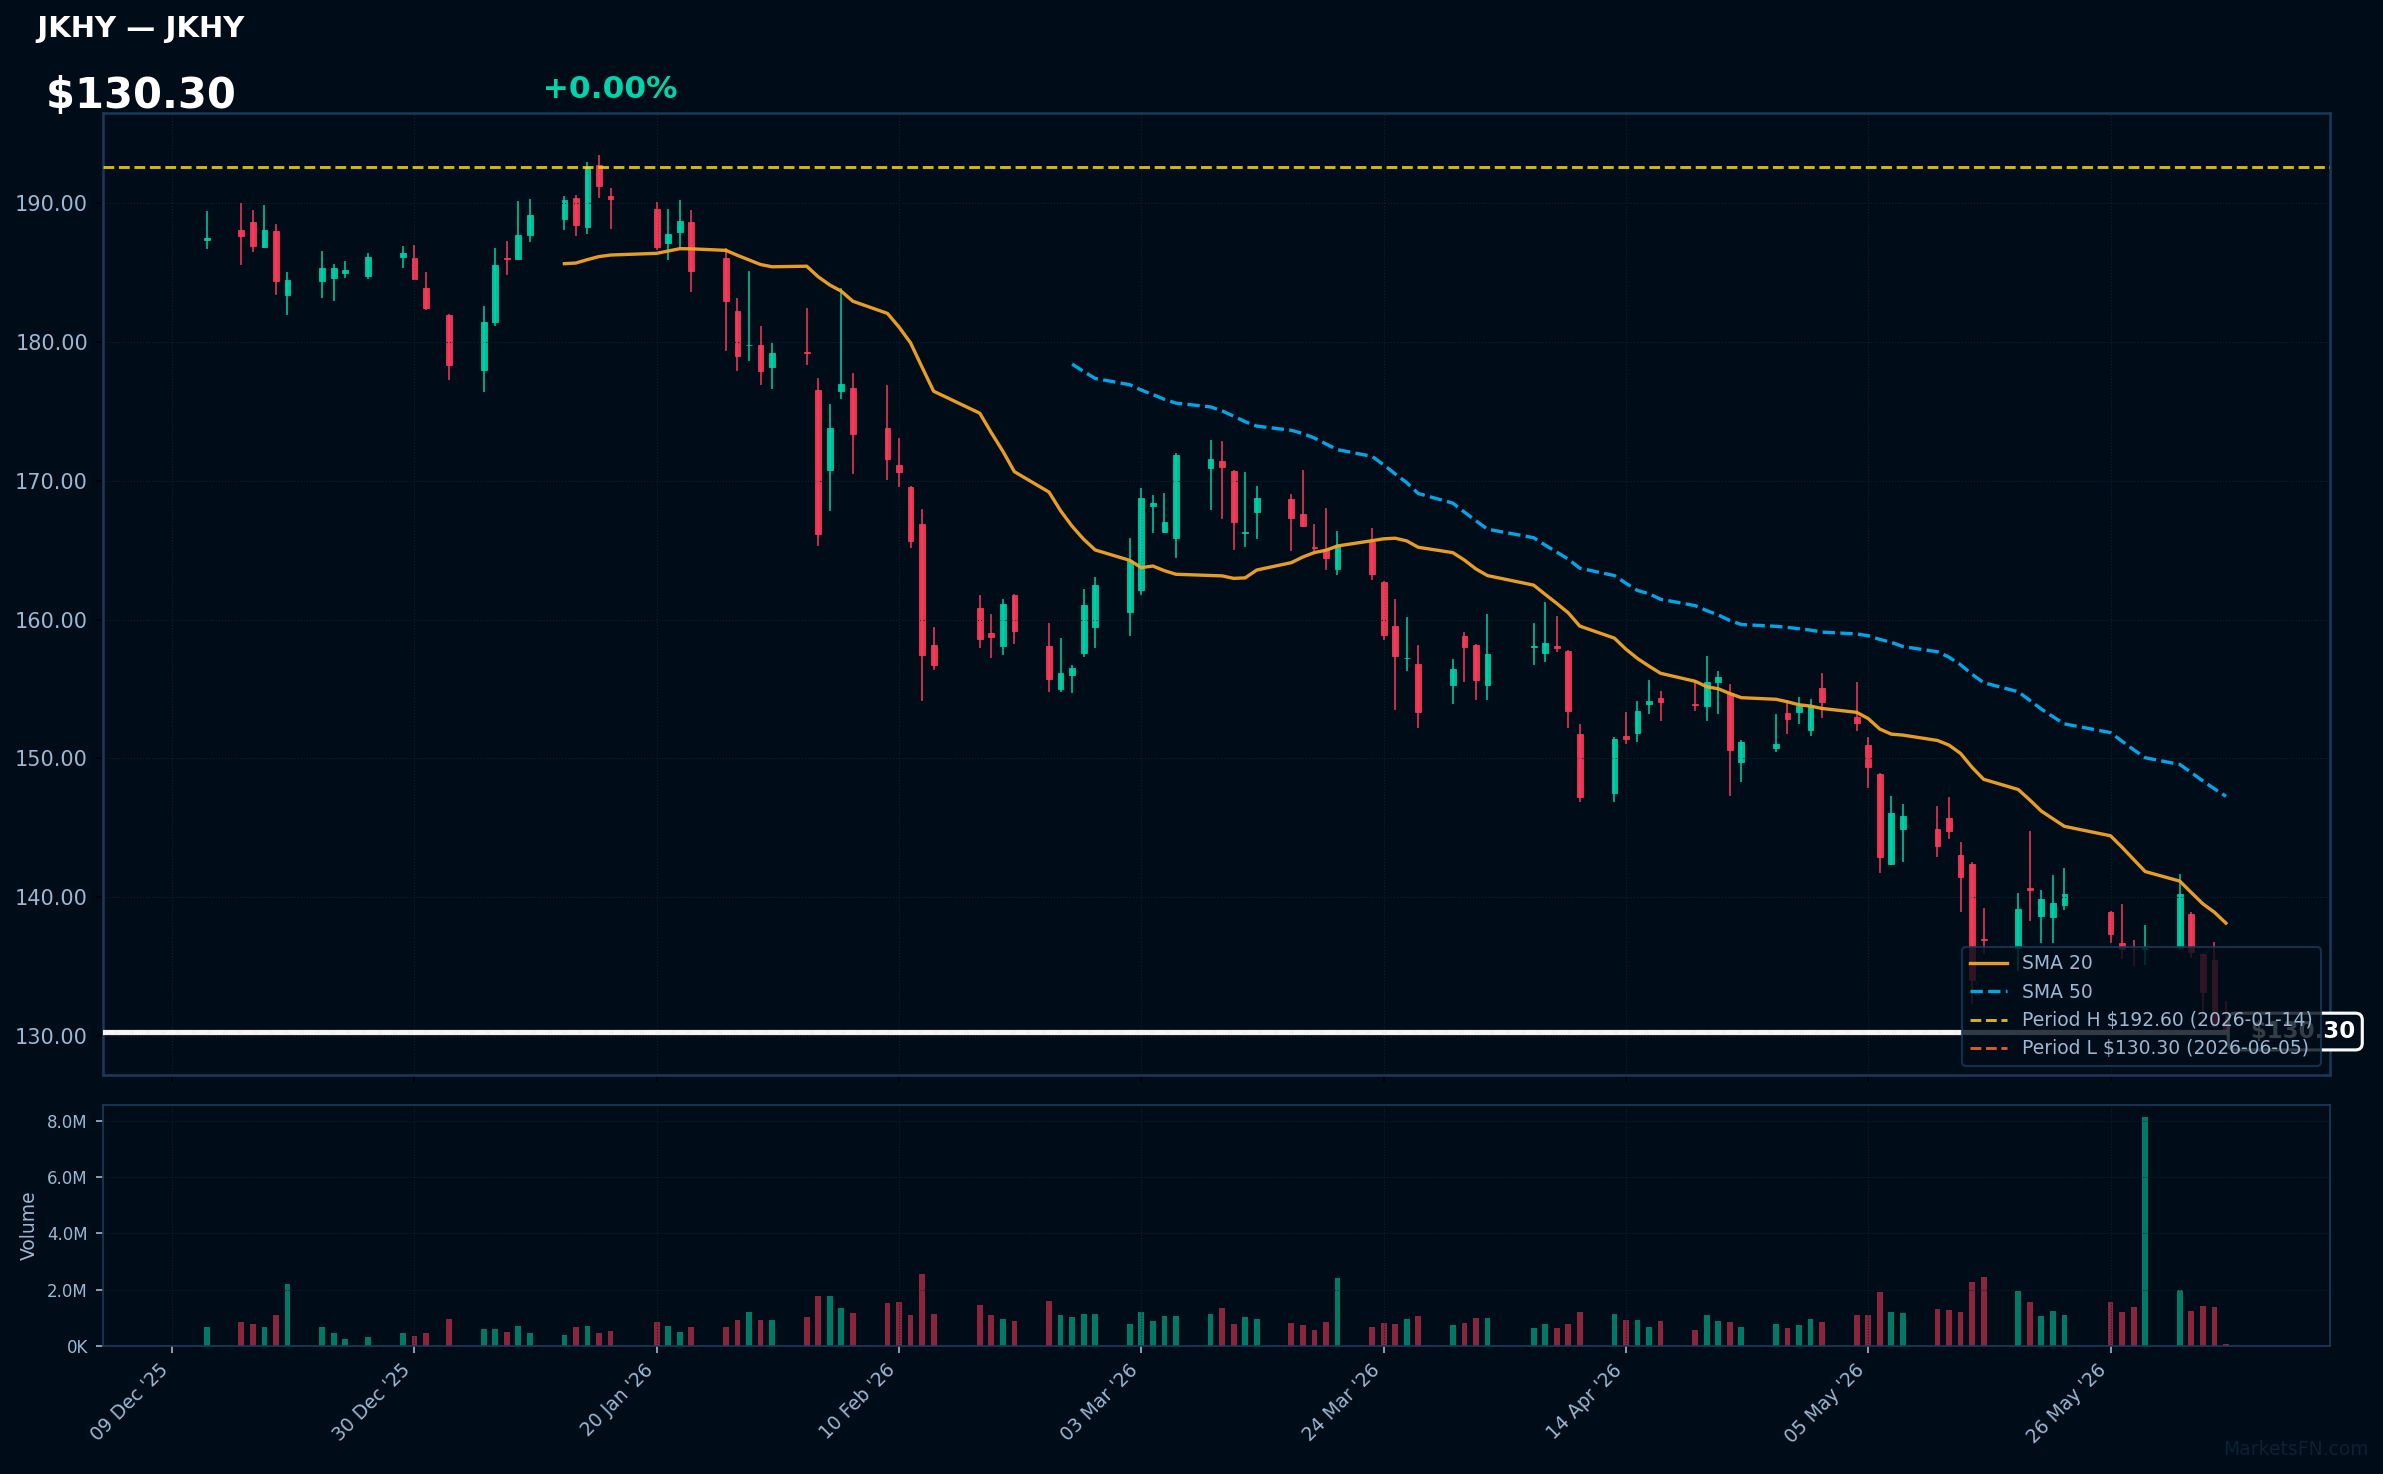
JKHY | Jack Henry & Associates, Inc | Technology | Price Last: $130.30 | % Realized: -28.02% | RSI: 30.1 | % above MA200: -19.7% | Trend: Below MA20, MA50, MA200
Jack Henry & Associates, Inc provides integrated payment processing, banking, and retail technology solutions to financial institutions and retailers. Investors should care because its solutions enable critical financial transactions and its performance may reflect the overall health of the financial services sector.
The stock is in a sustained downtrend with price ($130.30) below MA20, MA50, and MA200. RSI(14) is 30.1, near oversold territory, and the stock is 0.0% above its 52-Week low, indicating a potential support test, warning of further downside risk.
Related headlines
- Jack Henry & Associates Announces Retirement of David Foss as Board Chair
- Jack Henry Leaders to Present at Upcoming Investor Conferences
- Woodforest National Bank Selects Jack Henry to Power Growth with a Modern, Integrated Platform
- Jack Henry Named Among 2026 Best Places to Work in Financial Technology
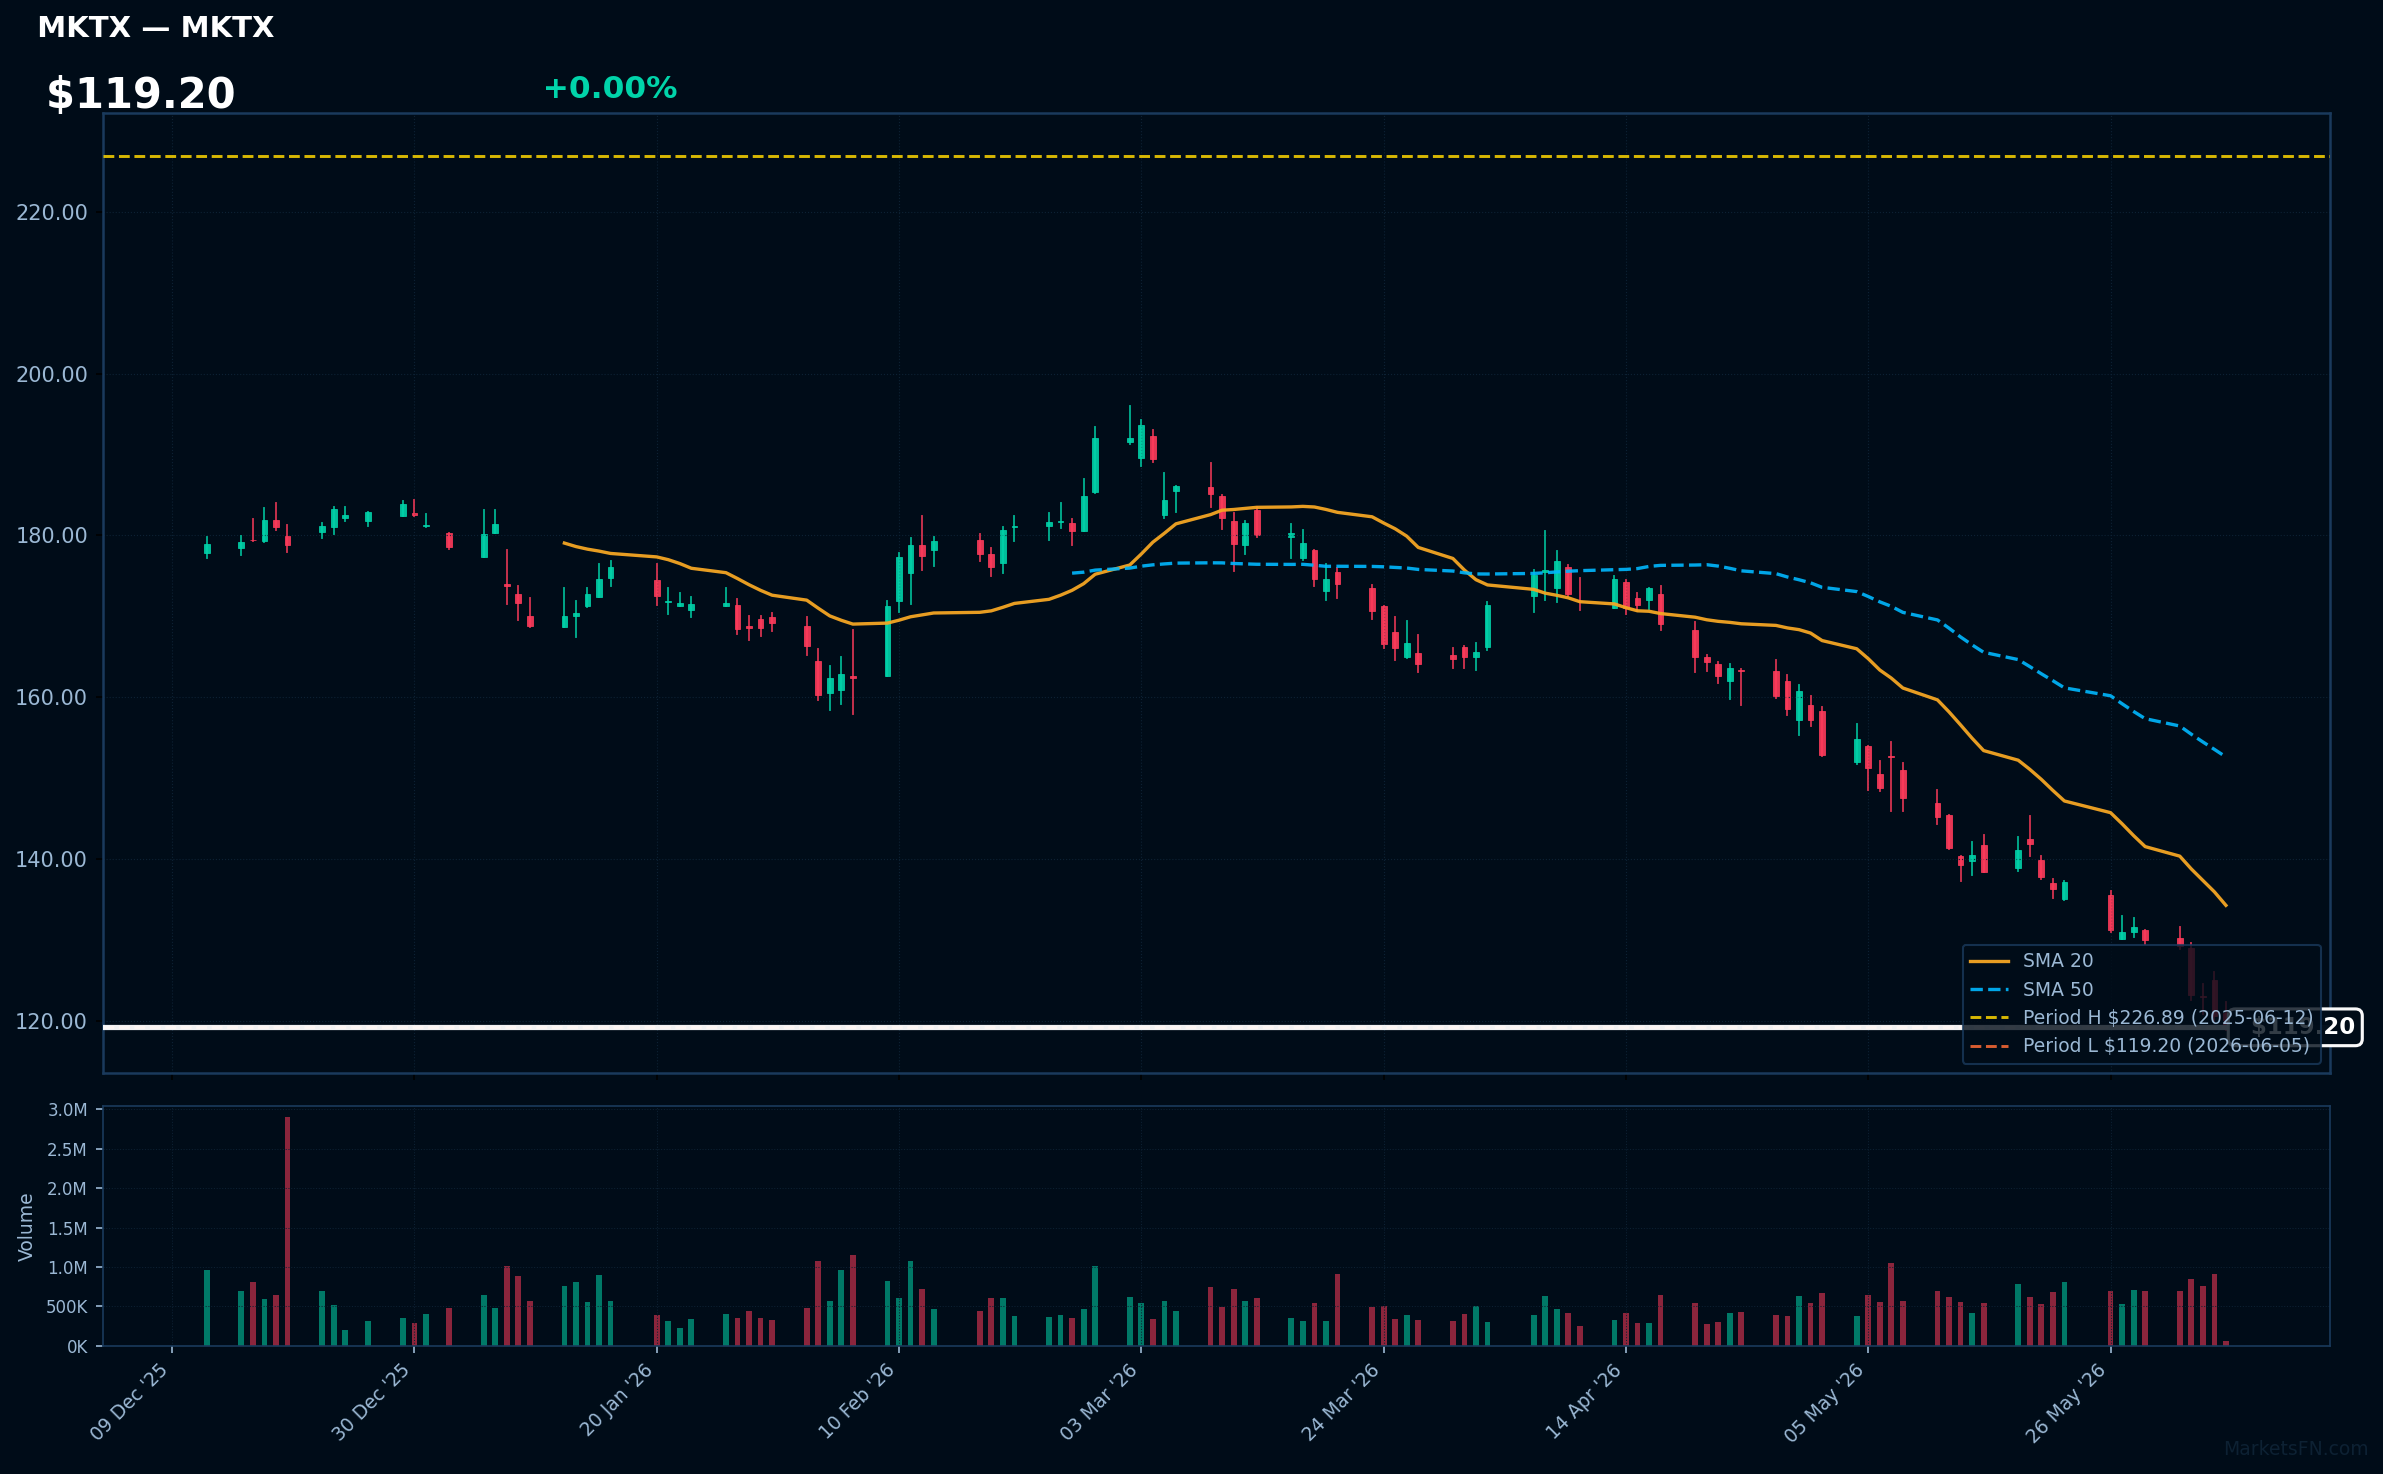
MKTX | MarketAxess Holdings Inc | Financial | Price Last: $119.20 | % Realized: -47.29% | RSI: 17.2 | % above MA200: -29.7% | Trend: Below MA20, MA50, MA200
MarketAxess Holdings Inc operates an electronic trading platform for fixed-income securities, providing a crucial service to institutional investors and broker-dealers. Investors care about its performance as it reflects the state of the bond market and the company's competitive position.
The stock is in a sustained downtrend with price ($119.20) below MA20, MA50, and MA200. The RSI(14) is 17.2, nearing oversold territory, and the stock is 0.0% above its 52-Week low, indicating a potential support test.
Related headlines
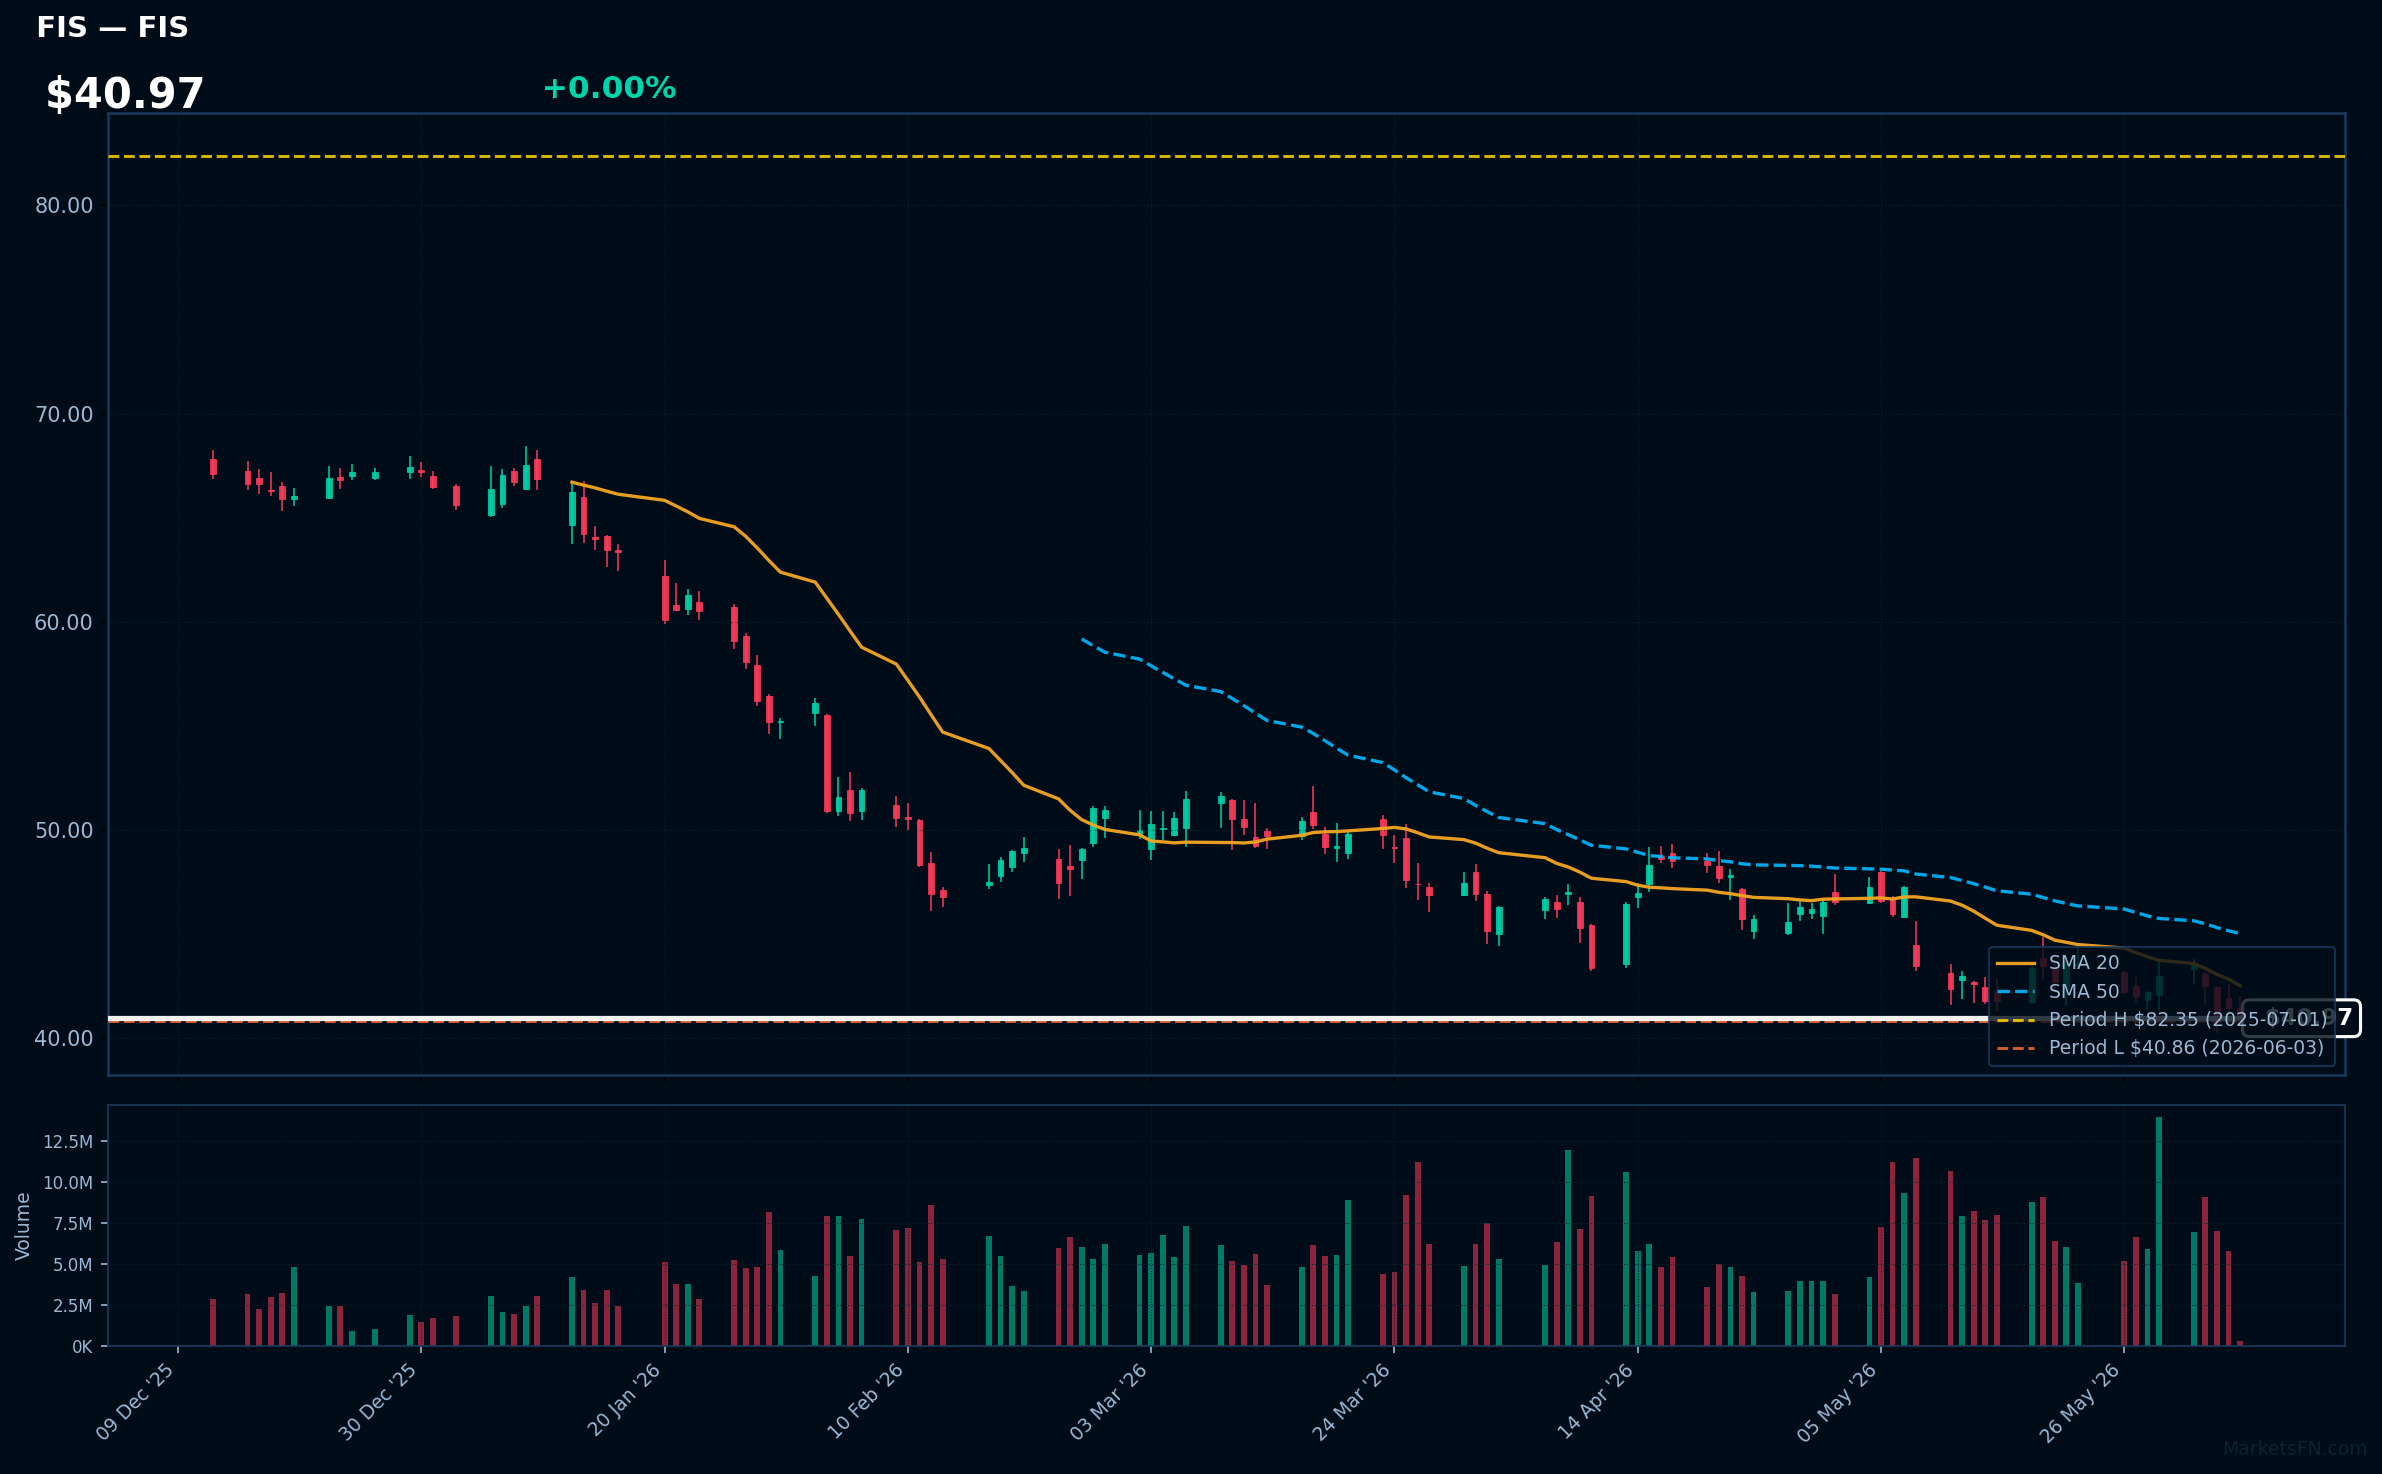
FIS | Fidelity National Information Services, Inc | Technology | Price Last: $40.95 | % Realized: -49.16% | RSI: 37.7 | % above MA200: -28.9% | Trend: Below MA20, MA50, MA200
Fidelity National Information Services, Inc (FIS) is a global provider of financial services technology, offering solutions for payment processing, banking, and capital markets. Investors should care as FIS's technology underpins critical financial infrastructure, making its performance relevant to the broader financial sector.
FIS is in a sustained downtrend with a bearish MA alignment: price ($40.97) < MA20 < MA50 < MA200. The RSI(14) is 37.7, nearing oversold territory, and the stock is 0.2% above its 52-Week low, indicating a potential support test.
Related headlines
Market Commentary
The S&P 500 stocks listed near 52-week extremes indicate a significant price movement, with some stocks reaching new highs and others hitting new lows. The stocks at 52-week highs, including LLY, BK, MAR, ELV, and SPG, suggest strong performance in their respective sectors. Conversely, stocks near 52-week lows, such as INTU, LULU, JKHY, MKTX, and FIS, may be experiencing challenges or sector rotation.
The stocks at 52-week highs are from diverse sectors, including healthcare (LLY, ELV), finance (BK), hospitality (MAR), and real estate (SPG), indicating broad market strength. In contrast, the stocks near 52-week lows are primarily from the financial technology and consumer discretionary sectors. This divergence may be driven by sector rotation and macro themes, such as changes in interest rates or consumer spending habits.
Key levels to watch include the 52-week highs and lows for these stocks, as a break above or below these levels could signal further price movement. Potential catalysts include earnings reports, macroeconomic data releases, and industry trends. Investors should monitor these stocks and their respective sectors for potential opportunities or risks.
Methodology: All 503 S&P 500 constituents screened. 52-week high = highest daily close over the past 252 trading days (approx. 1 year). 52-week low = lowest daily close over the same period. Distance = (current price / extreme − 1) × 100. Technical indicators computed on up to 1 year of daily OHLCV data.
Disclaimer: For informational purposes only. Not investment advice. Past performance is not indicative of future results.