Shenzhen Component Surges 1.96% Amid AI Chip Demand and Economic Shifts
· Market News · MarketsFN Team
Shenzhen Component Surges 1.96% Amid AI Chip Demand and Economic Shifts
Note: This analysis covers the Asian trading session close for April 29, 2026. All times are in US Eastern Time (ET).
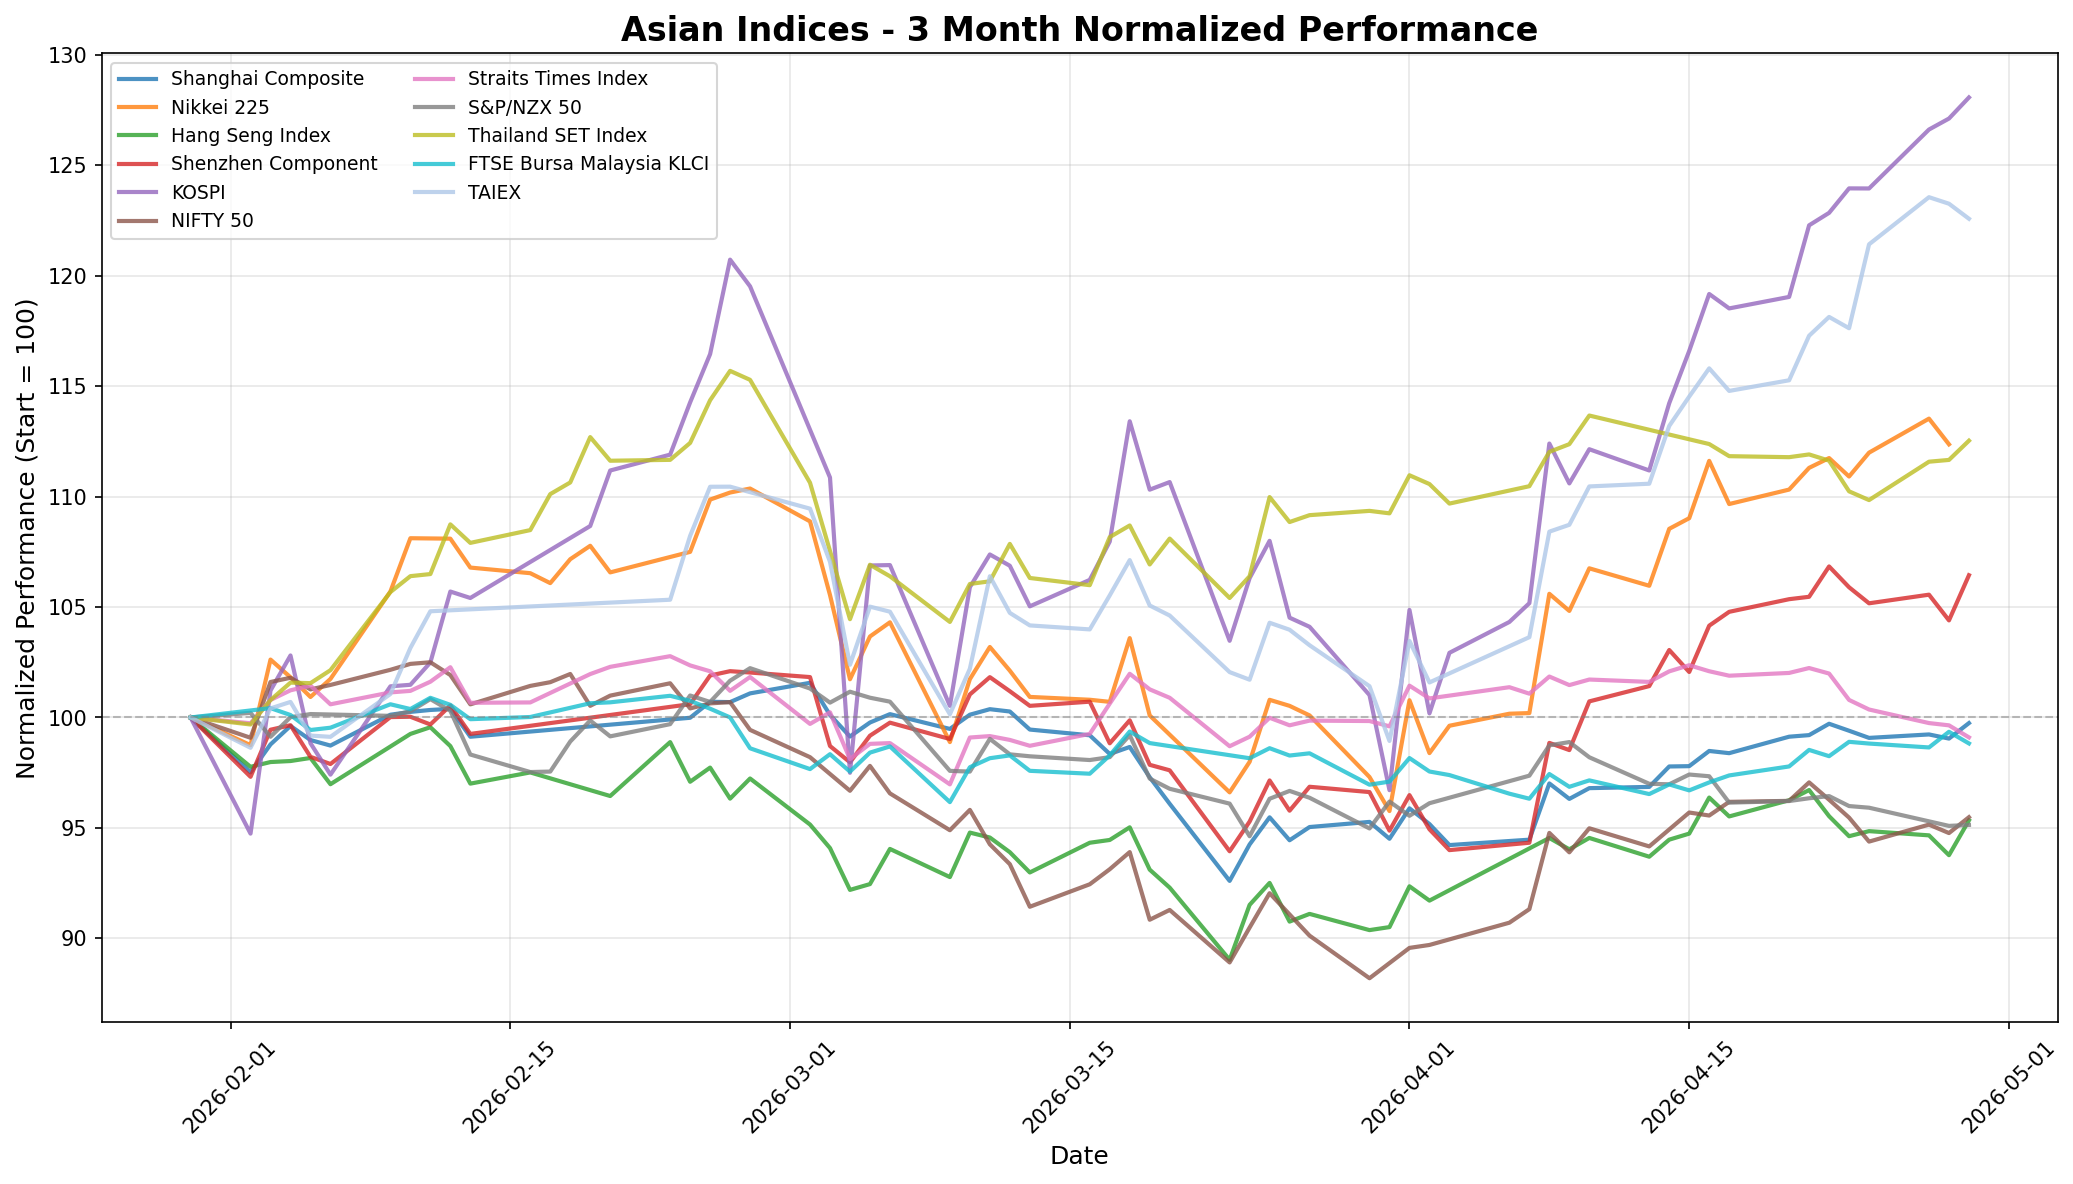
📊 Asian Indices Performance
| Index | Price | Daily Change (%) |
|---|---|---|
| Shanghai Composite | 4,107.51 | +0.71% |
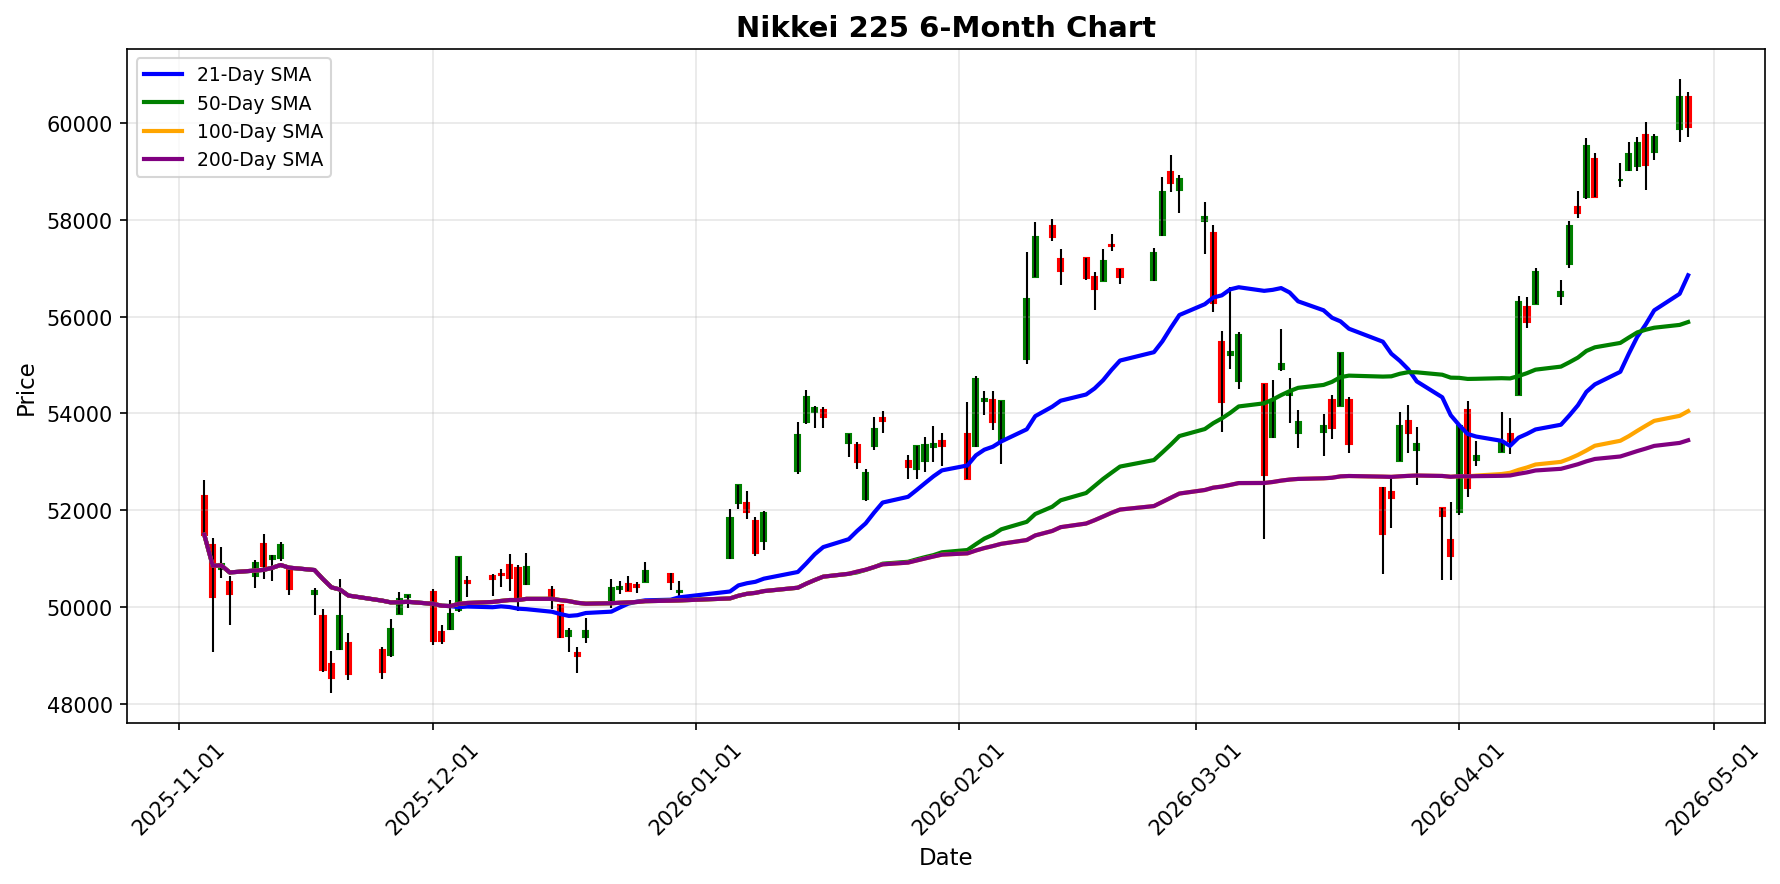
| Nikkei 225 | 59,917.46 | -1.02% |
| Hang Seng Index | 26,111.84 | +1.68% |
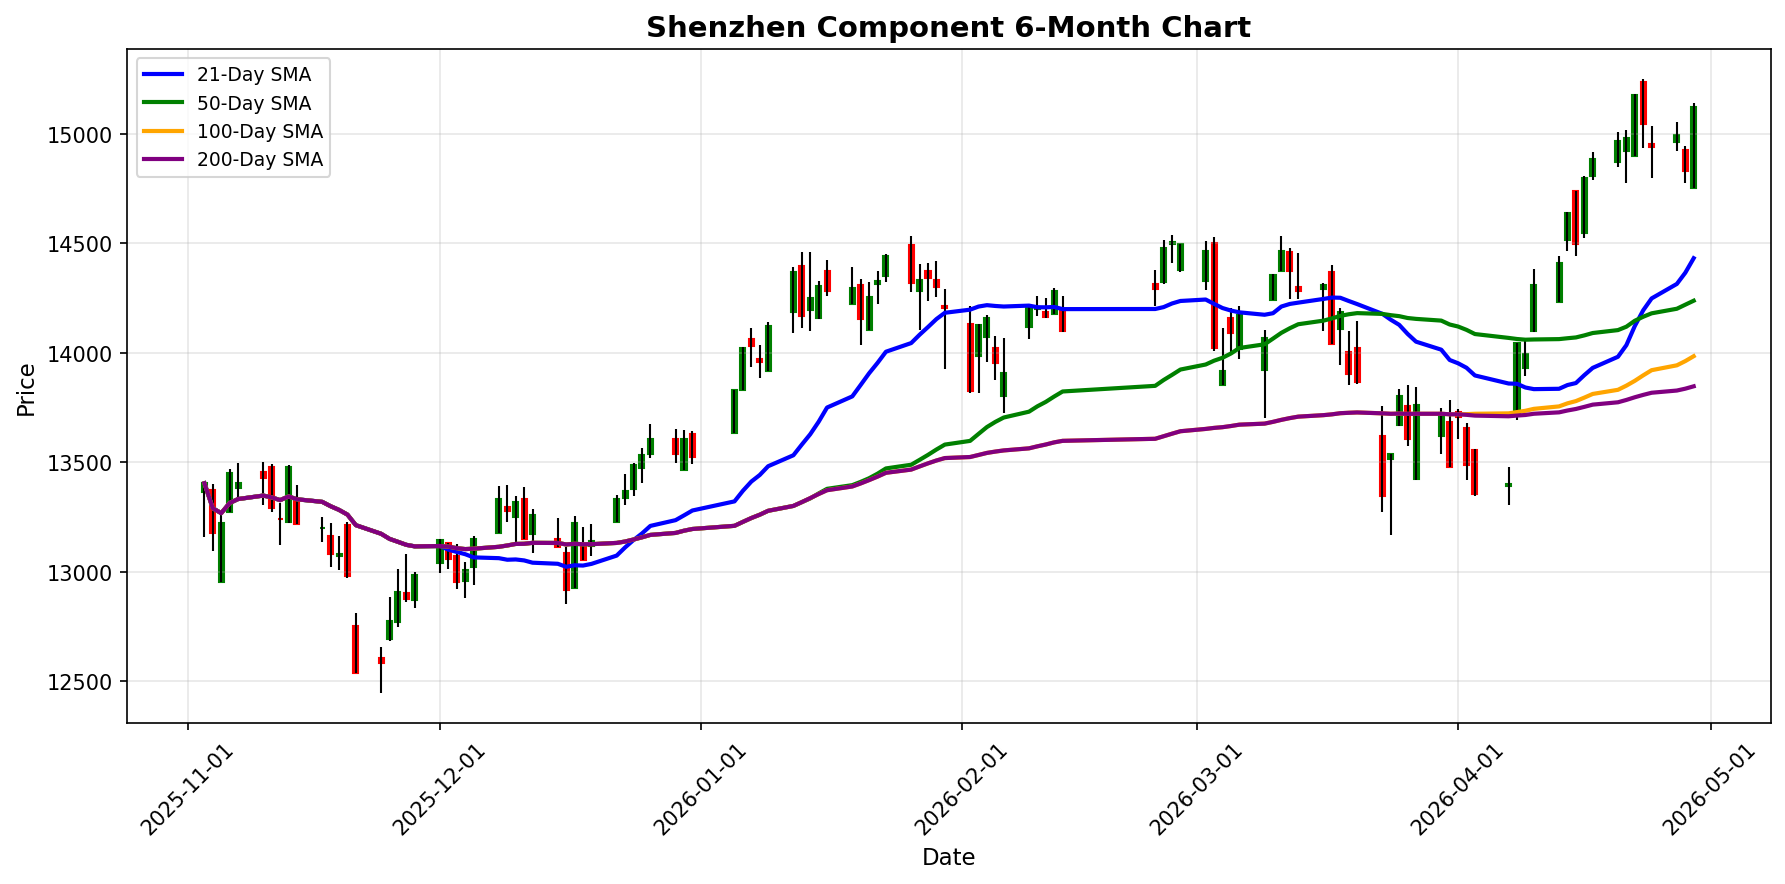
| Shenzhen Component | 15,120.92 | +1.96% |
| KOSPI | 6,690.90 | +0.75% |
| NIFTY 50 | 24,177.65 | +0.76% |
| Straits Times Index | 4,860.97 | -0.55% |
| S&P/NZX 50 | 12,770.30 | +0.05% |
| Thailand SET Index | 1,491.74 | +0.78% |
| FTSE Bursa Malaysia KLCI | 1,720.42 | -0.53% |
| TAIEX | 39,303.50 | -0.55% |
📰 Market Commentary
As of April 29, 2026, the Asian markets exhibited mixed performance influenced by various geopolitical and economic factors. ### Key Events Impacting Asian Indices 1. **Chinese AI Chip Surge**: Cambricon Technologies and MetaX Integrated Circuits reported significant revenue growth driven by the booming demand for local AI chips, reflecting China's push for self-sufficiency amid ongoing U.S. export controls. This development is expected to bolster investor confidence in the Chinese tech sector, contributing positively to indices like the Shanghai Composite and Shenzhen Component. 2. **UAE's OPEC Withdrawal**: The impending exit of the UAE from OPEC, effective May 1, is anticipated to impact global oil supply dynamics, particularly amid the ongoing Iran conflict. Analysts suggest that this could benefit China, which relies heavily on oil imports, potentially influencing market sentiment in the region. 3. **Hong Kong's SME Support Measures**: The Hong Kong government announced a substantial increase in lending for small and medium-sized enterprises (SMEs), amounting to HK$450 billion (approximately US$78.43 billion). This initiative aims to enhance business resilience amid global economic pressures, likely providing a boost to local market sentiment. ### Market Sentiment and Price Movements - **Shanghai Composite**: Increased by 0.71%, reflecting optimism from the AI chip sector's growth. - **Hang Seng Index**: Rose by 1.68%, buoyed by the SME support measures and overall positive sentiment in the tech sector. - **Shenzhen Component**: Gained 1.96%, benefiting from the strong performance of local tech companies. - **Nikkei 225**: Declined by 1.02%, influenced by broader tech jitters following disappointing growth figures from major U.S. tech firms. - **Straits Times Index**: Fell by 0.55%, reflecting mixed investor sentiment amid geopolitical concerns. ### Regional Economic Developments - **Japan's Yen Pressure**: The yen traded below the critical 160-per-dollar level, as traders anticipated the Bank of Japan's next moves regarding interest rates, adding to market uncertainty. - **Hong Kong's Fiscal Surplus**: The city reported a fiscal surplus of HK$11 billion, significantly higher than previous estimates, indicating a resilient economy despite external pressures from the Middle East conflict. - **Emerging Market Stocks**: The emerging market stock index reached a record high, largely driven by a rally in Asian chipmakers like TSMC, Samsung, and SK Hynix, which are recovering from losses linked to the Iran war. In summary, the Asian markets on April 29, 2026, are navigating a complex landscape shaped by technological advancements in China, geopolitical tensions, and supportive fiscal measures in Hong Kong, resulting in varied performance across regional indices.
📅 Economic Calendar - Asian Session
All times are in US Eastern Time (ET)
| Date | Time | Cur | Imp | Event | Actual | Forecast |
|---|---|---|---|---|---|---|
| 2026-04-29 | 19:50 | 🇯🇵 | Medium | Industrial Production (MoM) (Mar) | 1.0% | |
| 2026-04-29 | 21:30 | 🇨🇳 | Medium | Chinese Composite PMI (Apr) | ||
| 2026-04-29 | 21:30 | 🇨🇳 | High | Manufacturing PMI (Apr) | 50.1 | |
| 2026-04-29 | 21:30 | 🇨🇳 | Medium | Non-Manufacturing PMI (Apr) | 49.9 | |
| 2026-04-29 | 21:45 | 🇨🇳 | Medium | RatingDog Manufacturing PMI (MoM) (Apr) | 50.9 |
On April 29, 2026, several significant economic events from Asian countries were released, which are crucial for traders to analyze for market implications. 1. **Japan's Industrial Production (MoM) - March** - **Forecast**: 1.0% - **Actual**: Data not provided. - **Market Implications**: Depending on whether the actual figure meets or exceeds the forecast, traders should be prepared for volatility in the JPY and Japanese indices. A strong performance could indicate robust economic activity, potentially boosting investor confidence. 2. **China's Composite PMI - April** - **Forecast**: Data not provided. - **Actual**: Data not provided. - **Market Implications**: The absence of actual data makes it challenging to assess market sentiment. Traders should remain alert for any updates, as the Composite PMI is a key indicator of overall economic health in China. 3. **China's Manufacturing PMI - April** - **Forecast**: 50.1 - **Actual**: Data not provided. - **Market Implications**: A figure at or above 50 would indicate expansion in the manufacturing sector, which could positively impact Chinese equities and the CNY. Conversely, a lower reading could signal contraction, leading to bearish sentiment. 4. **China's Non-Manufacturing PMI - April** - **Forecast**: 49.9 - **Actual**: Data not provided. - **Market Implications**: A reading below 50 suggests a contraction in the services sector, which could weigh on market sentiment and lead to declines in related indices. Traders should monitor this closely for potential impacts on broader market trends. 5. **China's RatingDog Manufacturing PMI (MoM) - April** - **Forecast**: 50.9 - **Actual**: Data not provided. - **Market Implications**: Similar to the Manufacturing PMI, a
📈 Index Performance Charts
Best Performer: Shenzhen Component
Worst Performer: Nikkei 225
💱 FX, Commodities & Crypto
### FX Pairs Performance - **USD/JPY:** The pair is trading at 160.0980, reflecting a daily increase of 0.35%. The movement is likely driven by ongoing interest rate differentials and market sentiment regarding the Bank of Japan's monetary policy. - **USD/CNY:** Currently at 6.8375, this pair shows a minimal daily change of 0.01%. Stability in this pair may be attributed to China's economic data and the People's Bank of China's intervention strategies. - **AUD/USD:** The Australian dollar is down 0.60% against the USD, trading at 0.7140. This decline can be linked to weaker commodity prices and concerns over Australia's economic outlook. - **NZD/USD:** Trading at 0.5844, the New Zealand dollar has decreased by 0.70%. Similar to the AUD, the NZD's performance is influenced by commodity price fluctuations and global economic conditions. ### Commodities Performance - **Gold:** Priced at $4,548.90, gold has seen a decline of 0.93%. This drop may be driven by rising interest rates and a stronger USD, which typically dampens demand for non-yielding assets like gold. - **Silver:** Trading at $72.39, silver is down 1.11%. The decline reflects broader market trends affecting precious metals, including investor sentiment and industrial demand. - **Crude Oil (WTI):** WTI crude oil has experienced a notable increase of 4.65%, now priced at $104.58. This surge is likely due to supply constraints and geopolitical tensions affecting oil production and distribution. ### Cryptocurrency Performance - **Bitcoin:** Currently valued at $
Currency Pairs
| Pair | Price | Daily Change (%) |
|---|---|---|
| USD/JPY | 160.10 | +0.35% |
| USD/CNY | 6.84 | +0.01% |
| AUD/USD | 0.71 | -0.60% |
| NZD/USD | 0.58 | -0.70% |
Commodities
| Commodity | Price | Daily Change (%) |
|---|---|---|
| Gold | $4548.90 | -0.93% |
| Silver | $72.39 | -1.11% |
| Crude Oil (WTI) | $104.58 | +4.65% |
Cryptocurrencies
| Asset | Price | Daily Change (%) |
|---|---|---|
| Bitcoin | $76,751 | +0.52% |
| Ethereum | $2,303 | +0.60% |
Disclaimer
The content on MarketsFN.com is provided for educational and informational purposes only. It does not constitute financial advice, investment recommendations, or trading guidance. All investments involve risks, and past performance does not guarantee future results. You are solely responsible for your investment decisions and should conduct independent research and consult a qualified financial advisor before acting. MarketsFN.com and its authors are not liable for any losses or damages arising from your use of this information.