Silver: Down 0.1% to $73.39 — Below MA50 ($76.19) — Caution
· Commodities · QuoteReporter
Silver: Down 0.1% to $73.39 — Below MA50 ($76.19) — Caution
Analysis Date: June 04, 2026
📊 Current Market Data
CURRENT PRICE
$73.39
DAILY CHANGE
-0.11%
WEEKLY CHANGE
-2.97%
52W HIGH
$121.30
52W LOW
$35.27
💡 Key Market Factors
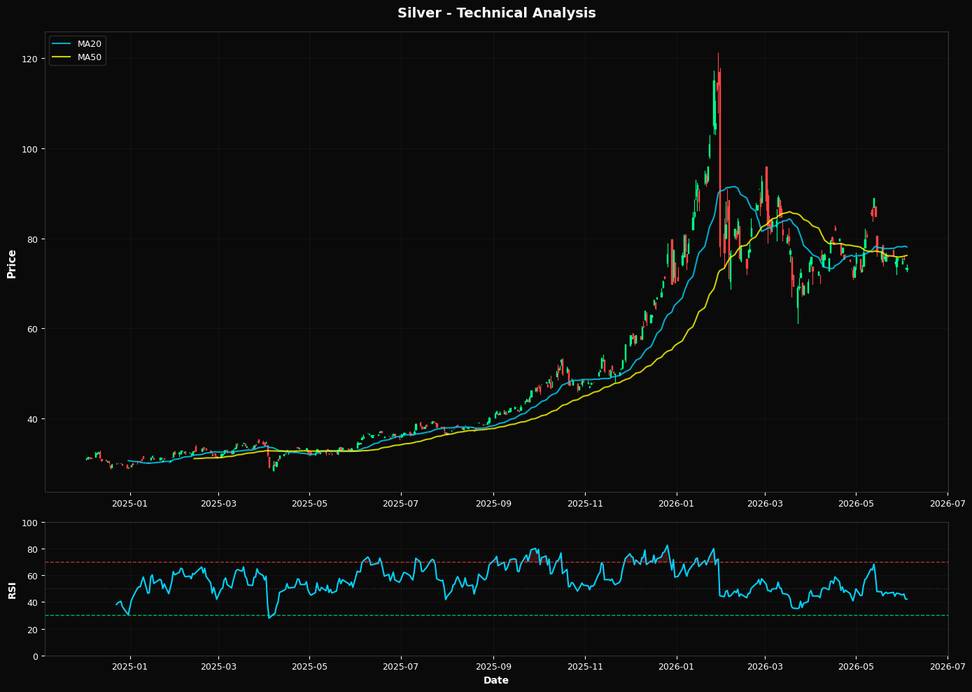
Silver's current price action suggests a potential buying opportunity as it hovers near its 200-day moving average, a critical technical support level. Despite a recent decline, with the price at $73.39 and a weekly drop of -2.97%, the metal's proximity to the 200-day MA of $66.34 indicates a possible floor. This technical setup, combined with a relatively neutral RSI of 42.1, suggests that silver might be oversold in the short term, offering a tactical entry point for investors anticipating a rebound. The most significant macro driver for silver right now is the Federal Reserve's interest rate policy. With inflationary pressures persisting, the Fed's stance on rate hikes will heavily influence silver's trajectory. A dovish pivot or pause in rate hikes could weaken the USD, making silver more attractive as a hedge against inflation and currency devaluation. Conversely, continued rate hikes could strengthen the dollar, exerting downward pressure on silver prices. The market may be underestimating the potential for a softer Fed stance if economic data begins to show signs of slowing inflation, which could provide a tailwind for silver. From a technical perspective, silver's current price below both the 20-day MA of $78.05 and the 50-day MA of $76.19 indicates a bearish short-term trend. However, the 200-day MA at $66.34 serves as a strong support level, suggesting limited downside risk. The nearest Fibonacci retracement level at 50.0% ($78.29) acts as a resistance, and a break above this could signal a reversal. The RSI of 42.1, while not in oversold territory, is close enough to suggest that selling pressure may be waning, potentially setting the stage for a bounce. A key catalyst that could alter silver's outlook is the upcoming U.S. inflation data release. Should the data indicate a significant cooling in inflation, it could prompt the Fed to reconsider its aggressive rate hike trajectory, thereby weakening the USD and boosting silver prices. Conversely, stronger-than-expected inflation figures could reinforce the Fed's hawkish stance, applying further pressure on silver. Investors should closely watch this data point, as it will be pivotal in confirming or invalidating the current technical and macroeconomic setup for silver.📈 Technical Indicators Summary
RSI (14)
42.1
50-Day MA
$76.19
200-Day MA
$66.34
Fib Level
50.0%
📊 Technical Analysis Chart (18-Month View)
📐 Fibonacci Retracement Analysis
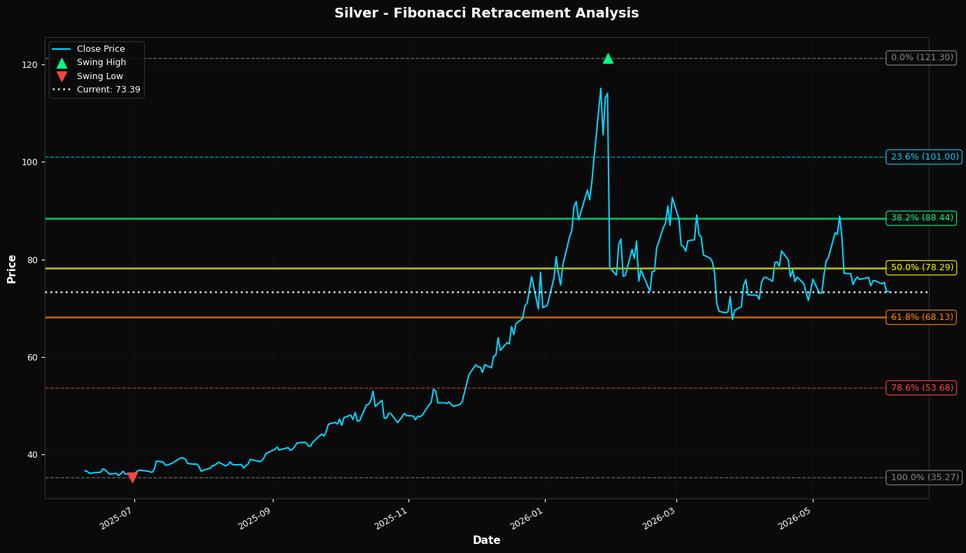
🎯 Key Trading Levels
Key Fibonacci Levels:
- 38.2%: $88.44
- 50.0%: $78.29
- 61.8%: $68.13
Support: $35.27 (Swing Low), $76.19 (50-Day MA)
Resistance: $121.30 (Swing High)
Disclaimer
The content on MarketsFN.com is provided for educational and informational purposes only. It does not constitute financial advice, investment recommendations, or trading guidance. All investments involve risks, and past performance does not guarantee future results. You are solely responsible for your investment decisions and should conduct independent research and consult a qualified financial advisor before acting. MarketsFN.com and its authors are not liable for any losses or damages arising from your use of this information.