Silver: Down 1.8% to $57.01 — Oversold at RSI 27 — Watching for Bounce
· Commodities · QuoteReporter
Silver: Down 1.8% to $57.01 — Oversold at RSI 27 — Watching for Bounce
Analysis Date: June 25, 2026
📊 Current Market Data
CURRENT PRICE
$57.01
DAILY CHANGE
-1.80%
WEEKLY CHANGE
-19.37%
52W HIGH
$121.30
52W LOW
$35.27
💡 Key Market Factors
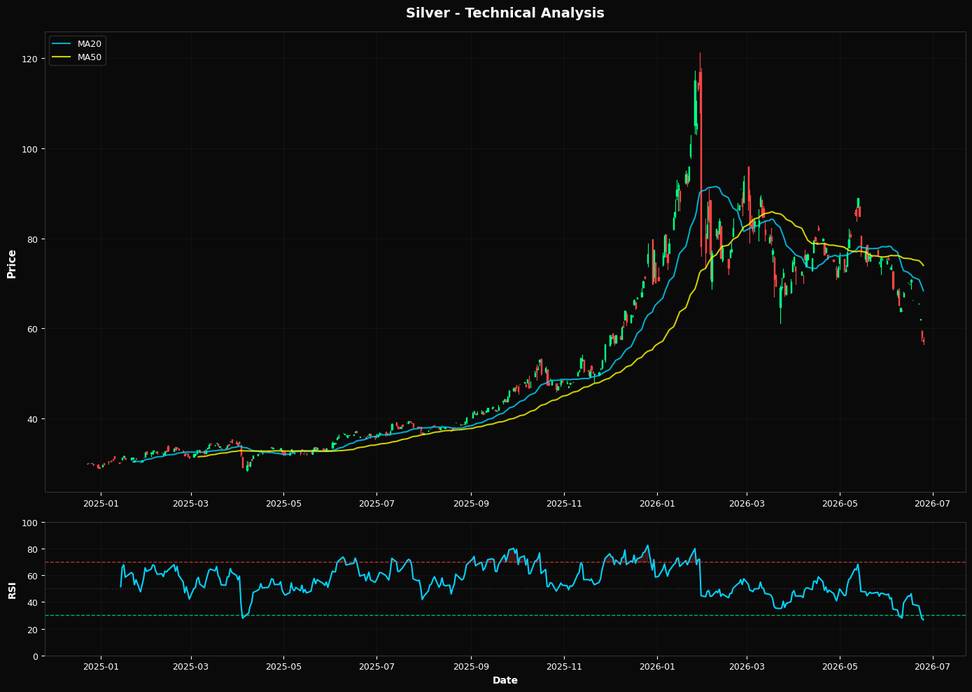
Silver's sharp decline to $57.01, down 19.37% weekly, signals a market underestimating the impact of a strengthening U.S. dollar. The USD's appreciation, driven by hawkish Federal Reserve policy, is exerting significant downward pressure on silver prices. As the Fed maintains its aggressive stance on interest rates to combat inflation, the dollar's strength is likely to persist, making silver less attractive as a non-yielding asset. This macroeconomic backdrop is crucial, as it directly influences silver's demand and pricing dynamics, overshadowing other factors like inflation itself. Technically, silver's RSI of 26.6 indicates it is deeply oversold, suggesting potential for a short-term rebound. However, the price remains significantly below key moving averages—$68.36 (MA20), $73.96 (MA50), and $68.17 (MA200)—highlighting a strong bearish trend. The nearest Fibonacci support at $68.13 is well above the current price, reinforcing the bearish outlook. The market's failure to hold above these technical levels suggests further downside risk unless a catalyst emerges to reverse sentiment. A key risk that could alter silver's trajectory is a shift in Federal Reserve policy. Should upcoming economic data, such as employment figures or inflation reports, indicate a cooling economy, the Fed might pivot to a more dovish stance. This would weaken the dollar and potentially boost silver prices. The market may be underpricing this possibility, focusing too heavily on current Fed rhetoric without considering the potential for rapid policy shifts in response to changing economic conditions. Looking ahead, the next Federal Reserve meeting and subsequent commentary will be critical. Any indication of a policy shift could validate a bullish reversal in silver. Conversely, continued hawkishness would likely confirm the current bearish trend. Investors should closely monitor Fed communications and key economic indicators for signs of a policy pivot, which would be the clearest signal for a change in silver's direction.📈 Technical Indicators Summary
RSI (14)
26.6
50-Day MA
$73.96
200-Day MA
$68.17
Fib Level
61.8%
📊 Technical Analysis Chart (18-Month View)
📐 Fibonacci Retracement Analysis
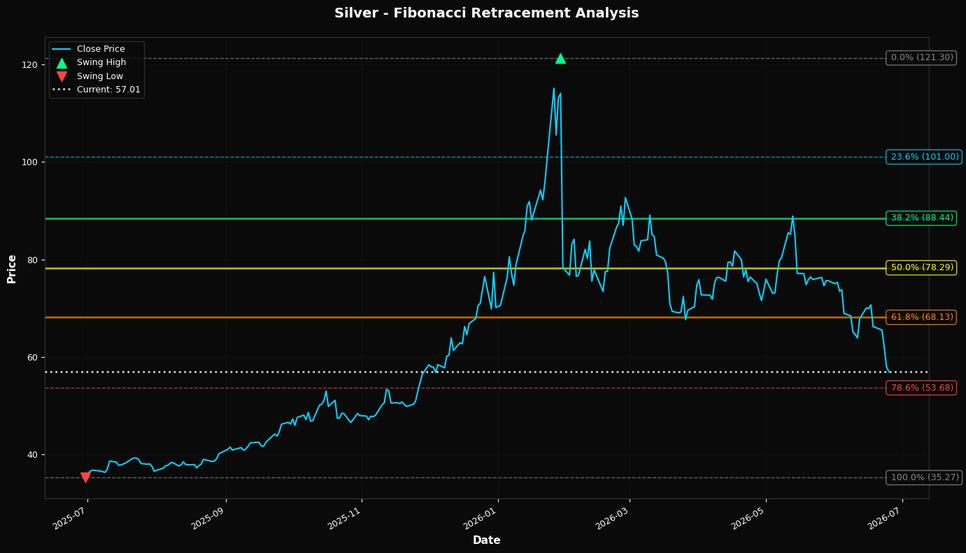
🎯 Key Trading Levels
Key Fibonacci Levels:
- 38.2%: $88.44
- 50.0%: $78.29
- 61.8%: $68.13
Support: $35.27 (Swing Low), $73.96 (50-Day MA)
Resistance: $121.30 (Swing High)
Disclaimer
The content on MarketsFN.com is provided for educational and informational purposes only. It does not constitute financial advice, investment recommendations, or trading guidance. All investments involve risks, and past performance does not guarantee future results. You are solely responsible for your investment decisions and should conduct independent research and consult a qualified financial advisor before acting. MarketsFN.com and its authors are not liable for any losses or damages arising from your use of this information.