Silver: Down 2.6% to $67.12 — Testing 61.8% Fibonacci Support
· Commodities · QuoteReporter
Silver: Down 2.6% to $67.12 — Testing 61.8% Fibonacci Support
Analysis Date: June 08, 2026
📊 Current Market Data
CURRENT PRICE
$67.12
DAILY CHANGE
-2.64%
WEEKLY CHANGE
-10.51%
52W HIGH
$121.30
52W LOW
$35.27
💡 Key Market Factors
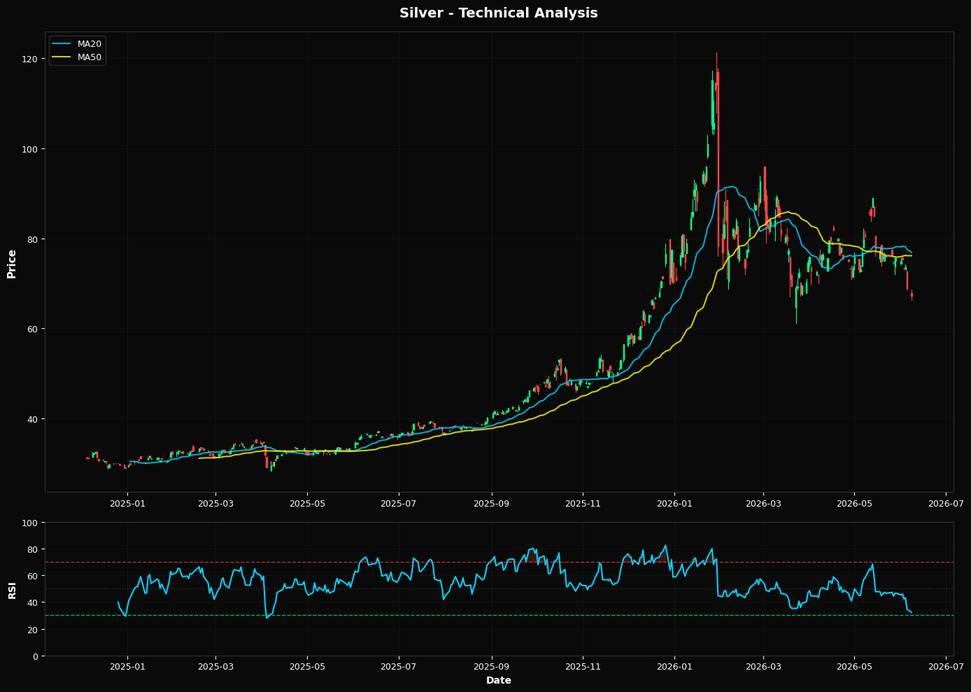
Silver's current price action suggests a potential rebound opportunity, driven by its proximity to a critical Fibonacci support level. With silver trading at $67.12, just below the 61.8% Fibonacci retracement level at $68.13, the market is at a pivotal juncture. This technical setup, combined with an RSI of 32.2 indicating oversold conditions, suggests that silver may be poised for a bounce. The market appears to be underpricing the potential for a technical reversal, especially given the significant weekly decline of -10.51%. The most pressing macro driver for silver right now is the strength of the U.S. dollar. As silver is priced in dollars, any appreciation in the USD can exert downward pressure on silver prices. However, the Federal Reserve's monetary policy stance could shift this dynamic. If the Fed signals a pause or slowdown in rate hikes, it could weaken the dollar, providing a tailwind for silver. Currently, the market may be overly focused on inflation data, but the real impact will come from how the Fed interprets this data in terms of its rate policy. From a technical perspective, silver's current price below both the 20-day and 50-day moving averages ($76.87 and $76.12, respectively) indicates a bearish trend. However, its proximity to the 200-day moving average at $66.65 suggests that this level could act as a long-term support. The RSI of 32.2 further supports the case for a potential rebound, as it signals that the commodity is oversold. The market may be missing the potential for a short-term rally if silver holds above the 200-day moving average and rebounds from the Fibonacci support. A key catalyst that could alter the current bearish sentiment is the upcoming Federal Reserve meeting. If the Fed adopts a dovish tone, indicating a pause in rate hikes, it could lead to a weaker dollar and provide a boost to silver prices. Conversely, a hawkish stance could reinforce the current downtrend. Investors should closely watch the Fed's language and any changes in its economic projections, as these will be critical in determining the next directional move for silver.📈 Technical Indicators Summary
RSI (14)
32.2
50-Day MA
$76.12
200-Day MA
$66.65
Fib Level
61.8%
📊 Technical Analysis Chart (18-Month View)
📐 Fibonacci Retracement Analysis
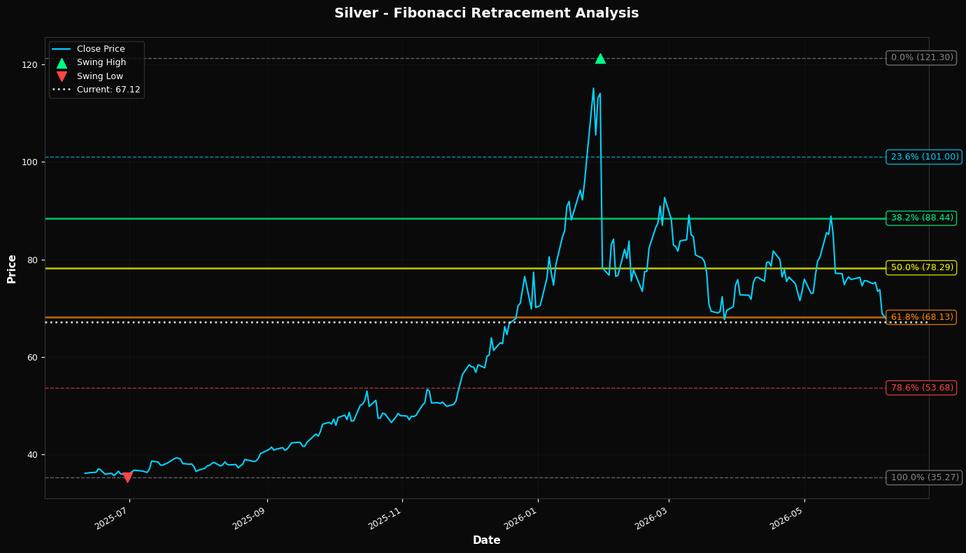
🎯 Key Trading Levels
Key Fibonacci Levels:
- 38.2%: $88.44
- 50.0%: $78.29
- 61.8%: $68.13
Support: $35.27 (Swing Low), $76.12 (50-Day MA)
Resistance: $121.30 (Swing High)
Disclaimer
The content on MarketsFN.com is provided for educational and informational purposes only. It does not constitute financial advice, investment recommendations, or trading guidance. All investments involve risks, and past performance does not guarantee future results. You are solely responsible for your investment decisions and should conduct independent research and consult a qualified financial advisor before acting. MarketsFN.com and its authors are not liable for any losses or damages arising from your use of this information.