Silver: Down 5.2% to $67.04 — Testing 61.8% Fibonacci Support
· Commodities · QuoteReporter
Silver: Down 5.2% to $67.04 — Testing 61.8% Fibonacci Support
Analysis Date: June 18, 2026
📊 Current Market Data
CURRENT PRICE
$67.04
DAILY CHANGE
-5.16%
WEEKLY CHANGE
+4.95%
52W HIGH
$121.30
52W LOW
$35.27
💡 Key Market Factors
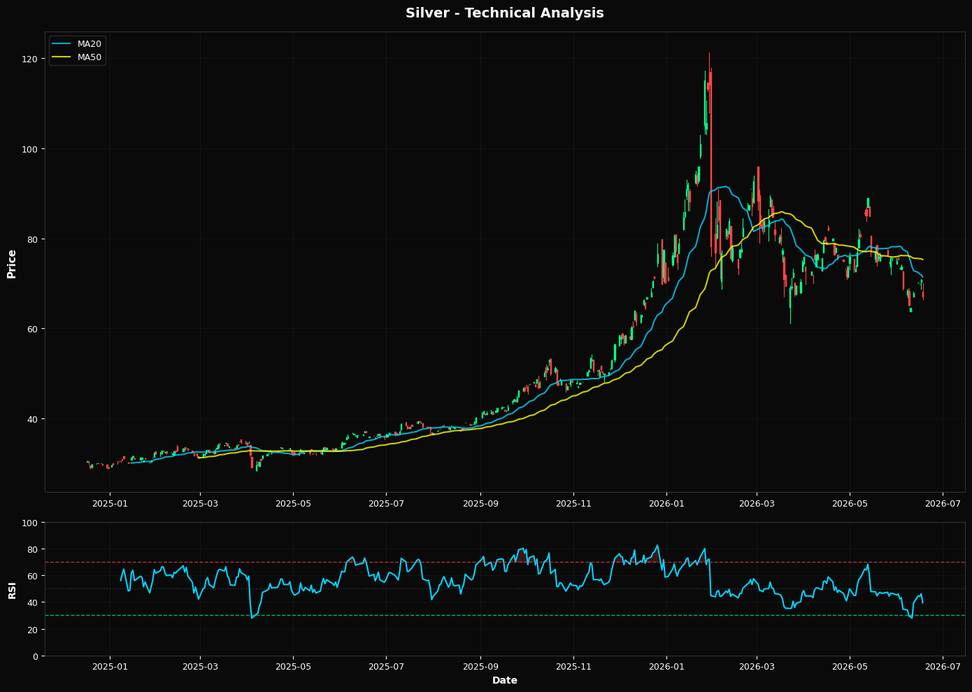
Silver's current price action suggests a bearish outlook, driven by technical weakness and macroeconomic pressures. The most pressing macro driver for silver today is the strength of the U.S. dollar, which has been bolstered by the Federal Reserve's hawkish stance on interest rates. As the Fed continues to signal higher rates to combat inflation, the dollar strengthens, making dollar-denominated commodities like silver more expensive for foreign buyers. This dynamic is critical, as it directly impacts demand and can suppress silver prices further. Technically, silver is under significant pressure. The Relative Strength Index (RSI) at 39.4 indicates that silver is approaching oversold territory, yet it hasn't reached the extreme levels that typically precede a reversal. The current price of $67.04 is below both the 20-day moving average ($71.43) and the 50-day moving average ($75.27), suggesting a bearish trend. Furthermore, the price is also below the 200-day moving average of $67.78, reinforcing the downtrend. The nearest Fibonacci support level at 61.8% is $68.13, which silver has breached, indicating potential for further downside. This technical setup suggests a continuation of the bearish momentum unless a significant catalyst emerges. A key risk that could alter this bearish outlook is a sudden shift in Federal Reserve policy. If upcoming economic data, such as the Consumer Price Index (CPI), shows a significant decline in inflation, it could prompt the Fed to pause or even cut rates sooner than expected. Such a move would likely weaken the dollar, providing relief to silver prices. The market may be underpricing the potential for a rapid change in inflation dynamics, which could lead to a swift reversal in silver's fortunes. Looking ahead, the next CPI release will be crucial. A lower-than-expected inflation figure could validate a bullish reversal in silver by alleviating some of the pressure from the strong dollar. Conversely, if inflation remains stubbornly high, it would likely confirm the current bearish trend, as the Fed would be compelled to maintain its aggressive rate stance. This data point will be pivotal in determining the next directional move for silver.📈 Technical Indicators Summary
RSI (14)
39.4
50-Day MA
$75.27
200-Day MA
$67.78
Fib Level
61.8%
📊 Technical Analysis Chart (18-Month View)
📐 Fibonacci Retracement Analysis
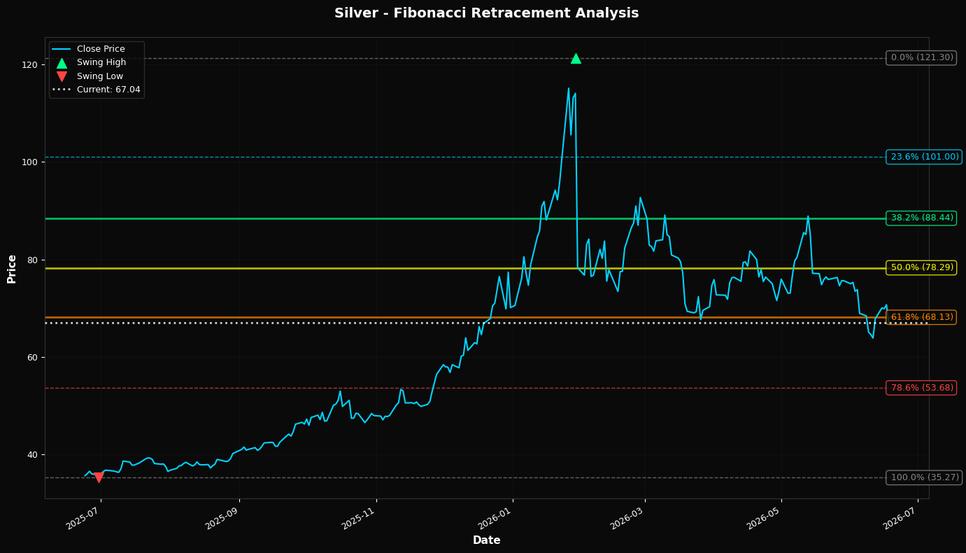
🎯 Key Trading Levels
Key Fibonacci Levels:
- 38.2%: $88.44
- 50.0%: $78.29
- 61.8%: $68.13
Support: $35.27 (Swing Low), $75.27 (50-Day MA)
Resistance: $121.30 (Swing High)
Disclaimer
The content on MarketsFN.com is provided for educational and informational purposes only. It does not constitute financial advice, investment recommendations, or trading guidance. All investments involve risks, and past performance does not guarantee future results. You are solely responsible for your investment decisions and should conduct independent research and consult a qualified financial advisor before acting. MarketsFN.com and its authors are not liable for any losses or damages arising from your use of this information.