Silver Gains 1.2% near 50.0% Fibonacci resistance
· Commodities · QuoteReporter
Silver Gains 1.2% near 50.0% Fibonacci resistance
Analysis Date: May 20, 2026
📊 Current Market Data
CURRENT PRICE
$75.75
DAILY CHANGE
+1.24%
WEEKLY CHANGE
-14.77%
52W HIGH
$121.30
52W LOW
$32.66
💡 Key Market Factors
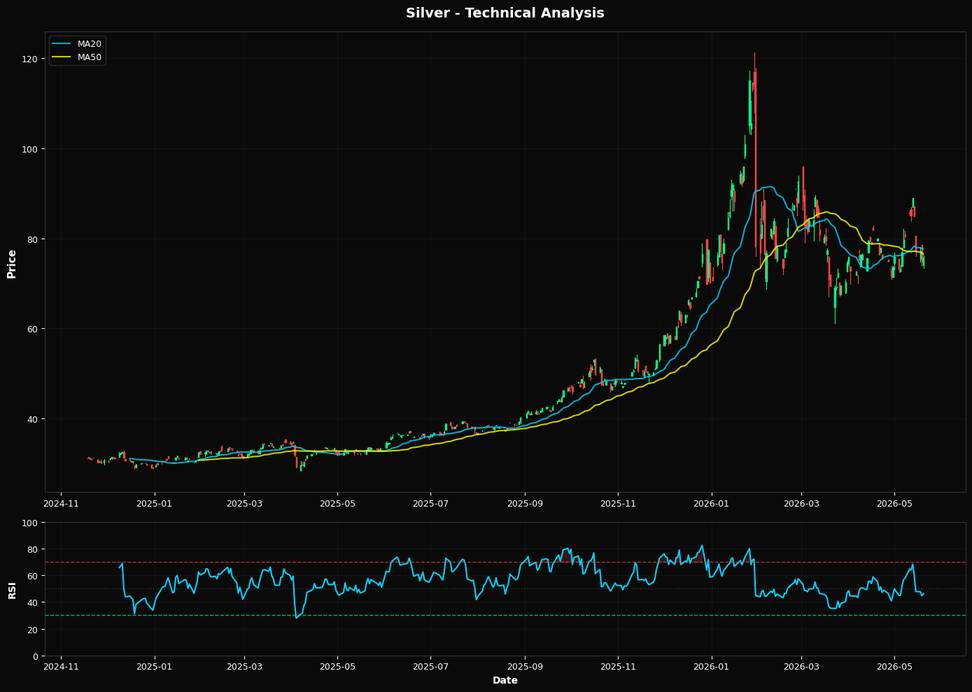
Silver's recent price movement reflects a mixed technical outlook, with the metal currently trading at $75.75. The price is below both the 20-day moving average ($77.67) and the 50-day moving average ($76.48), indicating a bearish trend in the short to medium term. The Relative Strength Index (RSI) stands at 46.2, suggesting that silver is neither overbought nor oversold, but it is approaching a neutral zone, which may imply potential consolidation or further downside pressure. From a macroeconomic perspective, the Federal Reserve's monetary policy remains a critical factor influencing silver prices. With the Fed maintaining a hawkish stance to combat inflation, interest rates are expected to remain elevated, which typically strengthens the U.S. dollar and applies downward pressure on non-yielding assets like silver. However, any signs of inflation persisting beyond expectations could renew interest in silver as a hedge, potentially supporting prices. Geopolitical tensions, while not currently at a peak, remain a background risk that could impact silver prices. Any significant escalation in global conflicts or trade disruptions could lead to increased demand for safe-haven assets, including silver. However, absent major developments, these factors are not presently exerting a strong influence on the market. Technically, silver is approaching the nearest Fibonacci retracement level of 50.0% at $76.98, which could act as a resistance point if the price attempts to recover. A break above this level may indicate a potential reversal or at least a short-term rally. Conversely, failure to breach this level could reinforce the current bearish sentiment, especially if macroeconomic conditions continue to favor a strong dollar environment.📈 Technical Indicators Summary
RSI (14)
46.2
50-Day MA
$76.48
200-Day MA
$64.48
Fib Level
50.0%
📊 Technical Analysis Chart (18-Month View)
📐 Fibonacci Retracement Analysis
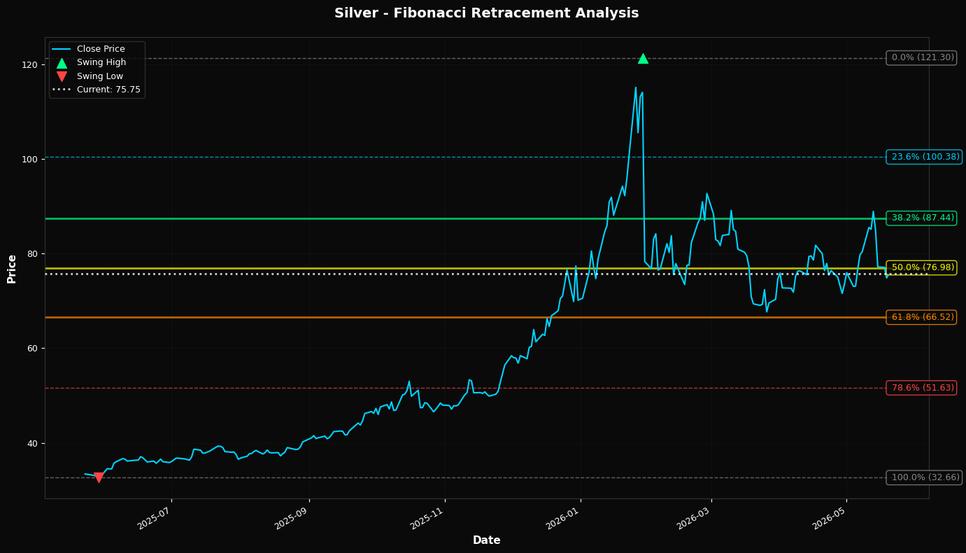
🎯 Key Trading Levels
Key Fibonacci Levels:
- 38.2%: $87.44
- 50.0%: $76.98
- 61.8%: $66.52
Support: $32.66 (Swing Low), $76.48 (50-Day MA)
Resistance: $121.30 (Swing High)
Disclaimer
The content on MarketsFN.com is provided for educational and informational purposes only. It does not constitute financial advice, investment recommendations, or trading guidance. All investments involve risks, and past performance does not guarantee future results. You are solely responsible for your investment decisions and should conduct independent research and consult a qualified financial advisor before acting. MarketsFN.com and its authors are not liable for any losses or damages arising from your use of this information.