Silver Retraces 1.6% near 38.2% Fibonacci resistance
· Commodities · QuoteReporter
Silver Retraces 1.6% near 38.2% Fibonacci resistance
Analysis Date: May 14, 2026
📊 Current Market Data
CURRENT PRICE
$87.45
DAILY CHANGE
-1.62%
WEEKLY CHANGE
+9.72%
52W HIGH
$121.30
52W LOW
$31.91
💡 Key Market Factors
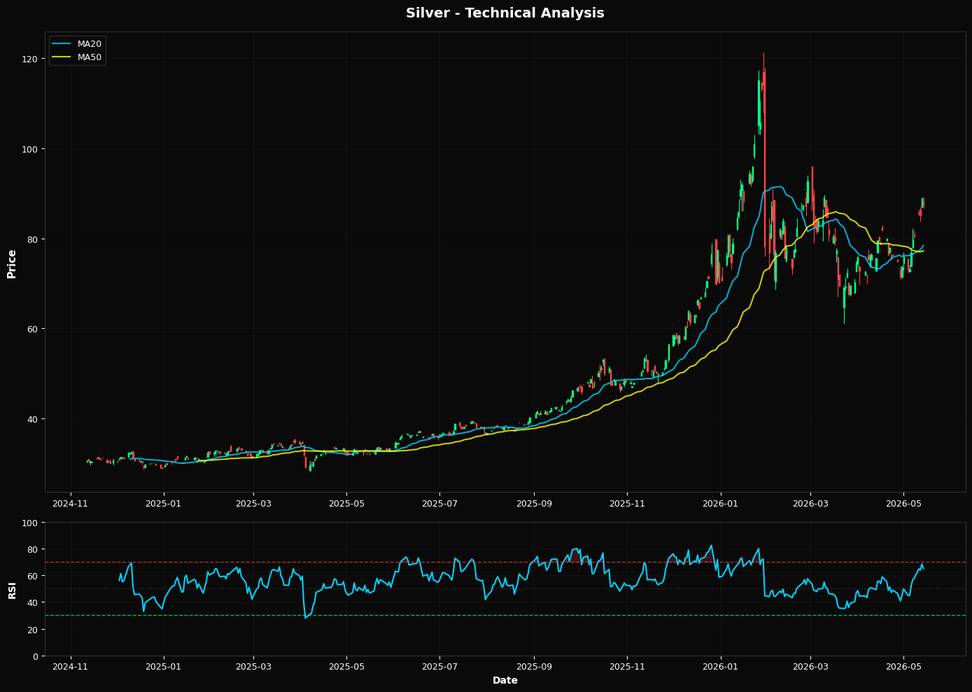
Silver's recent price movements reflect a strong upward trend, evidenced by a 9.72% increase over the past week. This surge can be partially attributed to inflationary pressures, as investors often turn to precious metals like silver as a hedge against inflation. With inflation rates remaining elevated, demand for silver could continue to rise, supporting higher prices. The Federal Reserve's monetary policy plays a crucial role in silver's trajectory. While the Fed has maintained a hawkish stance to combat inflation, any indication of a pause or slowdown in rate hikes could further bolster silver prices. The current environment of high interest rates typically dampens demand for non-yielding assets like silver, but persistent inflation concerns may counterbalance this effect. From a technical perspective, silver's RSI of 65.1 suggests it is approaching overbought territory, indicating potential for a short-term pullback. However, the price remains above both the 20-day and 50-day moving averages, signaling ongoing bullish momentum. The proximity to the nearest Fibonacci retracement level at $87.21 suggests a critical point of resistance, which, if breached, could lead to further upside potential.📈 Technical Indicators Summary
RSI (14)
65.1
50-Day MA
$77.21
200-Day MA
$63.71
Fib Level
38.2%
📊 Technical Analysis Chart (18-Month View)
📐 Fibonacci Retracement Analysis
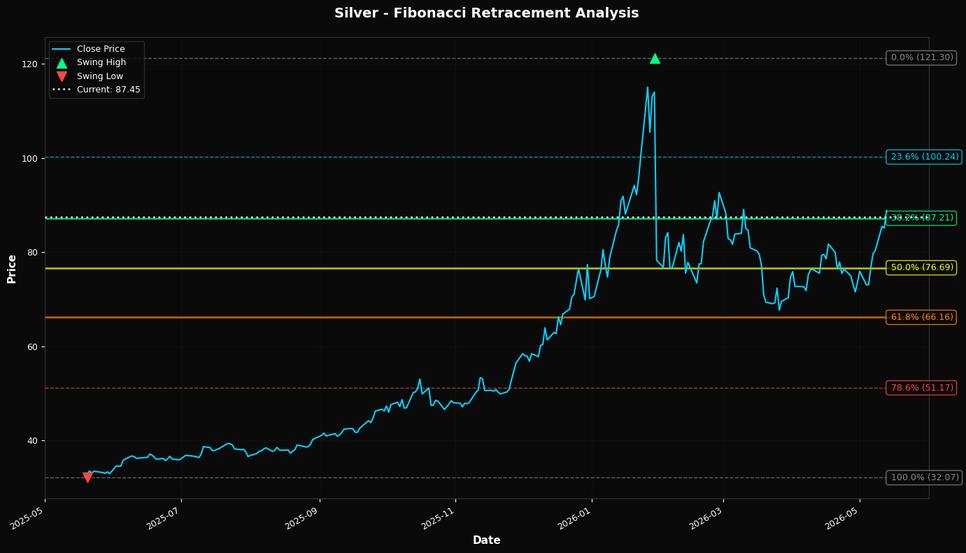
🎯 Key Trading Levels
Key Fibonacci Levels:
- 38.2%: $87.21
- 50.0%: $76.69
- 61.8%: $66.16
Support: $32.07 (Swing Low), $77.21 (50-Day MA)
Resistance: $121.30 (Swing High)
Disclaimer
The content on MarketsFN.com is provided for educational and informational purposes only. It does not constitute financial advice, investment recommendations, or trading guidance. All investments involve risks, and past performance does not guarantee future results. You are solely responsible for your investment decisions and should conduct independent research and consult a qualified financial advisor before acting. MarketsFN.com and its authors are not liable for any losses or damages arising from your use of this information.