Silver Sells Off 9.7% near 50.0% Fibonacci resistance
· Commodities · QuoteReporter
Silver Sells Off 9.7% near 50.0% Fibonacci resistance
Analysis Date: May 15, 2026
📊 Current Market Data
CURRENT PRICE
$76.71
DAILY CHANGE
-9.67%
WEEKLY CHANGE
-4.59%
52W HIGH
$121.30
52W LOW
$31.91
💡 Key Market Factors
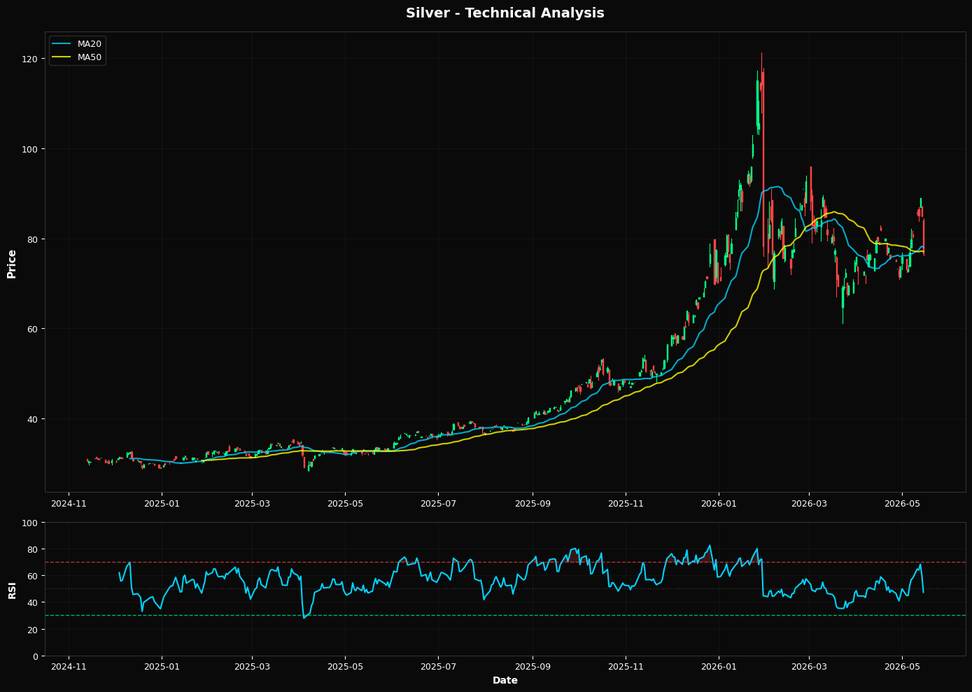
Silver's recent price movement, with a notable daily decline of 9.67% and a weekly drop of 4.59%, reflects heightened market volatility. This decline may be influenced by shifting expectations regarding U.S. Federal Reserve policy. Recent comments from Fed officials indicate a potential pause or slowdown in rate hikes, which generally supports precious metals by reducing the opportunity cost of holding non-yielding assets like silver. However, the sharp price drop suggests that this sentiment may not have fully offset other bearish pressures. From a technical perspective, silver's current price of $76.71 is hovering around the 50.0% Fibonacci retracement level at $76.69, indicating a critical juncture. The Relative Strength Index (RSI) of 47.2 suggests that silver is neither overbought nor oversold, providing no immediate directional bias. The price is also trading below both the 20-day moving average ($77.98) and the 50-day moving average ($77.06), which could signal further bearish sentiment unless a rebound occurs. Geopolitical factors currently have a muted direct impact on silver prices, with no major events drastically altering supply or demand dynamics. However, the broader macroeconomic environment, including inflationary pressures, continues to play a role. Persistent inflation could eventually support silver prices as investors seek hedges against currency devaluation. Nonetheless, the immediate focus remains on monetary policy and technical signals, which appear to be exerting more immediate influence on silver's trajectory.📈 Technical Indicators Summary
RSI (14)
47.2
50-Day MA
$77.06
200-Day MA
$63.89
Fib Level
50.0%
📊 Technical Analysis Chart (18-Month View)
📐 Fibonacci Retracement Analysis
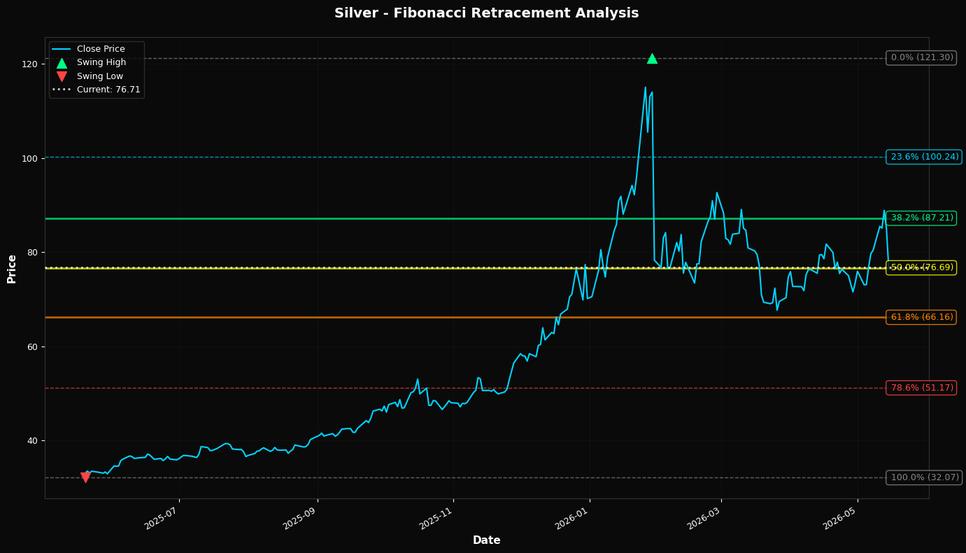
🎯 Key Trading Levels
Key Fibonacci Levels:
- 38.2%: $87.21
- 50.0%: $76.69
- 61.8%: $66.16
Support: $32.07 (Swing Low), $77.06 (50-Day MA)
Resistance: $121.30 (Swing High)
Disclaimer
The content on MarketsFN.com is provided for educational and informational purposes only. It does not constitute financial advice, investment recommendations, or trading guidance. All investments involve risks, and past performance does not guarantee future results. You are solely responsible for your investment decisions and should conduct independent research and consult a qualified financial advisor before acting. MarketsFN.com and its authors are not liable for any losses or damages arising from your use of this information.