Solana Dips to $77.27 as RSI Holds at 67.3 Amid 4.19% Drop
· Crypto · QuoteReporter
Solana Dips to $77.27 as RSI Holds at 67.3 Amid 4.19% Drop
Solana (SOL/USD) | July 08, 2026 $77.2700 -4.19%
🔍 Technical Analysis
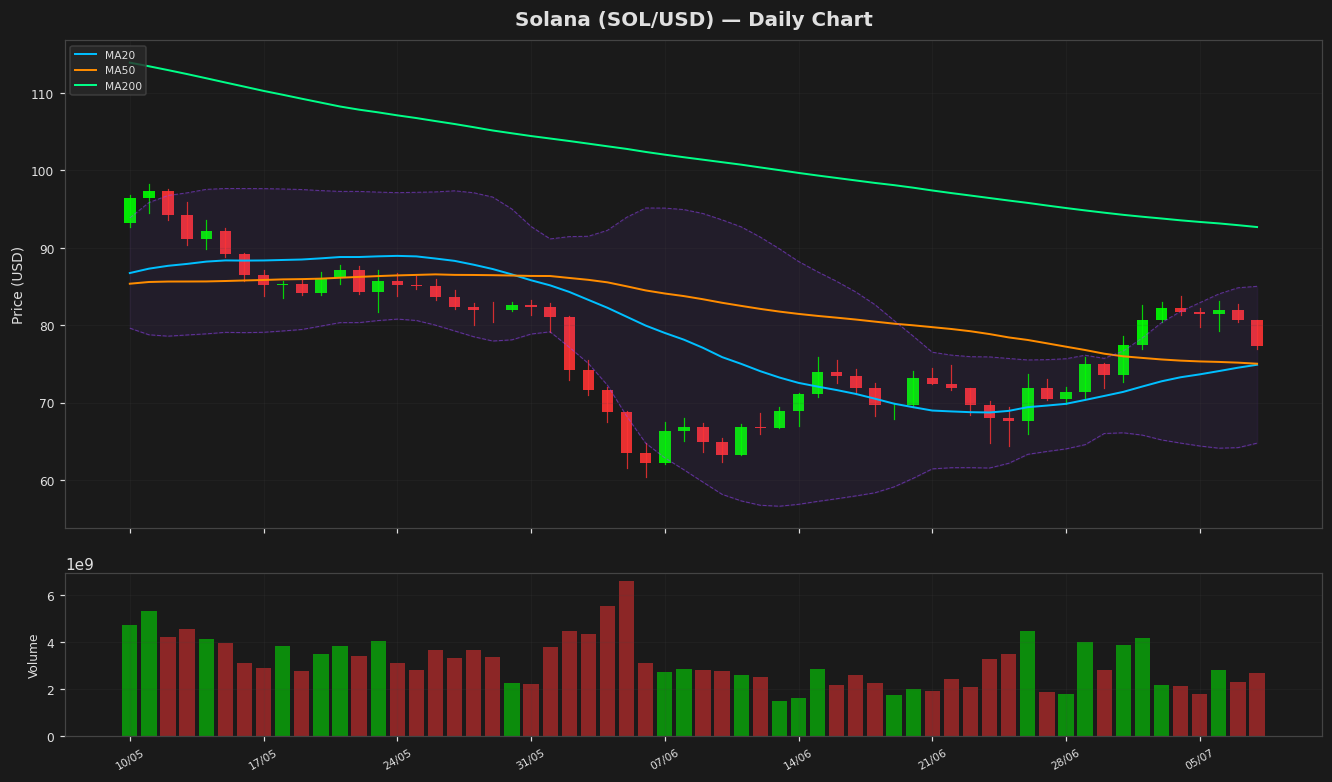
Solana (SOL) is currently trading at $77.27, down 4.19% on the day, showing short-term bearish momentum. The price remains above the 20-day MA ($74.88) and 50-day MA ($75.02), indicating underlying support, but the 200-day MA ($92.68) looms as a key resistance level, reflecting a longer-term downtrend. Bollinger Bands show the upper band at $85.02 and the lower band at $64.75, with price hovering near the middle band, suggesting consolidation. The narrowing bands imply reduced volatility, potentially preceding a breakout.
The RSI at 67.32 is in the upper-neutral range, nearing overbought territory but not yet signaling extreme bullish exhaustion. The MACD line (2.04) remains above the signal line (1.24), confirming bullish momentum, though the histogram shows weakening upward strength. Key support lies at the 20/50-day MA confluence ($74-75), followed by the lower Bollinger Band ($64.75). Resistance is at $85.02 (upper Bollinger Band), with stronger hurdles at the 200-day MA ($92.68) and psychological $100 level.
Year-to-date, SOL has struggled to reclaim its YTD high ($148.22), while the 52-week low ($60.41) acts as a critical floor. The ATR (3.94) suggests moderate volatility. A break above $85 could target $92, while failure to hold $74 may test $64.75. Traders should watch MACD convergence and RSI for trend confirmation.
The RSI at 67.32 is in the upper-neutral range, nearing overbought territory but not yet signaling extreme bullish exhaustion. The MACD line (2.04) remains above the signal line (1.24), confirming bullish momentum, though the histogram shows weakening upward strength. Key support lies at the 20/50-day MA confluence ($74-75), followed by the lower Bollinger Band ($64.75). Resistance is at $85.02 (upper Bollinger Band), with stronger hurdles at the 200-day MA ($92.68) and psychological $100 level.
Year-to-date, SOL has struggled to reclaim its YTD high ($148.22), while the 52-week low ($60.41) acts as a critical floor. The ATR (3.94) suggests moderate volatility. A break above $85 could target $92, while failure to hold $74 may test $64.75. Traders should watch MACD convergence and RSI for trend confirmation.
Technical Metrics
| Metric | Value |
|---|---|
| Current Price | $77.2700 |
| Daily Change | -4.19% |
| MA 20 | $74.8832 |
| % from MA20 | +3.19% |
| MA 50 | $75.0167 |
| % from MA50 | +3.00% |
| MA 200 | $92.6817 |
| % from MA200 | -16.63% |
| BB Upper | $85.0189 |
| % from BB Upper | -9.11% |
| BB Lower | $64.7474 |
| % from BB Lower | +19.34% |
| RSI (14) | 67.32 |
| MACD | 2.042112 |
| MACD Signal | 1.239464 |
| ATR (14) | 3.942232 |
| 3-Day High | $83.0594 |
| 3-Day Low | $76.9385 |
| 52-Week High | $198.0395 |
| % from 52W High | -60.98% |
| 52-Week Low | $60.4147 |
| % from 52W Low | +27.90% |
| YTD High | $148.2160 |
| % from YTD High | -47.87% |
| YTD Low | $60.4147 |
| % from YTD Low | +27.90% |
📊 Market Commentary
Solana (SOL) is currently trading at $77.27, down 4.19% today, as the broader crypto market experiences a pullback. The Relative Strength Index (RSI) sits at 67.3, indicating that SOL is approaching overbought territory but still has room before hitting the traditional threshold of 70. Over the past 52 weeks, SOL has fluctuated between $60.41 and $198.04, reflecting significant volatility and a strong recovery from its lower bounds earlier this year.
Market sentiment around Solana remains cautiously optimistic, supported by its robust ecosystem growth, particularly in decentralized finance (DeFi) and non-fungible tokens (NFTs). However, traders are mindful of macroeconomic factors, including Bitcoin’s price movements and broader risk asset trends, which could influence SOL’s near-term trajectory. Key resistance levels to watch include the psychological $80 mark, followed by the $90 zone, where previous selling pressure has emerged. On the downside, immediate support lies near $75, with stronger defense expected around $70, a level that has historically attracted buying interest.
Traders are also monitoring network activity, including transaction volumes and developer engagement, as indicators of Solana’s fundamental health. While the RSI suggests some near-term consolidation may be needed, SOL’s performance remains tied to broader market dynamics. For now, the focus is on whether the $75 support holds or if further downside pressure emerges in line with the wider crypto market correction.
Market sentiment around Solana remains cautiously optimistic, supported by its robust ecosystem growth, particularly in decentralized finance (DeFi) and non-fungible tokens (NFTs). However, traders are mindful of macroeconomic factors, including Bitcoin’s price movements and broader risk asset trends, which could influence SOL’s near-term trajectory. Key resistance levels to watch include the psychological $80 mark, followed by the $90 zone, where previous selling pressure has emerged. On the downside, immediate support lies near $75, with stronger defense expected around $70, a level that has historically attracted buying interest.
Traders are also monitoring network activity, including transaction volumes and developer engagement, as indicators of Solana’s fundamental health. While the RSI suggests some near-term consolidation may be needed, SOL’s performance remains tied to broader market dynamics. For now, the focus is on whether the $75 support holds or if further downside pressure emerges in line with the wider crypto market correction.
Disclaimer
The content on MarketsFN.com is provided for educational and informational purposes only. It does not constitute financial advice or investment recommendations. All investments involve risk. Cryptocurrency markets are highly volatile. Past performance does not guarantee future results.