Solana Eyes Rebound as RSI Nears Oversold at $73.87
· Crypto · QuoteReporter
Solana Eyes Rebound as RSI Nears Oversold at $73.87
Solana (SOL/USD) | July 29, 2026 $73.8700 +0.23%
🔍 Technical Analysis
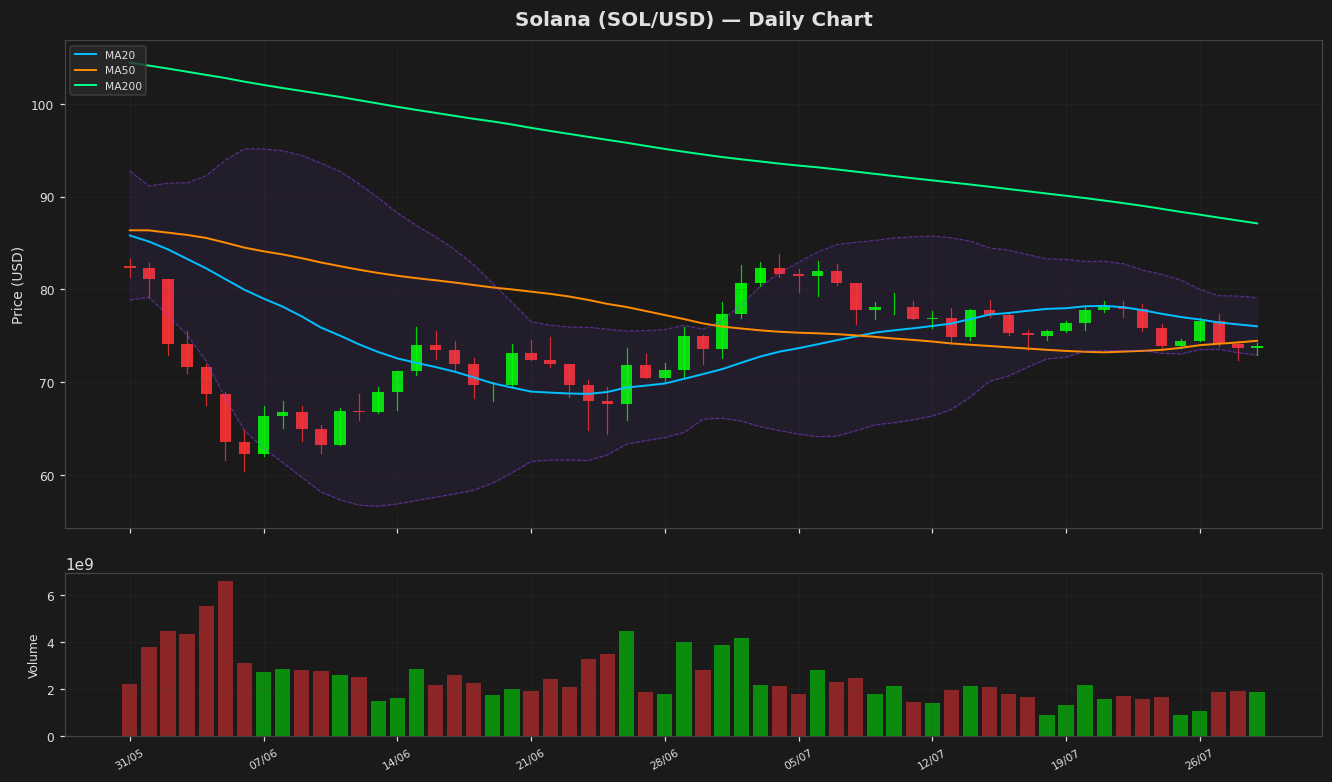
Solana (SOL) is currently trading at $73.87, showing a marginal daily gain of 0.23%. The price remains below key moving averages, indicating bearish pressure in the short to medium term. The MA20 at $76.00 and MA50 at $74.44 are acting as immediate resistance levels, while the MA200 at $87.11 highlights a longer-term downtrend. Bollinger Bands show a narrowing range, with the upper band at $79.10 and the lower band at $72.91, suggesting reduced volatility and potential consolidation. The price hovering near the lower band indicates oversold conditions, but a breakout above the middle band ($76.00) is needed to confirm bullish momentum.
The RSI(14) at 38.96 reflects neutral to slightly bearish sentiment, not yet reaching oversold territory. The MACD histogram at -0.44, below the signal line (-0.02), signals continued bearish momentum, though the narrowing gap suggests weakening downward pressure. Key support lies at the 52-week low of $60.41, while resistance is seen at the MA20 ($76.00) and the upper Bollinger Band ($79.10). ATR(14) at 2.04 indicates moderate volatility. Solana’s price action remains constrained within a tight range, requiring a decisive break above $76.00 or below $72.90 to determine the next directional move. The 52-week high at $148.22 underscores the significant downside from peak levels.
The RSI(14) at 38.96 reflects neutral to slightly bearish sentiment, not yet reaching oversold territory. The MACD histogram at -0.44, below the signal line (-0.02), signals continued bearish momentum, though the narrowing gap suggests weakening downward pressure. Key support lies at the 52-week low of $60.41, while resistance is seen at the MA20 ($76.00) and the upper Bollinger Band ($79.10). ATR(14) at 2.04 indicates moderate volatility. Solana’s price action remains constrained within a tight range, requiring a decisive break above $76.00 or below $72.90 to determine the next directional move. The 52-week high at $148.22 underscores the significant downside from peak levels.
Technical Metrics
| Metric | Value |
|---|---|
| Current Price | $73.8700 |
| Daily Change | +0.23% |
| MA 20 | $76.0020 |
| % from MA20 | -2.81% |
| MA 50 | $74.4398 |
| % from MA50 | -0.77% |
| MA 200 | $87.1052 |
| % from MA200 | -15.19% |
| BB Upper | $79.0990 |
| % from BB Upper | -6.61% |
| BB Lower | $72.9050 |
| % from BB Lower | +1.32% |
| RSI (14) | 38.96 |
| MACD | -0.444907 |
| MACD Signal | -0.017823 |
| ATR (14) | 2.036671 |
| 3-Day High | $77.3709 |
| 3-Day Low | $72.3793 |
| 52-Week High | $148.2160 |
| % from 52W High | -50.16% |
| 52-Week Low | $60.4147 |
| % from 52W Low | +22.27% |
| YTD High | $148.2160 |
| % from YTD High | -50.16% |
| YTD Low | $60.4147 |
| % from YTD Low | +22.27% |
📊 Market Commentary
Solana (SOL) is trading at $73.87, up 0.23% today, as the broader crypto market shows cautious optimism. The Relative Strength Index (RSI) at 39.0 suggests SOL is nearing oversold territory, potentially indicating a buildup of buying pressure if momentum shifts. Over the past 52 weeks, SOL has fluctuated between $60.41 and $148.22, reflecting significant volatility but maintaining a strong base above $60.
Market sentiment around Solana remains mixed. On one hand, the network’s high throughput and low transaction costs continue to attract developers and users, supporting its long-term value proposition. On the other hand, recent congestion issues and competition from other Layer 1 blockchains have weighed on investor confidence. Traders are closely monitoring whether SOL can hold above the psychological support level of $70, a zone that has historically acted as a springboard for recoveries.
Key resistance levels to watch include $80, a previous consolidation area, and $90, which could signal a stronger bullish reversal if breached. Conversely, a drop below $70 may trigger further downside toward the yearly low near $60. With the RSI below 40, some traders may view the current price as an accumulation opportunity, but broader market trends and network performance will likely dictate SOL’s near-term direction. Volume and on-chain activity remain critical metrics for assessing whether the current stabilization can evolve into a sustained rebound.
Market sentiment around Solana remains mixed. On one hand, the network’s high throughput and low transaction costs continue to attract developers and users, supporting its long-term value proposition. On the other hand, recent congestion issues and competition from other Layer 1 blockchains have weighed on investor confidence. Traders are closely monitoring whether SOL can hold above the psychological support level of $70, a zone that has historically acted as a springboard for recoveries.
Key resistance levels to watch include $80, a previous consolidation area, and $90, which could signal a stronger bullish reversal if breached. Conversely, a drop below $70 may trigger further downside toward the yearly low near $60. With the RSI below 40, some traders may view the current price as an accumulation opportunity, but broader market trends and network performance will likely dictate SOL’s near-term direction. Volume and on-chain activity remain critical metrics for assessing whether the current stabilization can evolve into a sustained rebound.
Disclaimer
The content on MarketsFN.com is provided for educational and informational purposes only. It does not constitute financial advice or investment recommendations. All investments involve risk. Cryptocurrency markets are highly volatile. Past performance does not guarantee future results.