Solana prueba los $77.50 mientras el RSI se acerca al punto medio, los bajistas ganan terreno.
· Crypto · Reporter España
Solana prueba los $77.50 mientras el RSI se acerca al punto medio, los bajistas ganan terreno.
Solana (SOL/USD) | July 23, 2026 $77.5000 -0.52%
🔍 Technical Analysis
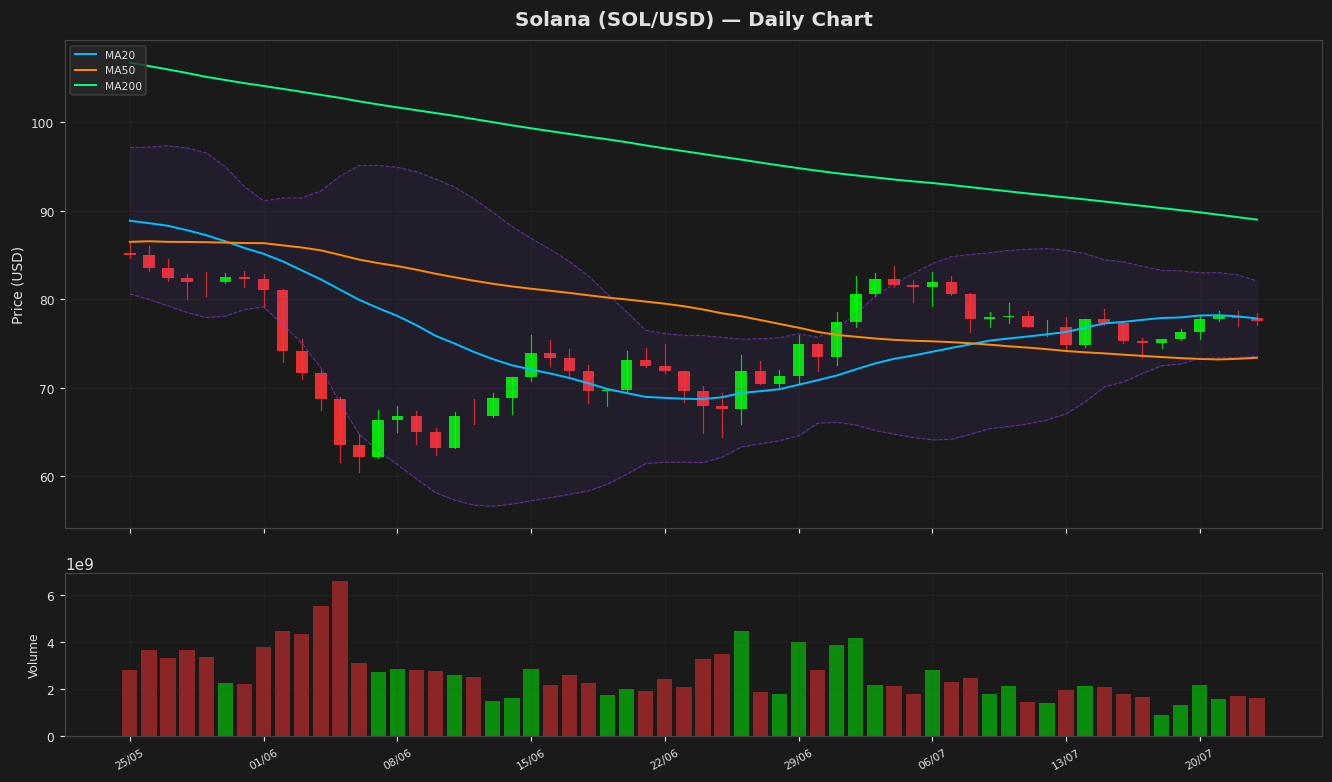
Solana (SOL) cotiza actualmente en $77.50, mostrando una leve caída diaria del 0.52%. La acción del precio se mantiene dentro de una fase de consolidación, rondando cerca de la media móvil de 20 días (MA20) en $77.83, que actúa como resistencia inmediata. La MA50 en $73.39 ofrece soporte dinámico, reflejando un cruce alcista por encima de la MA200 en $89.01, aunque la tendencia a largo plazo sigue siendo bajista ya que el precio opera por debajo de la MA200. Las Bandas de Bollinger indican una volatilidad moderada, con la banda superior en $82.08 y la banda inferior en $73.58, sugiriendo un movimiento lateral a menos que ocurra una ruptura. El RSI en 47.85 se mantiene neutral, ni sobrecomprado ni sobrevendido, mientras que el histograma MACD muestra un ligero impulso bajista, ya que la línea MACD (0.51) permanece por debajo de la línea de señal (0.59). El soporte clave se encuentra en $73.50 (MA50 y banda inferior de Bollinger), seguido del mínimo anual en $60.41. La resistencia se observa en $82.08 (banda superior de Bollinger) y el nivel psicológico de $90. El ATR en 2.05 confirma una volatilidad contenida. El precio de Solana se mantiene en una zona crítica; una ruptura por encima de la MA20 podría apuntar a $82, mientras que un fracaso podría llevar a retestar $73.50. El máximo de 52 semanas en $148.22 subraya un potencial alcista significativo si regresa el impulso positivo.
Technical Metrics
| Metric | Value |
|---|---|
| Current Price | $77.5000 |
| Daily Change | -0.52% |
| MA 20 | $77.8264 |
| % from MA20 | -0.42% |
| MA 50 | $73.3894 |
| % from MA50 | +5.60% |
| MA 200 | $89.0062 |
| % from MA200 | -12.93% |
| BB Upper | $82.0757 |
| % from BB Upper | -5.57% |
| BB Lower | $73.5771 |
| % from BB Lower | +5.33% |
| RSI (14) | 47.85 |
| MACD | 0.506744 |
| MACD Signal | 0.585894 |
| ATR (14) | 2.045939 |
| 3-Day High | $78.7260 |
| 3-Day Low | $76.9938 |
| 52-Week High | $148.2160 |
| % from 52W High | -47.71% |
| 52-Week Low | $60.4147 |
| % from 52W Low | +28.28% |
| YTD High | $148.2160 |
| % from YTD High | -47.71% |
| YTD Low | $60.4147 |
| % from YTD Low | +28.28% |
📊 Market Commentary
Solana (SOL) is currently trading at $77.50, down **0.52%** today, reflecting mixed sentiment in the broader crypto market. The **RSI at 47.8** suggests a neutral stance—neither overbought nor oversold—indicating balanced momentum. Over the past year, SOL has traded between **$60.41 and $148.21**, showing significant volatility but maintaining resilience above its yearly low.
### **Key Levels to Watch:**
- **Support:** $75 (psychological & technical level), followed by $70.
- **Resistance:** $80–$85 (previous rejection zone).
### **Market Sentiment & Catalysts:**
- **Neutral RSI** suggests consolidation, with neither bulls nor bears in clear control.
- **Ecosystem strength** (high-speed transactions, DEX volumes, NFT activity) remains a bullish factor.
- **Macro influences:** Bitcoin’s price action and overall risk appetite could impact SOL’s next move.
### **Short-Term Outlook:**
- If SOL holds **$75 support**, a retest of **$80–$85** is possible.
- A breakdown below **$70** could signal deeper correction.
Traders are watching for a breakout above resistance or a breakdown below support to gauge the next directional move. **Consolidation likely in the near term.**
### **Key Levels to Watch:**
- **Support:** $75 (psychological & technical level), followed by $70.
- **Resistance:** $80–$85 (previous rejection zone).
### **Market Sentiment & Catalysts:**
- **Neutral RSI** suggests consolidation, with neither bulls nor bears in clear control.
- **Ecosystem strength** (high-speed transactions, DEX volumes, NFT activity) remains a bullish factor.
- **Macro influences:** Bitcoin’s price action and overall risk appetite could impact SOL’s next move.
### **Short-Term Outlook:**
- If SOL holds **$75 support**, a retest of **$80–$85** is possible.
- A breakdown below **$70** could signal deeper correction.
Traders are watching for a breakout above resistance or a breakdown below support to gauge the next directional move. **Consolidation likely in the near term.**
Aviso Legal
El contenido de MarketsFN.com se proporciona únicamente con fines educativos e informativos. No constituye asesoramiento financiero. Los mercados de criptomonedas son altamente volátiles. Los rendimientos pasados no garantizan resultados futuros.