Solana prueba un soporte clave en $73 mientras el RSI se acerca a niveles de sobreventa
· Crypto · Reporter España
Solana prueba un soporte clave en $73 mientras el RSI se acerca a niveles de sobreventa
Solana (SOL/USD) | July 28, 2026 $73.2100 -1.26%
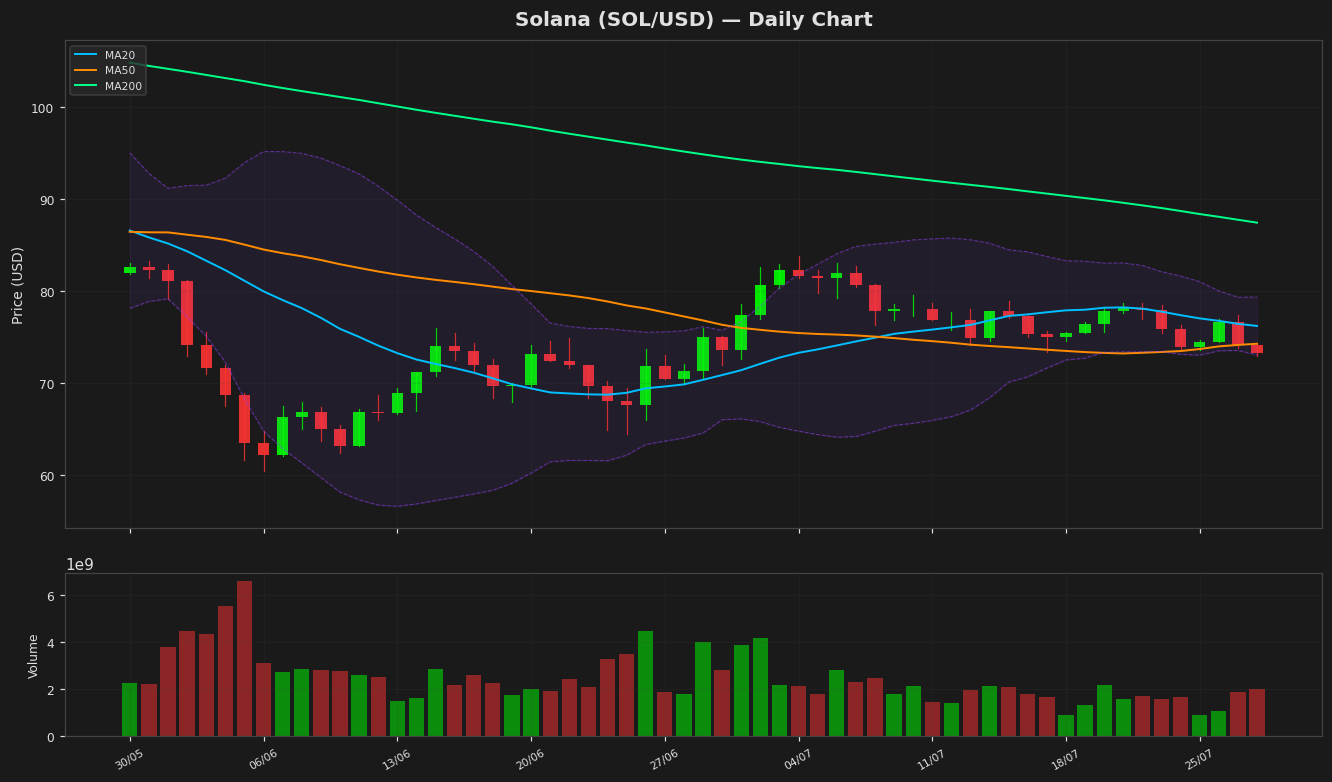
🔍 Technical Analysis
**Solana (SOL) Technical Analysis - Key Takeaways:**
### **Current Price:** $73.21 (-1.26% today)
**Market Sentiment:** **Bearish** (below all key moving averages)
### **Key Indicators:**
- **Moving Averages (Bearish Alignment):**
- 20-day MA: **$76.19** (resistance)
- 50-day MA: **$74.25** (near-term hurdle)
- 200-day MA: **$87.41** (major resistance)
- **Bollinger Bands:**
- Upper Band: **$79.33**
- Lower Band: **$73.04** (price near lower band, suggesting potential oversold conditions)
- **Narrowing bands** indicate reduced volatility and possible consolidation.
- **RSI:** **35.94** (approaching oversold but no reversal signal yet).
- **MACD:** Negative momentum (**-0.38** histogram, MACD line below signal line).
- **ATR (2.01):** Moderate volatility.
### **Support & Resistance Levels:**
- **Immediate Support:** **$73** (lower Bollinger Band) → Break below may test **$70** (psychological level).
- **Strong Support:** **$60.41** (yearly low).
- **Resistance Levels:**
- **$74.25 (50-day MA)** → First hurdle.
- **$76.19 (20-day MA)** → Key short-term resistance.
- **$87.41 (200-day MA)** → Major trend reversal level.
### **Price Outlook:**
- **Bearish Short-Term:** SOL remains under selling pressure; a break below **$73** could lead to a test of **$70**.
- **Potential Rebound Signal:** If SOL reclaims **$76.19 (20-day MA)**, short-term relief may follow.
- **Long-Term Downtrend:** Still far from **52-week high ($148.22)**, indicating significant bearish momentum.
### **Conclusion:**
SOL is in a **downtrend** with weak momentum. A sustained recovery requires breaking above **$76.19 (20-day MA)**. Until then, **$70–$73** remains a critical support zone.
**Watch for:**
- **RSI reversal (if it bounces from oversold).**
- **MACD crossover (bullish signal).**
- **Volume increase on a breakout above $76.**
**Risk:** Failure to hold **$70** could accelerate declines toward **$60.**
*(Not financial advice. DYOR.)* 🚀
### **Current Price:** $73.21 (-1.26% today)
**Market Sentiment:** **Bearish** (below all key moving averages)
### **Key Indicators:**
- **Moving Averages (Bearish Alignment):**
- 20-day MA: **$76.19** (resistance)
- 50-day MA: **$74.25** (near-term hurdle)
- 200-day MA: **$87.41** (major resistance)
- **Bollinger Bands:**
- Upper Band: **$79.33**
- Lower Band: **$73.04** (price near lower band, suggesting potential oversold conditions)
- **Narrowing bands** indicate reduced volatility and possible consolidation.
- **RSI:** **35.94** (approaching oversold but no reversal signal yet).
- **MACD:** Negative momentum (**-0.38** histogram, MACD line below signal line).
- **ATR (2.01):** Moderate volatility.
### **Support & Resistance Levels:**
- **Immediate Support:** **$73** (lower Bollinger Band) → Break below may test **$70** (psychological level).
- **Strong Support:** **$60.41** (yearly low).
- **Resistance Levels:**
- **$74.25 (50-day MA)** → First hurdle.
- **$76.19 (20-day MA)** → Key short-term resistance.
- **$87.41 (200-day MA)** → Major trend reversal level.
### **Price Outlook:**
- **Bearish Short-Term:** SOL remains under selling pressure; a break below **$73** could lead to a test of **$70**.
- **Potential Rebound Signal:** If SOL reclaims **$76.19 (20-day MA)**, short-term relief may follow.
- **Long-Term Downtrend:** Still far from **52-week high ($148.22)**, indicating significant bearish momentum.
### **Conclusion:**
SOL is in a **downtrend** with weak momentum. A sustained recovery requires breaking above **$76.19 (20-day MA)**. Until then, **$70–$73** remains a critical support zone.
**Watch for:**
- **RSI reversal (if it bounces from oversold).**
- **MACD crossover (bullish signal).**
- **Volume increase on a breakout above $76.**
**Risk:** Failure to hold **$70** could accelerate declines toward **$60.**
*(Not financial advice. DYOR.)* 🚀
Technical Metrics
| Metric | Value |
|---|---|
| Current Price | $73.2100 |
| Daily Change | -1.26% |
| MA 20 | $76.1863 |
| % from MA20 | -3.91% |
| MA 50 | $74.2518 |
| % from MA50 | -1.40% |
| MA 200 | $87.4120 |
| % from MA200 | -16.25% |
| BB Upper | $79.3320 |
| % from BB Upper | -7.72% |
| BB Lower | $73.0407 |
| % from BB Lower | +0.23% |
| RSI (14) | 35.94 |
| MACD | -0.375818 |
| MACD Signal | 0.081144 |
| ATR (14) | 2.014526 |
| 3-Day High | $77.3709 |
| 3-Day Low | $72.9685 |
| 52-Week High | $148.2160 |
| % from 52W High | -50.61% |
| 52-Week Low | $60.4147 |
| % from 52W Low | +21.18% |
| YTD High | $148.2160 |
| % from YTD High | -50.61% |
| YTD Low | $60.4147 |
| % from YTD Low | +21.18% |
📊 Market Commentary
**Solana (SOL) Price Analysis & Market Sentiment**
### **Current Price & Key Levels**
- **Price:** $73.21 (-1.26% today)
- **RSI:** 35.9 (approaching oversold, potential reversal signal)
- **52-Week Range:** $60.41 (low) to $148.22 (high)
- **Key Support:** $70 (critical psychological & technical level)
- **Key Resistance:** $80 (short-term), $90 (next hurdle)
### **Market Sentiment: Cautious but Not Bearish**
- **Downside Risk:** A break below $70 could trigger a drop toward $60 (yearly low).
- **Upside Potential:** Holding $70 may stabilize SOL, with a rebound toward $80–$90 if BTC/market sentiment improves.
- **Network Strength:** High developer activity & adoption provide fundamental support despite price weakness.
### **Macro & Crypto Market Influence**
- **Bitcoin Correlation:** SOL’s movement depends on BTC’s trend (if BTC stabilizes, SOL may recover).
- **Risk Appetite:** Traders remain cautious amid macroeconomic uncertainty (Fed policy, inflation, etc.).
- **Regulatory Watch:** Any crypto-related news (SEC, ETF approvals, etc.) could impact SOL.
### **Short-Term Outlook**
- **Neutral/Wait-and-See:** Traders await clearer signals before taking large positions.
- **Bullish Case:** If SOL holds $70 and BTC recovers, a bounce to $80–$90 is possible.
- **Bearish Case:** Breakdown below $70 could lead to a retest of $60.
### **Bottom Line**
SOL is in a consolidation phase near a critical support level. Watch **BTC’s price action** and **$70 support** for the next major move. A rebound above $80 could signal recovery, while a drop below $70 may extend the downtrend.
**Trade Plan:**
- **Longs:** Consider only if SOL holds $70 with RSI reversal confirmation.
- **Shorts:** High-risk below $70, targeting $65–$60.
- **Wait for Confirmation:** Better entries may appear after a clear breakout/breakdown.
*(DYOR—Market conditions can change rapidly!)* 🚀
### **Current Price & Key Levels**
- **Price:** $73.21 (-1.26% today)
- **RSI:** 35.9 (approaching oversold, potential reversal signal)
- **52-Week Range:** $60.41 (low) to $148.22 (high)
- **Key Support:** $70 (critical psychological & technical level)
- **Key Resistance:** $80 (short-term), $90 (next hurdle)
### **Market Sentiment: Cautious but Not Bearish**
- **Downside Risk:** A break below $70 could trigger a drop toward $60 (yearly low).
- **Upside Potential:** Holding $70 may stabilize SOL, with a rebound toward $80–$90 if BTC/market sentiment improves.
- **Network Strength:** High developer activity & adoption provide fundamental support despite price weakness.
### **Macro & Crypto Market Influence**
- **Bitcoin Correlation:** SOL’s movement depends on BTC’s trend (if BTC stabilizes, SOL may recover).
- **Risk Appetite:** Traders remain cautious amid macroeconomic uncertainty (Fed policy, inflation, etc.).
- **Regulatory Watch:** Any crypto-related news (SEC, ETF approvals, etc.) could impact SOL.
### **Short-Term Outlook**
- **Neutral/Wait-and-See:** Traders await clearer signals before taking large positions.
- **Bullish Case:** If SOL holds $70 and BTC recovers, a bounce to $80–$90 is possible.
- **Bearish Case:** Breakdown below $70 could lead to a retest of $60.
### **Bottom Line**
SOL is in a consolidation phase near a critical support level. Watch **BTC’s price action** and **$70 support** for the next major move. A rebound above $80 could signal recovery, while a drop below $70 may extend the downtrend.
**Trade Plan:**
- **Longs:** Consider only if SOL holds $70 with RSI reversal confirmation.
- **Shorts:** High-risk below $70, targeting $65–$60.
- **Wait for Confirmation:** Better entries may appear after a clear breakout/breakdown.
*(DYOR—Market conditions can change rapidly!)* 🚀
Aviso Legal
El contenido de MarketsFN.com se proporciona únicamente con fines educativos e informativos. No constituye asesoramiento financiero. Los mercados de criptomonedas son altamente volátiles. Los rendimientos pasados no garantizan resultados futuros.