Solana punta a $81,26 mentre l'RSI raggiunge 73,7 nonostante il calo
· Crypto · Reporter Italia
Solana punta a $81,26 mentre l'RSI raggiunge 73,7 nonostante il calo
Solana (SOL/USD) | July 07, 2026 $81.2600 -0.80%
🔍 Technical Analysis
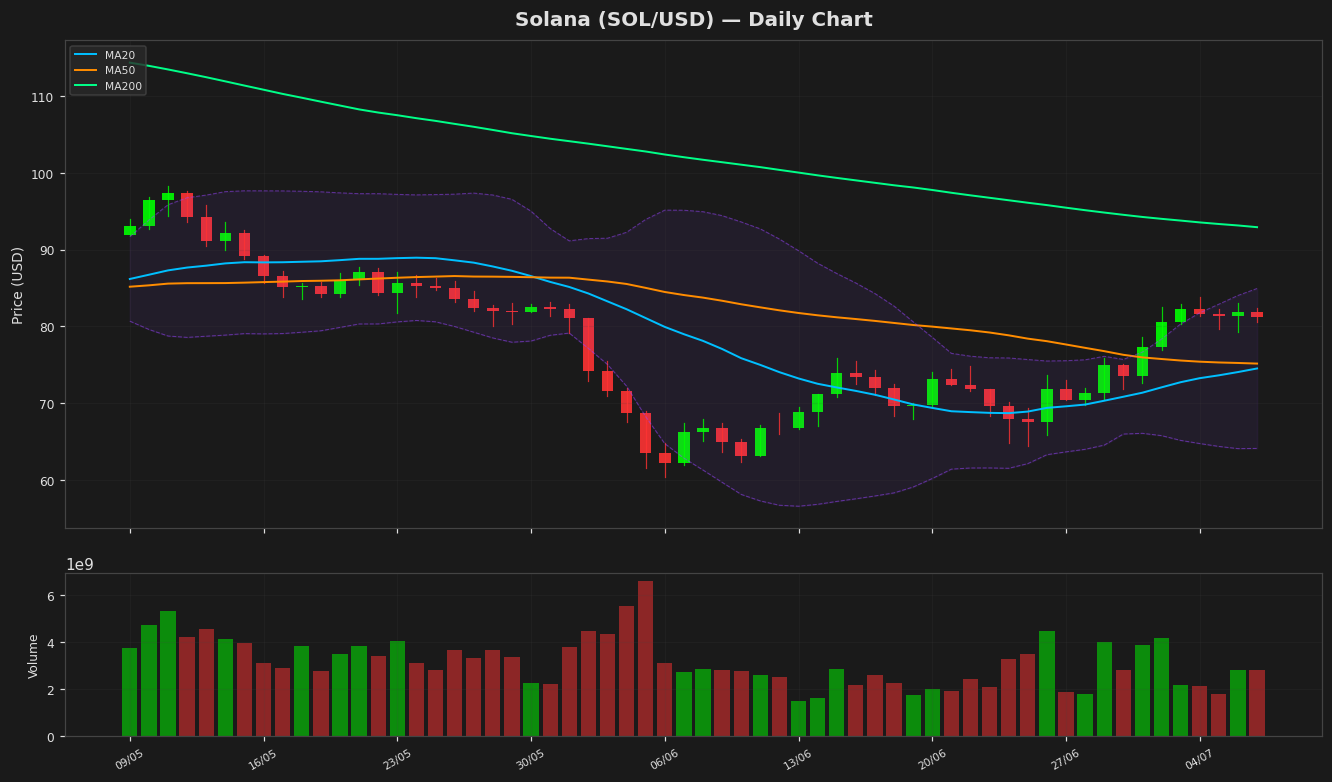
Solana (SOL) è attualmente scambiata a $81.26, in calo dello 0.80% nella giornata, mostrando una lieve pressione ribassista dopo i recenti guadagni. Il prezzo rimane al di sopra delle medie mobili chiave, con la media a 20 giorni a $74.53 e quella a 50 giorni a $75.17, indicando un momentum rialzista a breve termine. Tuttavia, la media a 200 giorni a $92.93 si trova sopra il prezzo attuale, suggerendo una resistenza a più lungo termine. Le Bande di Bollinger mostrano la banda superiore a $84.94 e quella inferiore a $64.12, con il prezzo che oscilla vicino al range superiore, segnalando potenziali condizioni di ipercomprato. L'RSI a 73.73 rafforza questo segnale, trovandosi in territorio di ipercomprato e suggerendo un possibile ritracciamento. L'istogramma MACD a 2.33 rimane sopra la linea del segnale a 1.05, supportando il momentum rialzista, sebbene possa emergere una divergenza se la pressione d'acquisto diminuisce. I livelli di supporto chiave sono $75 (media a 50 giorni) e $64 (banda inferiore di Bollinger), mentre la resistenza si trova a $84.94 (banda superiore di Bollinger) e $92.93 (media a 200 giorni). Il massimo degli ultimi 52 settimane a $201.68 e il massimo YTD a $148.22 evidenziano un significativo potenziale rialzista, ma SOL deve prima superare la resistenza a breve termine per sostenere il momentum ascendente. L'ATR a 4.03 suggerisce una volatilità moderata, tipica dell'azione dei prezzi di SOL.
Technical Metrics
| Metric | Value |
|---|---|
| Current Price | $81.2600 |
| Daily Change | -0.80% |
| MA 20 | $74.5316 |
| % from MA20 | +9.03% |
| MA 50 | $75.1677 |
| % from MA50 | +8.11% |
| MA 200 | $92.9275 |
| % from MA200 | -12.56% |
| BB Upper | $84.9428 |
| % from BB Upper | -4.34% |
| BB Lower | $64.1203 |
| % from BB Lower | +26.73% |
| RSI (14) | 73.73 |
| MACD | 2.326359 |
| MACD Signal | 1.048555 |
| ATR (14) | 4.035283 |
| 3-Day High | $83.0594 |
| 3-Day Low | $79.2205 |
| 52-Week High | $201.6774 |
| % from 52W High | -59.71% |
| 52-Week Low | $60.4147 |
| % from 52W Low | +34.50% |
| YTD High | $148.2160 |
| % from YTD High | -45.17% |
| YTD Low | $60.4147 |
| % from YTD Low | +34.50% |
📊 Market Commentary
Solana (SOL) is currently trading at **$81.26**, down **0.80%** today, as the broader crypto market shows mixed sentiment.
### **Key Technical Indicators:**
- **RSI (14): 73.7** – Approaching overbought territory, signaling potential consolidation or pullback if buying pressure weakens.
- **52-Week Range:** **$60.41 – $201.67**, reflecting high volatility and strong investor interest.
### **Market Sentiment:**
- **Cautiously Optimistic** – Supported by Solana’s fast transactions, growing DeFi & dApp ecosystem, and developer activity.
- **Watch for Overheating** – A sustained high RSI could precede a correction.
### **Key Levels to Watch:**
✅ **Resistance:**
- **$100** (Psychological barrier)
- Previous highs near **$120–$130**
✅ **Support:**
- **$75** (Immediate support)
- **$60–$65** (Strong historical demand zone)
### **Fundamental Drivers:**
- **Network Activity** (Transaction volume, developer engagement) will influence price.
- **Broader Market Trends** (BTC/ETH movements, macro conditions).
### **Short-Term Outlook:**
- **Neutral to Slightly Bullish**, but traders should monitor RSI for potential pullbacks.
- A break above **$85–$90** could fuel a run toward **$100**, while failure to hold **$75** may test lower support.
Would you like a deeper analysis on Solana’s on-chain metrics or DeFi trends? 🚀
### **Key Technical Indicators:**
- **RSI (14): 73.7** – Approaching overbought territory, signaling potential consolidation or pullback if buying pressure weakens.
- **52-Week Range:** **$60.41 – $201.67**, reflecting high volatility and strong investor interest.
### **Market Sentiment:**
- **Cautiously Optimistic** – Supported by Solana’s fast transactions, growing DeFi & dApp ecosystem, and developer activity.
- **Watch for Overheating** – A sustained high RSI could precede a correction.
### **Key Levels to Watch:**
✅ **Resistance:**
- **$100** (Psychological barrier)
- Previous highs near **$120–$130**
✅ **Support:**
- **$75** (Immediate support)
- **$60–$65** (Strong historical demand zone)
### **Fundamental Drivers:**
- **Network Activity** (Transaction volume, developer engagement) will influence price.
- **Broader Market Trends** (BTC/ETH movements, macro conditions).
### **Short-Term Outlook:**
- **Neutral to Slightly Bullish**, but traders should monitor RSI for potential pullbacks.
- A break above **$85–$90** could fuel a run toward **$100**, while failure to hold **$75** may test lower support.
Would you like a deeper analysis on Solana’s on-chain metrics or DeFi trends? 🚀
Disclaimer
I contenuti su MarketsFN.com sono forniti esclusivamente a scopo educativo e informativo. Non costituiscono consulenza finanziaria o raccomandazioni di investimento. I mercati delle criptovalute sono altamente volatili. I rendimenti passati non garantiscono risultati futuri.