Solana Tests Key Support at $73.58 as RSI Hovers Neutral
· Crypto · QuoteReporter
Solana Tests Key Support at $73.58 as RSI Hovers Neutral
Solana (SOL/USD) | June 30, 2026 $73.5800 -1.82%
🔍 Technical Analysis
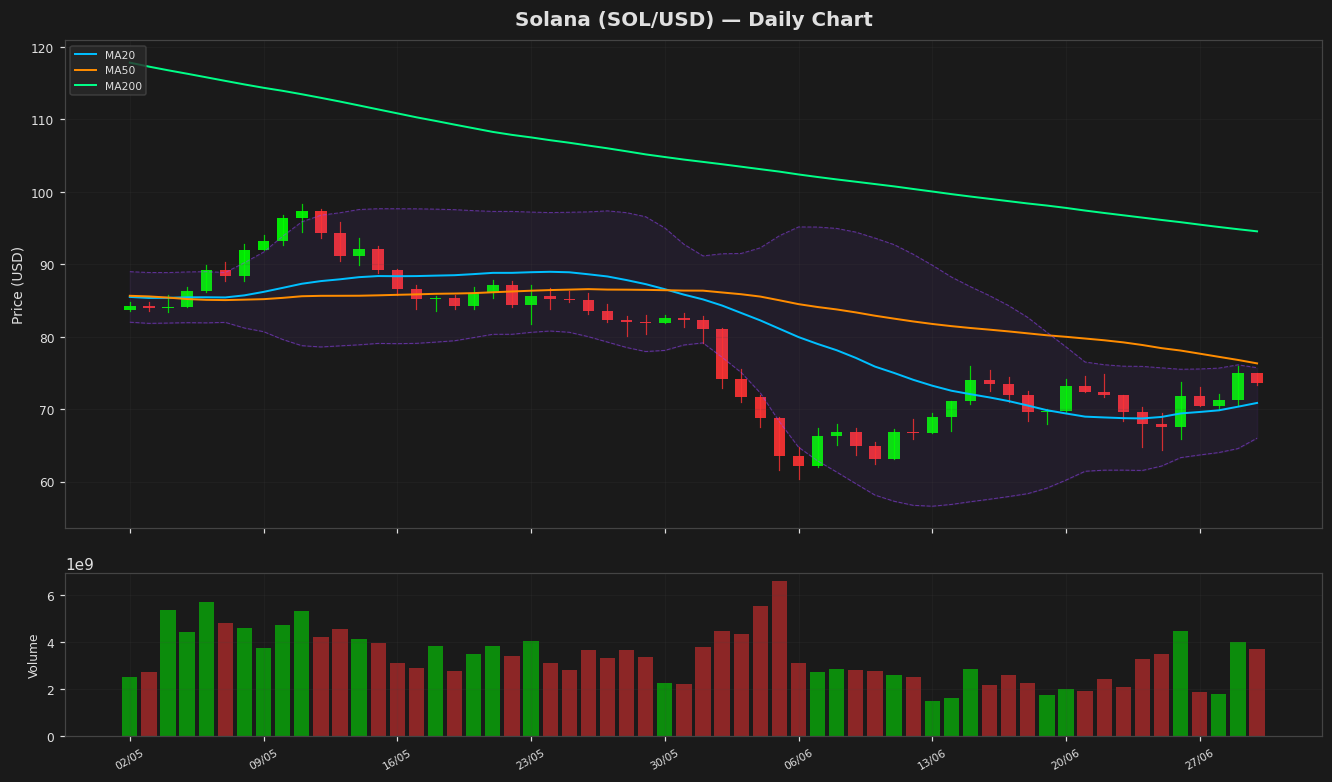
Solana (SOL) is currently trading at $73.58, down 1.82% on the day, showing mild bearish pressure after recent consolidation. The price remains above the 20-day moving average (MA20) at $70.85, indicating short-term bullish support, but below the 50-day MA ($76.31) and 200-day MA ($94.54), reflecting lingering mid-to-long-term bearish sentiment. Bollinger Bands show a narrowing range, with the upper band at $75.72 and the lower band at $65.99, suggesting reduced volatility and potential for a breakout. The RSI at 50.34 is neutral, neither overbought nor oversold, leaving room for directional momentum. The MACD histogram is at -0.62, below the signal line (-1.49), indicating weak bearish momentum but potential for a bullish crossover if buying pressure increases. Key support lies at $70.85 (MA20) and $65.99 (lower Bollinger Band), while resistance is at $75.72 (upper Bollinger Band) and $76.31 (MA50). A break above $76.31 could target $94.54 (MA200), while a drop below $65.99 may test the yearly low of $60.41. The ATR of 3.82 suggests moderate volatility, warranting caution in near-term trades. Solana remains in a broader downtrend from its 52-week high of $205.02, requiring sustained bullish momentum to reverse the trend.
Technical Metrics
| Metric | Value |
|---|---|
| Current Price | $73.5800 |
| Daily Change | -1.82% |
| MA 20 | $70.8533 |
| % from MA20 | +3.85% |
| MA 50 | $76.3122 |
| % from MA50 | -3.58% |
| MA 200 | $94.5381 |
| % from MA200 | -22.17% |
| BB Upper | $75.7168 |
| % from BB Upper | -2.82% |
| BB Lower | $65.9898 |
| % from BB Lower | +11.50% |
| RSI (14) | 50.34 |
| MACD | -0.621149 |
| MACD Signal | -1.490141 |
| ATR (14) | 3.817962 |
| 3-Day High | $75.9202 |
| 3-Day Low | $69.8388 |
| 52-Week High | $205.0201 |
| % from 52W High | -64.11% |
| 52-Week Low | $60.4147 |
| % from 52W Low | +21.79% |
| YTD High | $148.2160 |
| % from YTD High | -50.36% |
| YTD Low | $60.4147 |
| % from YTD Low | +21.79% |
📊 Market Commentary
Solana (SOL) is currently trading at $73.58, down 1.82% today, as the broader crypto market shows mixed sentiment. The Relative Strength Index (RSI) at 50.3 indicates neutral momentum, neither overbought nor oversold, suggesting a balanced tug-of-war between buyers and sellers. Over the past 52 weeks, SOL has seen significant volatility, ranging from a low of $60.41 to a high of $205.02, reflecting both the asset's potential and its susceptibility to market swings.
Market sentiment around Solana remains cautiously optimistic, supported by its strong ecosystem growth, particularly in decentralized applications (dApps) and decentralized finance (DeFi). However, recent network congestion issues and occasional outages have weighed on trader confidence, contributing to the current price consolidation. Traders are closely watching key support levels near $70, a psychological and technical floor that, if broken, could signal further downside toward the yearly low. On the upside, resistance around $80 remains a critical hurdle; a sustained break above this level may reignite bullish momentum.
Volume trends and institutional interest are also in focus, as Solana continues to attract attention as a high-performance blockchain competitor to Ethereum. With the RSI hovering near the midpoint, traders are awaiting clearer signals from either a breakout or breakdown of the current range. Macro factors, including Bitcoin's price action and broader risk appetite, will likely influence SOL's near-term direction.
Disclaimer
The content on MarketsFN.com is provided for educational and informational purposes only. It does not constitute financial advice or investment recommendations. All investments involve risk. Cryptocurrency markets are highly volatile. Past performance does not guarantee future results.