Solana Tests Key Support at $76 as RSI Nears Oversold
· Crypto · QuoteReporter
Solana Tests Key Support at $76 as RSI Nears Oversold
Solana (SOL/USD) | July 16, 2026 $76.1200 -1.48%
🔍 Technical Analysis
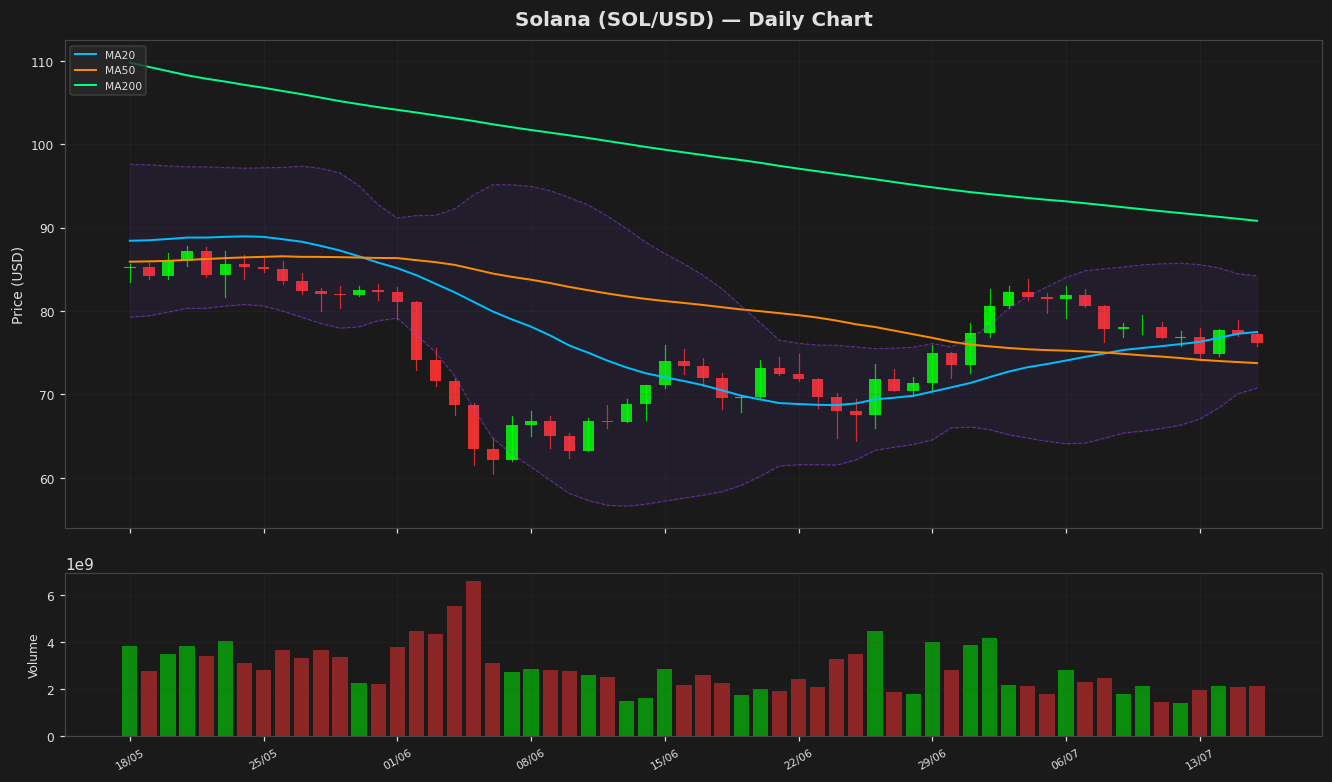
Solana (SOL) is currently trading at $76.12, down 1.48% on the day, showing mild bearish pressure amid broader market conditions. The price is hovering below the 20-day moving average (MA20) at $77.48, suggesting short-term weakness, but remains above the 50-day MA ($73.75), indicating mid-term support. The 200-day MA at $90.81 acts as a key resistance level, highlighting the broader downtrend from higher valuations. Bollinger Bands show a narrowing range, with the upper band at $84.23 and the lower band at $70.74, signaling reduced volatility and potential consolidation. The RSI at 35.15 reflects oversold conditions, which could precede a rebound if buying pressure returns. The MACD histogram is negative (-0.377), with the MACD line below the signal line, reinforcing short-term bearish momentum. Key support lies near $70.74 (Bollinger Lower Band) and the psychological $70 level, while resistance is found at $77.48 (MA20) and $84.23 (Bollinger Upper Band). The 52-week high of $171.60 and YTD high of $148.21 underscore the significant downside from peak levels, while the 52-week low of $60.41 remains a critical long-term floor. Traders should watch for a breakout above MA20 or a breakdown below $70 for directional cues.
Technical Metrics
| Metric | Value |
|---|---|
| Current Price | $76.1200 |
| Daily Change | -1.48% |
| MA 20 | $77.4872 |
| % from MA20 | -1.76% |
| MA 50 | $73.7558 |
| % from MA50 | +3.21% |
| MA 200 | $90.8129 |
| % from MA200 | -16.18% |
| BB Upper | $84.2333 |
| % from BB Upper | -9.63% |
| BB Lower | $70.7410 |
| % from BB Lower | +7.60% |
| RSI (14) | 35.16 |
| MACD | 0.749353 |
| MACD Signal | 1.126456 |
| ATR (14) | 2.596518 |
| 3-Day High | $78.8773 |
| 3-Day Low | $74.5509 |
| 52-Week High | $171.6073 |
| % from 52W High | -55.64% |
| 52-Week Low | $60.4147 |
| % from 52W Low | +26.00% |
| YTD High | $148.2160 |
| % from YTD High | -48.64% |
| YTD Low | $60.4147 |
| % from YTD Low | +26.00% |
📊 Market Commentary
Solana (SOL) is currently trading at $76.12, down 1.48% today, as the broader crypto market experiences subdued activity. The Relative Strength Index (RSI) at 35.2 suggests SOL is nearing oversold territory, which could attract bargain hunters if selling pressure eases. However, market sentiment remains cautious, with traders closely monitoring macroeconomic factors and Bitcoin’s price action for directional cues.
SOL’s 52-week range of $60.41 to $171.61 highlights its volatility, with the current price sitting closer to the lower bound. Key support levels to watch include the psychological $70 mark and the yearly low near $60, which could act as a strong floor if tested. On the upside, resistance is seen around $80, followed by $90, where previous buying interest has stalled.
Traders are also keeping an eye on network activity, including transaction volumes and developer engagement, as Solana’s ecosystem growth remains a critical driver of long-term demand. Recent outages and congestion issues have weighed on sentiment, but improvements in network stability could restore confidence. Additionally, institutional interest, such as ETF-related developments, may influence SOL’s price trajectory in the coming weeks. For now, the market appears to be in a consolidation phase, awaiting clearer signals before the next decisive move.
SOL’s 52-week range of $60.41 to $171.61 highlights its volatility, with the current price sitting closer to the lower bound. Key support levels to watch include the psychological $70 mark and the yearly low near $60, which could act as a strong floor if tested. On the upside, resistance is seen around $80, followed by $90, where previous buying interest has stalled.
Traders are also keeping an eye on network activity, including transaction volumes and developer engagement, as Solana’s ecosystem growth remains a critical driver of long-term demand. Recent outages and congestion issues have weighed on sentiment, but improvements in network stability could restore confidence. Additionally, institutional interest, such as ETF-related developments, may influence SOL’s price trajectory in the coming weeks. For now, the market appears to be in a consolidation phase, awaiting clearer signals before the next decisive move.
Disclaimer
The content on MarketsFN.com is provided for educational and informational purposes only. It does not constitute financial advice or investment recommendations. All investments involve risk. Cryptocurrency markets are highly volatile. Past performance does not guarantee future results.