S&P 500 Bull & Bear Radar — June 05, 2026
· Stocks · QuoteReporter
S&P 500 Bull & Bear Radar — June 05, 2026
A daily technical sweep of 496 S&P 500 constituents ranked by session performance, enriched with RSI, MA20/MA50/MA200 trend signals, Bloomberg-style charts, and recent news.
Index-Wide Breadth
| Constituents tracked | 496 |
| Advancing | 249 (50.2%) |
| Declining | 243 (49.0%) |
| Average daily change | 0.31% |
| Above MA200 | 13 (2.6%) |
Top 10 Gainers
Today's strongest S&P 500 performers. Sector leadership: Healthcare (4), Financial (2), Consumer Defensive (2), Consumer Cyclical (1), Real Estate (1).
| Ticker | Company | Sector | Price | Day % | 1W % | 1M % | RSI | vs MA200 | Trend |
|---|---|---|---|---|---|---|---|---|---|
| COO | Cooper Companies, Inc | Healthcare | $65.94 | +6.32% | +7.61% | +7.77% | 62.7 | -9.5% | Above MA20, MA50 · Below MA200 |
| CMG | Chipotle Mexican Grill | Consumer Cyclical | $29.80 | +5.73% | -6.54% | -9.06% | 38.3 | -18.0% | Below MA20, MA50, MA200 |
| PODD | Insulet Corporation | Healthcare | $151.71 | +3.62% | +4.93% | +0.54% | 44.1 | -42.7% | Above MA20 · Below MA50, MA200 |
| INCY | Incyte Corp | Healthcare | $104.35 | +3.07% | +7.86% | +4.50% | 65.7 | +8.7% | Above MA20, MA50, MA200 |
| UHS | Universal Health Services, Inc | Healthcare | $146.77 | +2.84% | +0.57% | -12.79% | 32.6 | -26.5% | Below MA20, MA50, MA200 |
| ALL | Allstate Corp | Financial | $216.60 | +2.73% | +5.10% | -0.61% | 55.1 | +4.7% | Above MA20, MA50, MA200 |
| KO | Coca-Cola Co | Consumer Defensive | $78.90 | +2.71% | -0.05% | -0.33% | 49.3 | +7.8% | Above MA50, MA200 · Below MA20 |
| KR | Kroger Co | Consumer Defensive | $63.91 | +2.68% | +2.78% | -3.23% | 44.8 | -4.3% | Below MA20, MA50, MA200 |
| PGR | Progressive Corp | Financial | $200.57 | +2.66% | +5.37% | +1.94% | 54.2 | -7.4% | Above MA20, MA50 · Below MA200 |
| WELL | Welltower Inc | Real Estate | $206.03 | +2.58% | +0.36% | -4.81% | 46.3 | +6.8% | Above MA200 · Below MA20, MA50 |
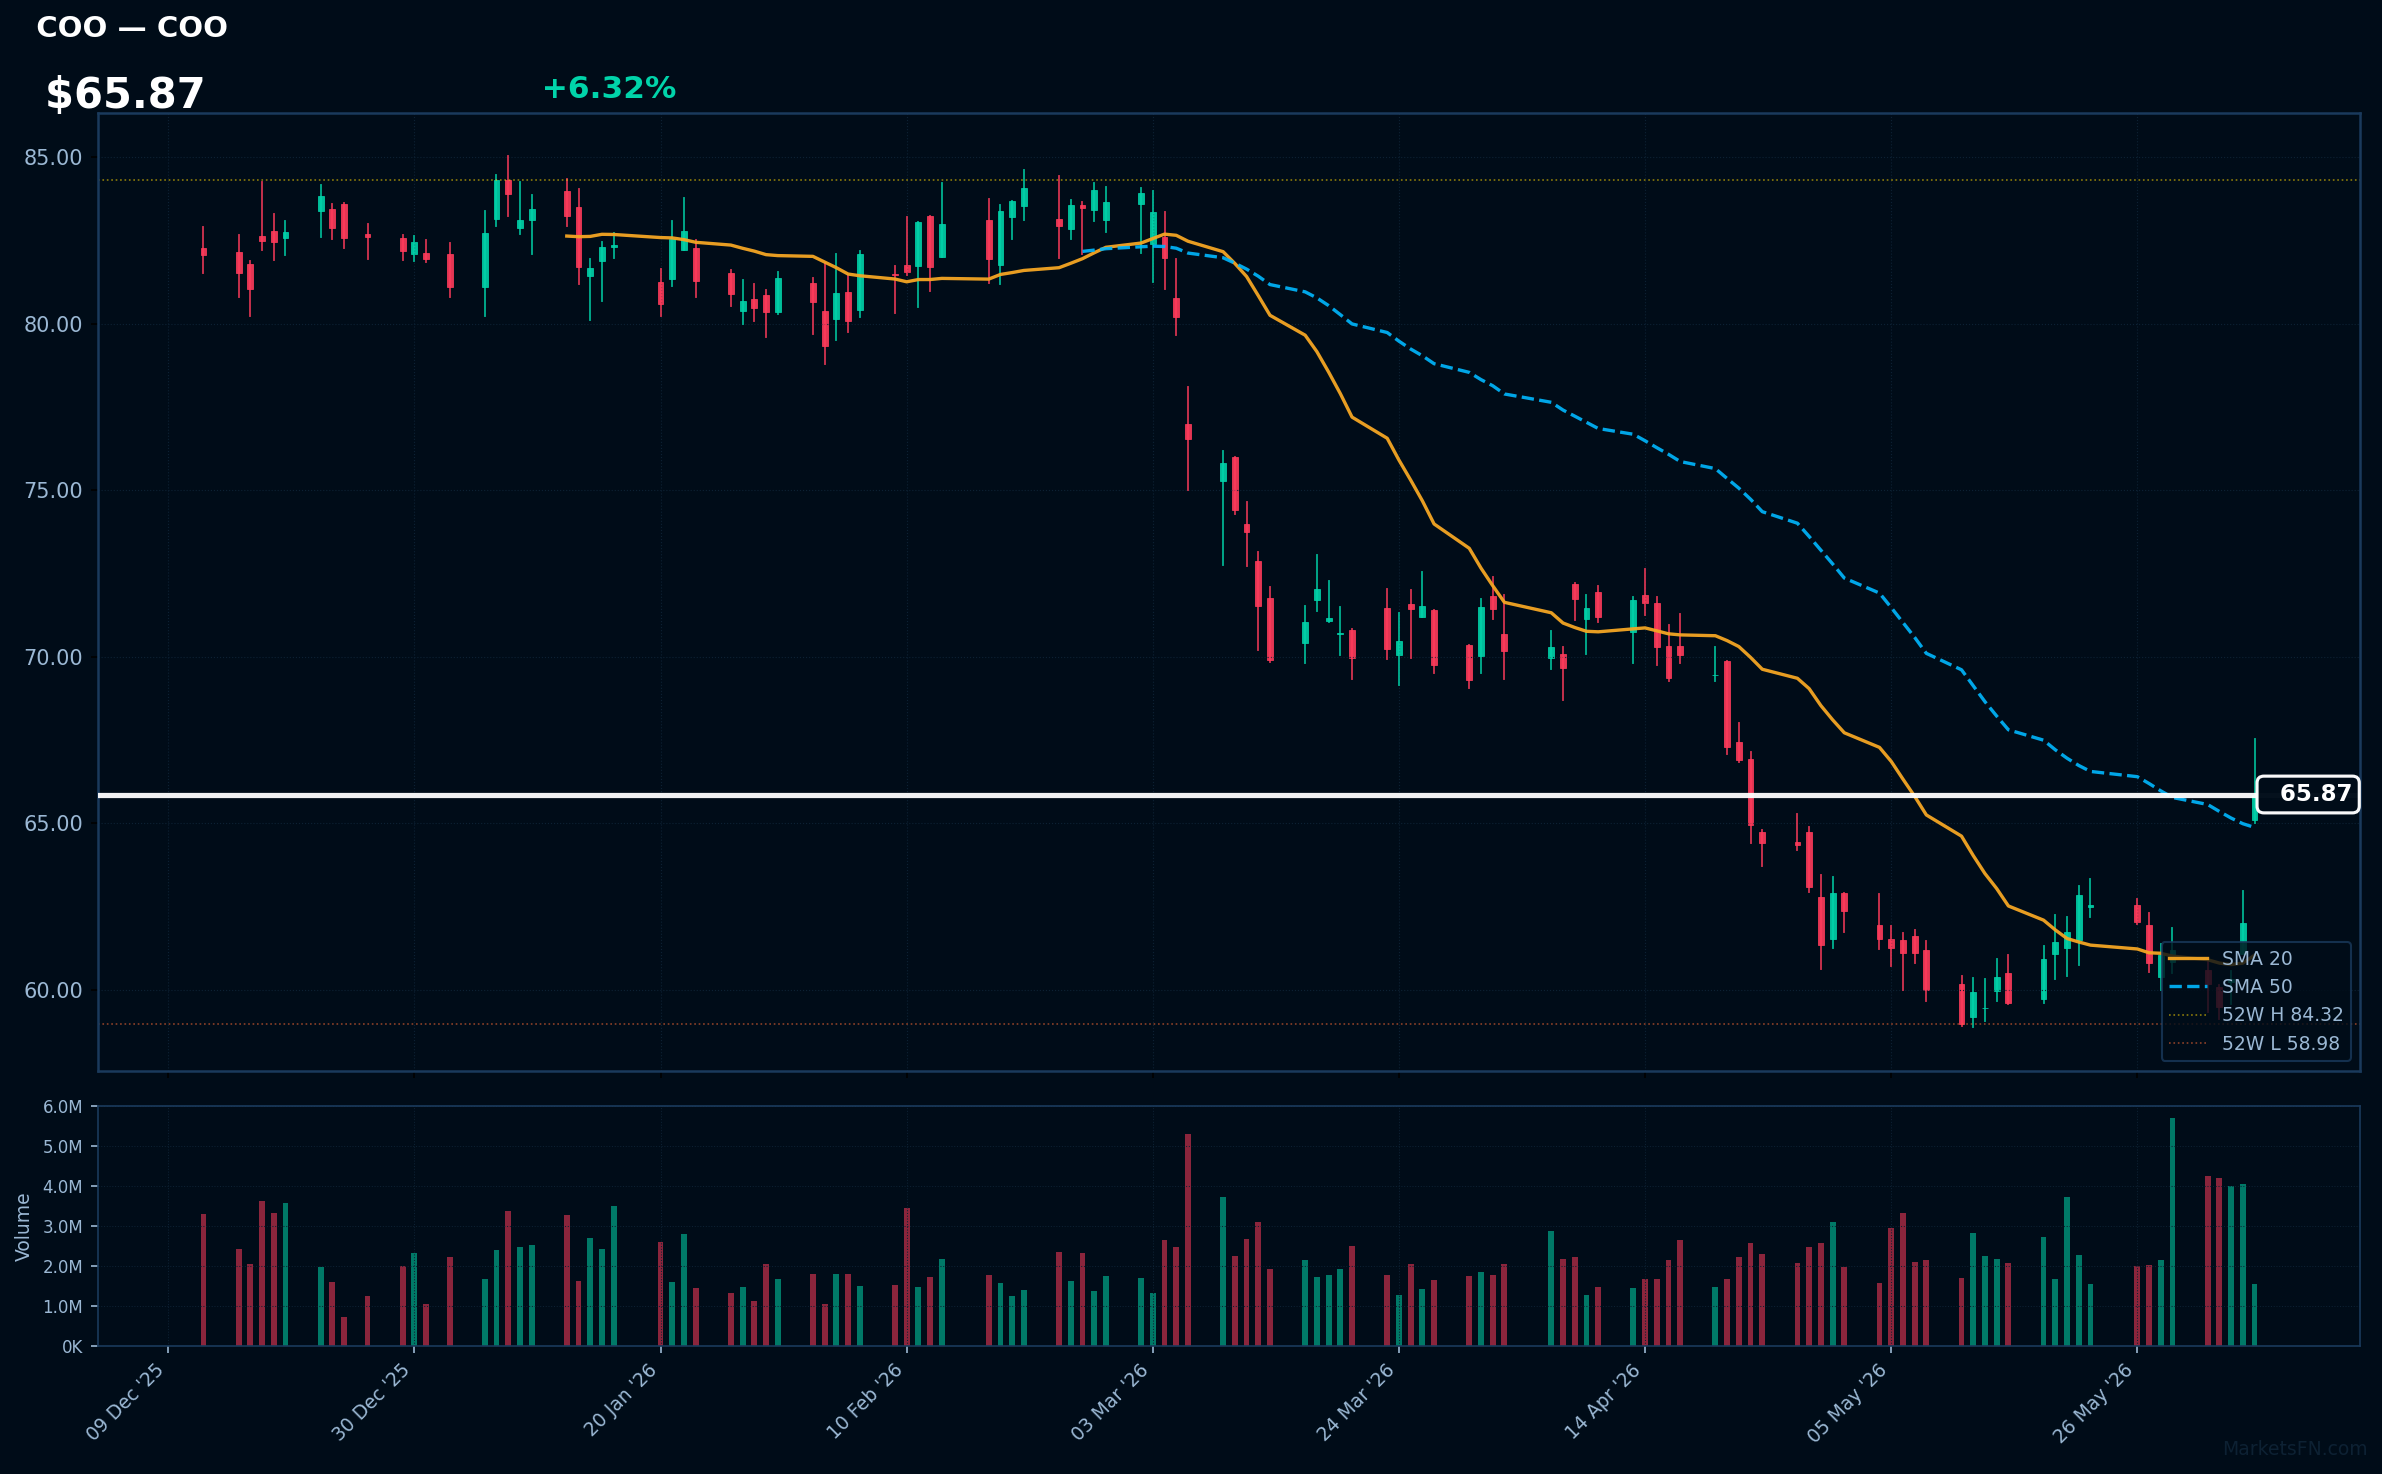
COO | Cooper Companies, Inc | Healthcare | Price: $65.94 | Day: +6.32% | 1W: +7.61% | 1M: +7.77% | RSI: 62.7 | vs MA200: -9.5% | Trend: Above MA20, MA50 · Below MA200
Recent headlines (last 12h)
- The Cooper Companies Inc (COO) Q2 2026 Earnings Call Highlights: Record Revenue and Strategic ...
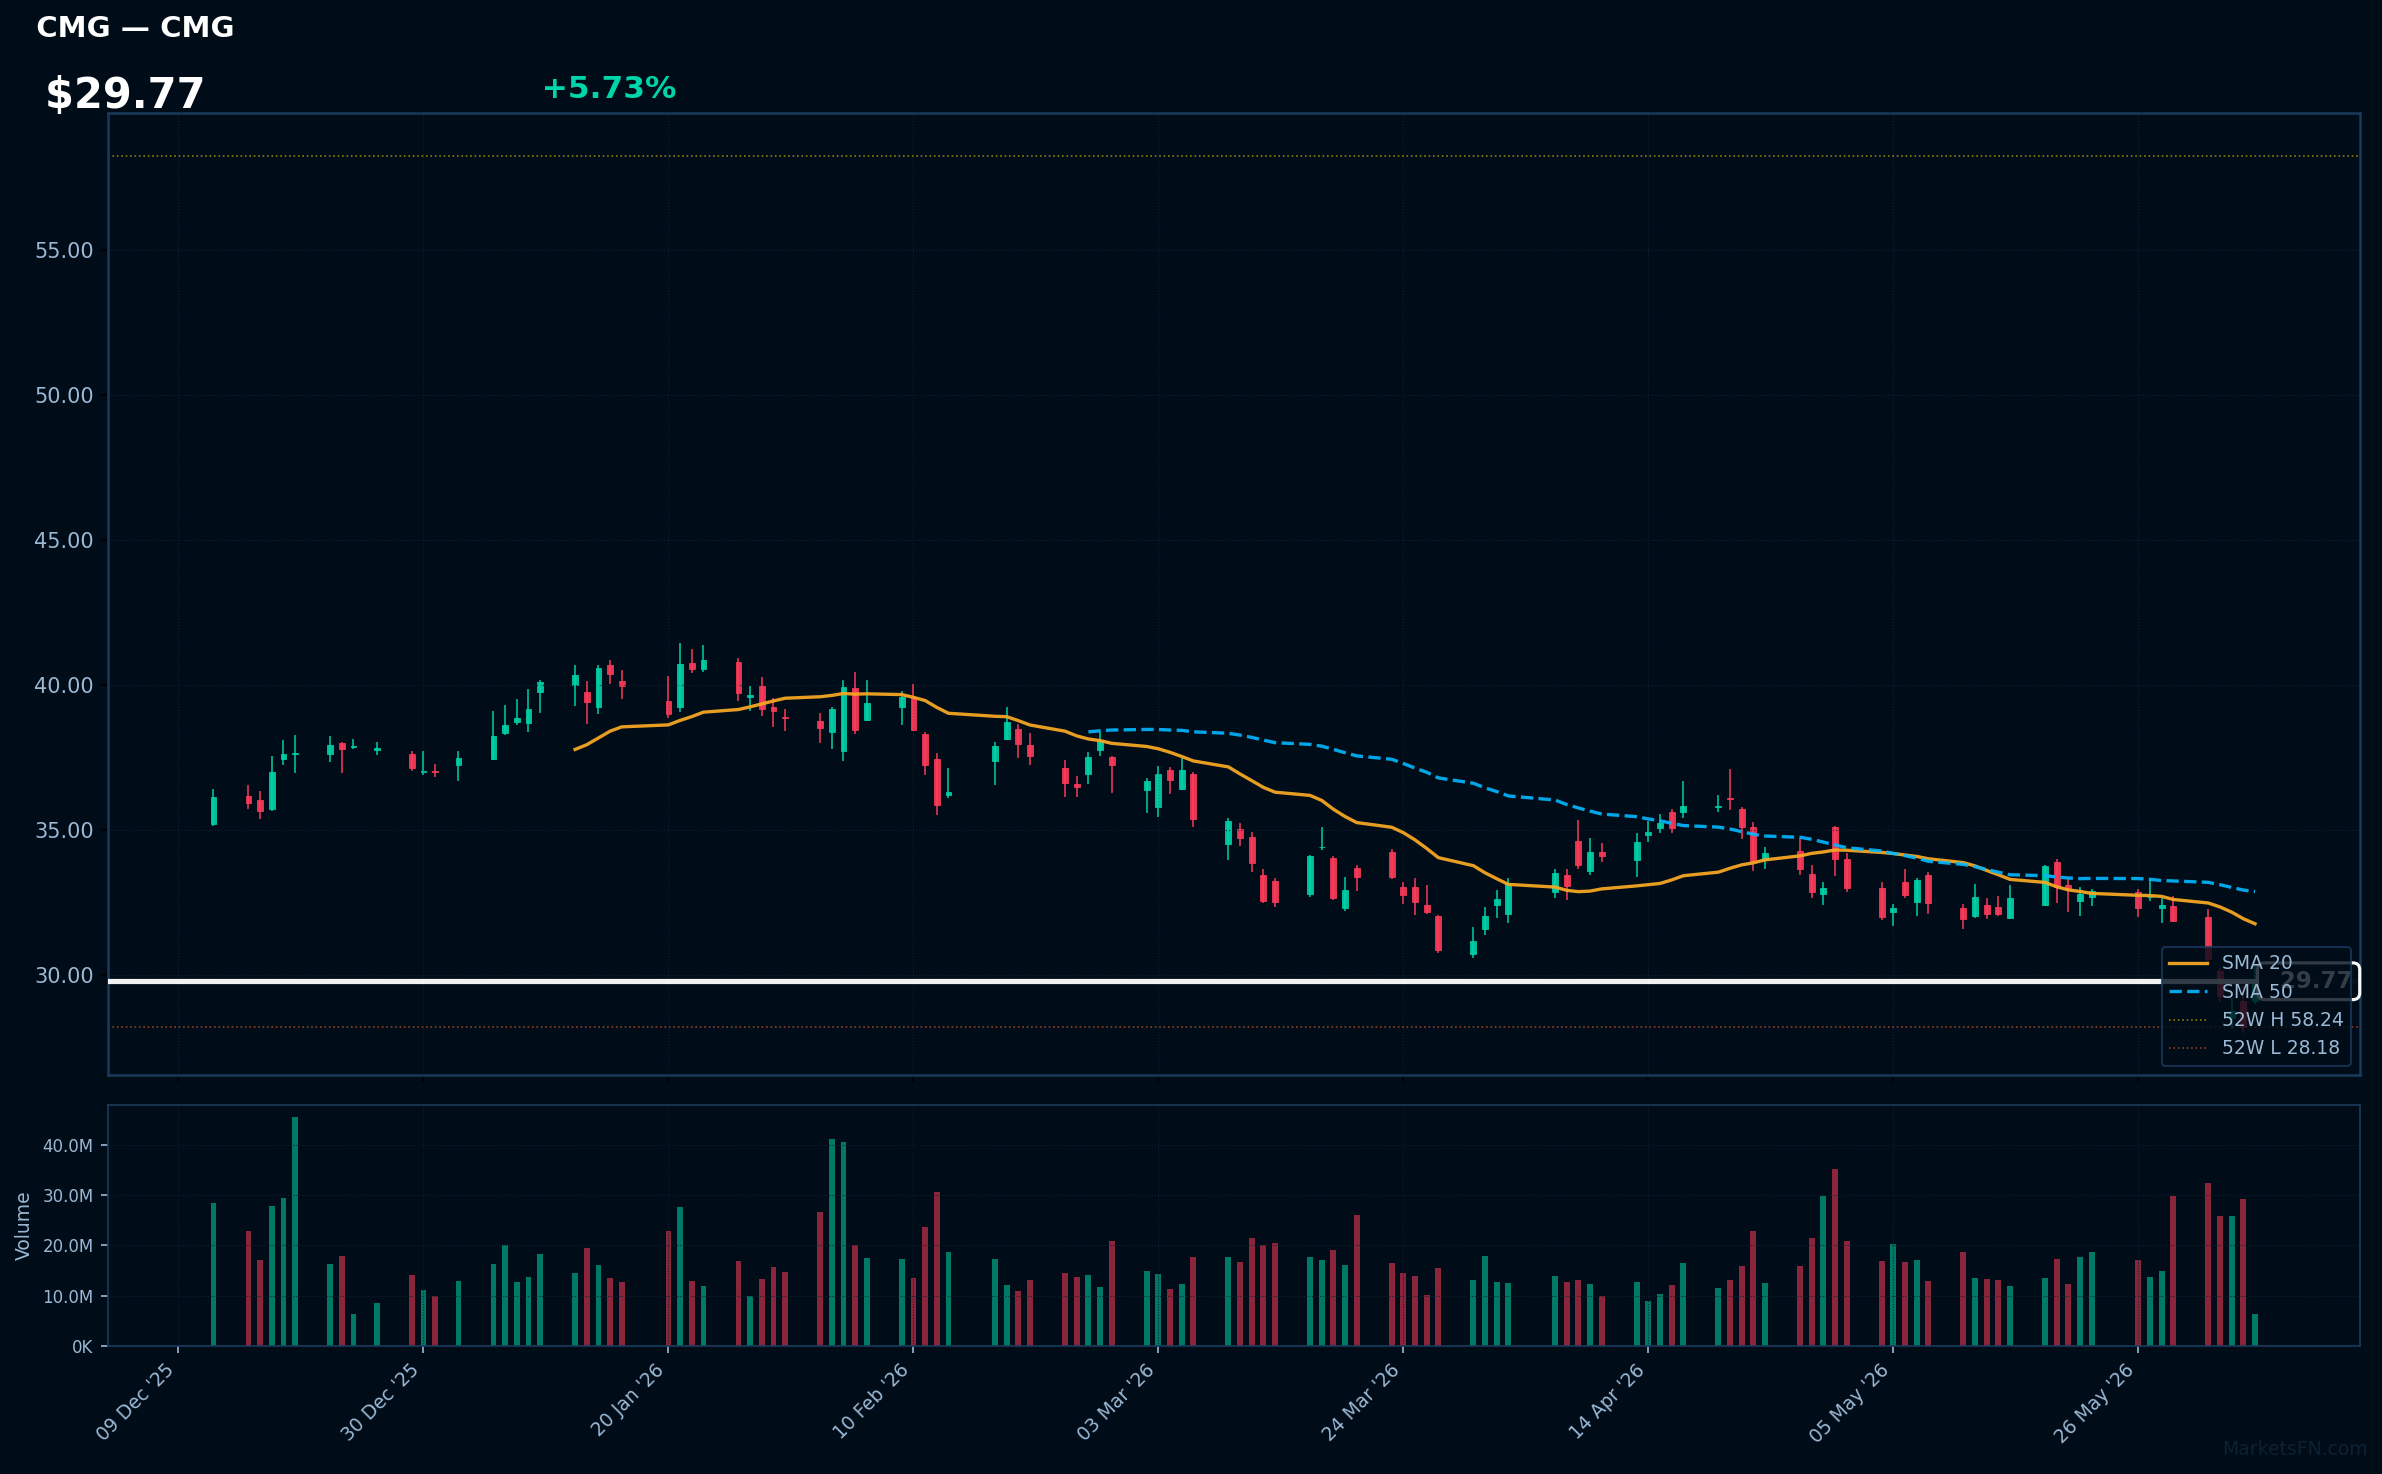
CMG | Chipotle Mexican Grill | Consumer Cyclical | Price: $29.80 | Day: +5.73% | 1W: -6.54% | 1M: -9.06% | RSI: 38.3 | vs MA200: -18.0% | Trend: Below MA20, MA50, MA200
Recent headlines (last 12h)
- Chipotle Stock Upgraded After 3-Year Lows
- AT&T, CMCSA, CMG Hit 52-Week Lows: What Dragged These Stocks Lower?
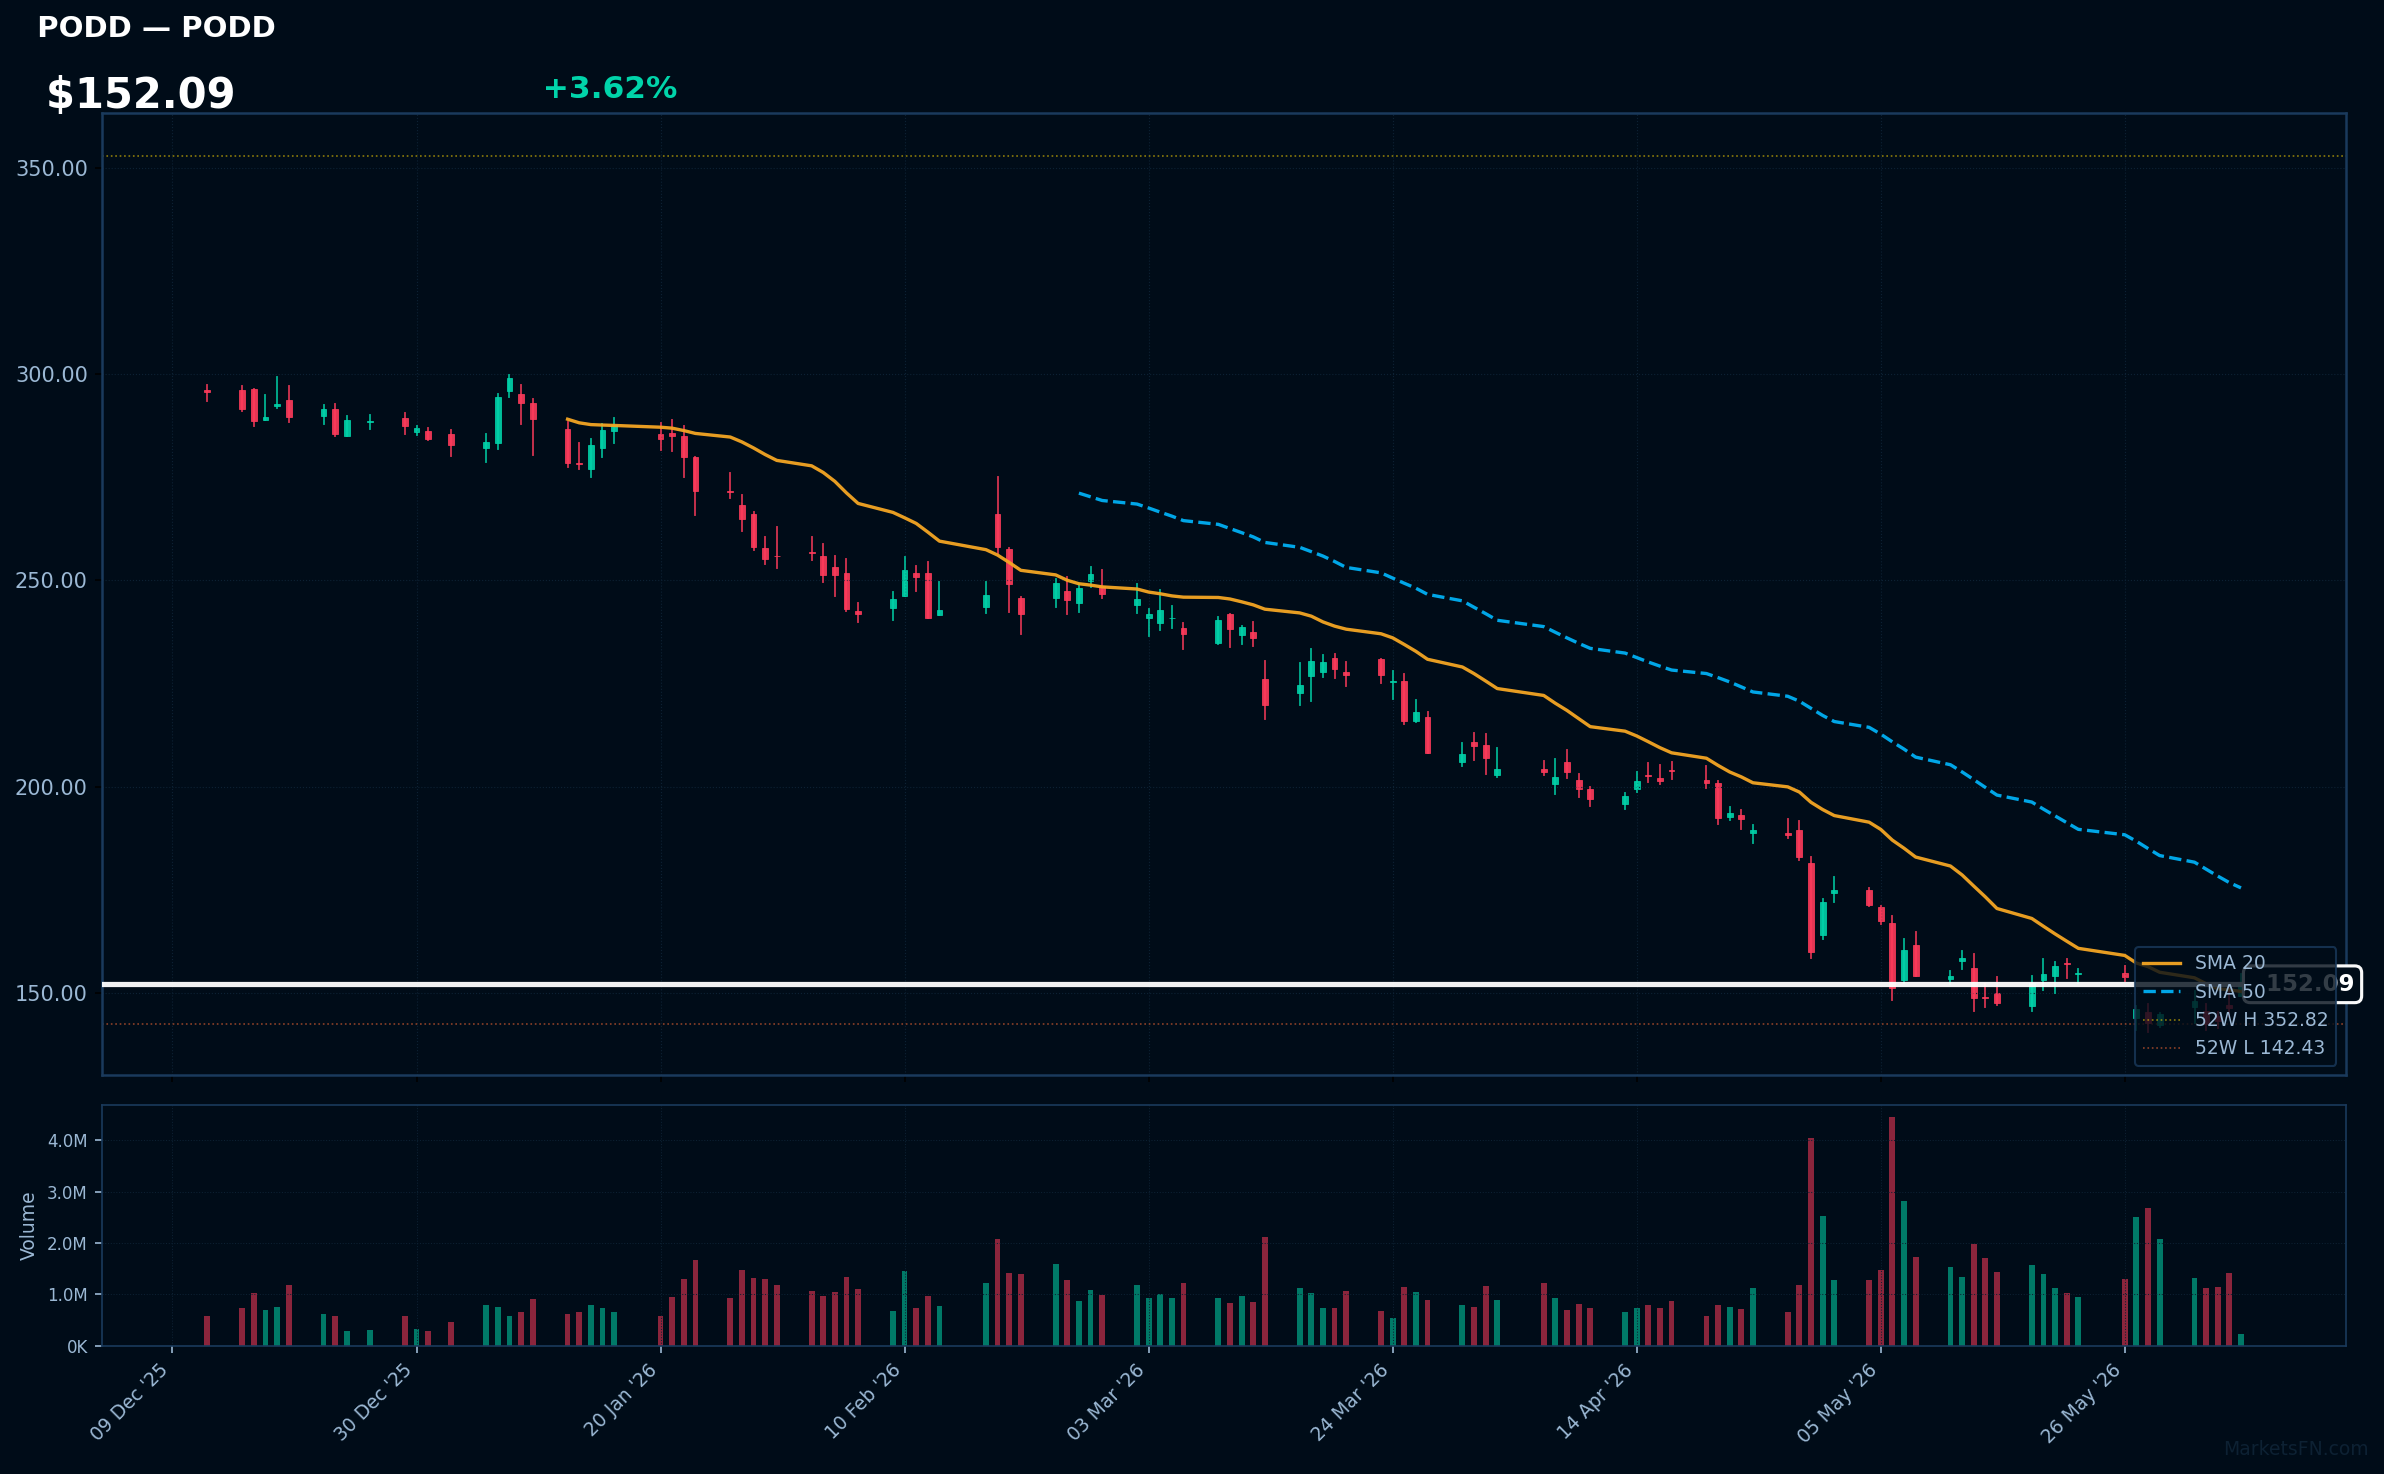
PODD | Insulet Corporation | Healthcare | Price: $151.71 | Day: +3.62% | 1W: +4.93% | 1M: +0.54% | RSI: 44.1 | vs MA200: -42.7% | Trend: Above MA20 · Below MA50, MA200
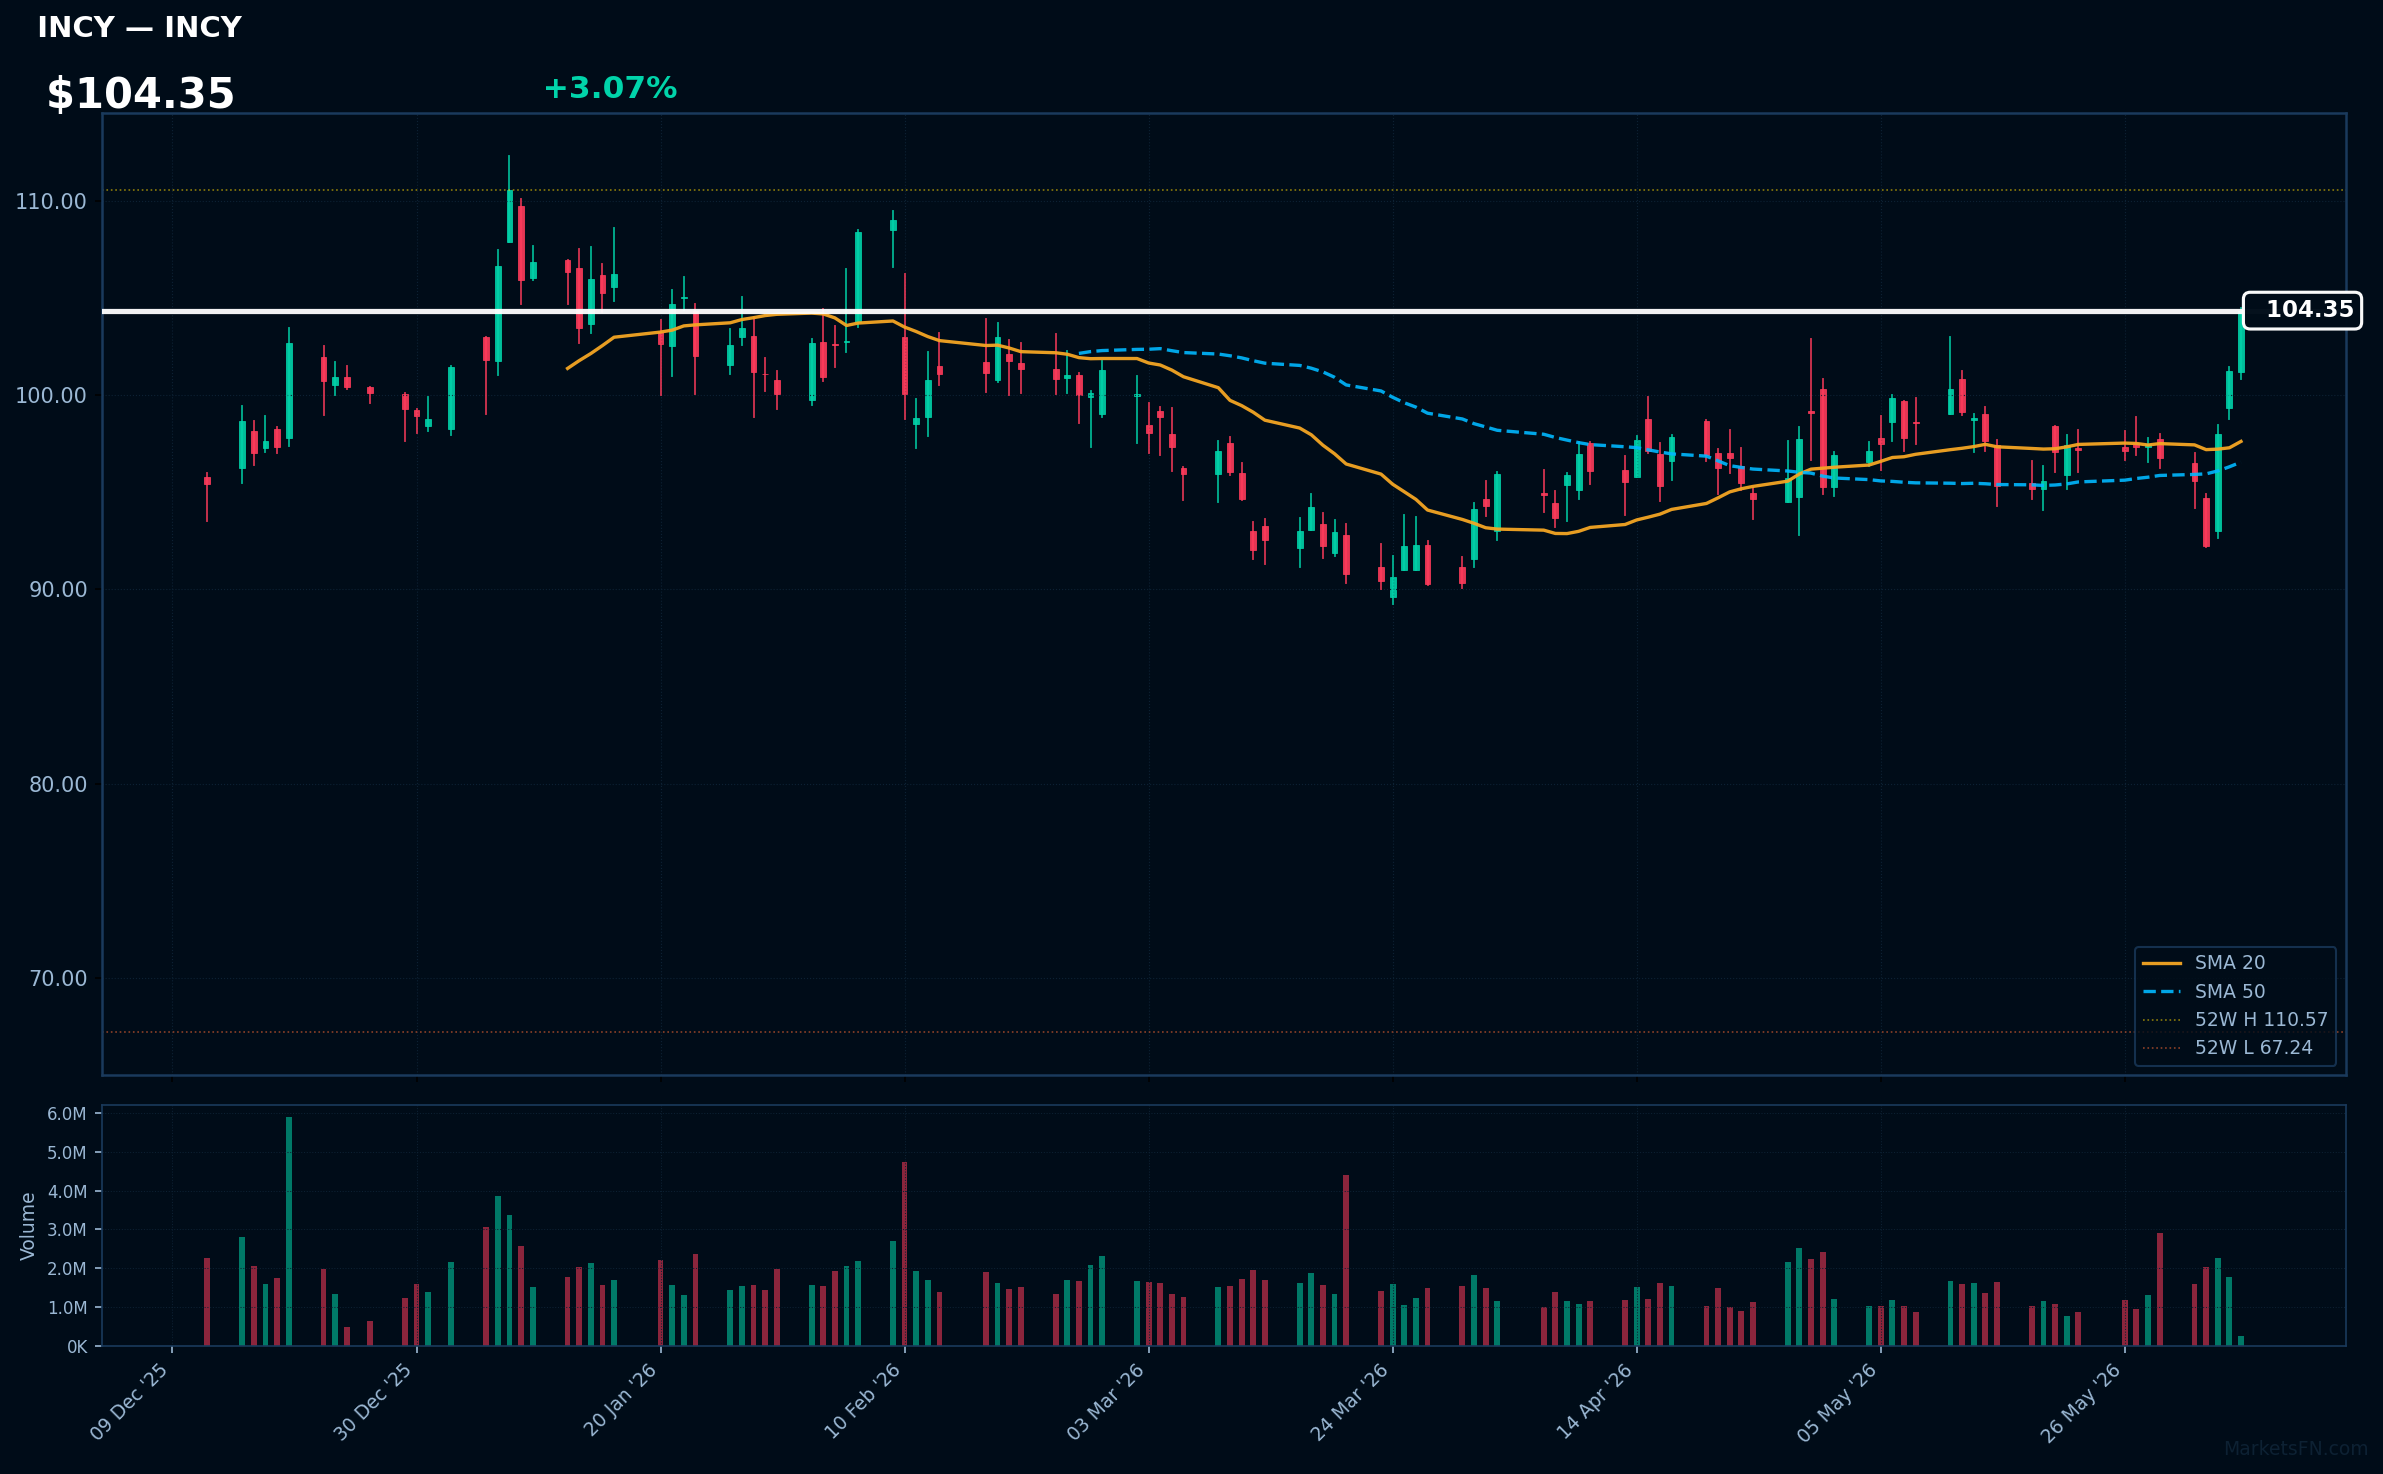
INCY | Incyte Corp | Healthcare | Price: $104.35 | Day: +3.07% | 1W: +7.86% | 1M: +4.50% | RSI: 65.7 | vs MA200: +8.7% | Trend: Above MA20, MA50, MA200
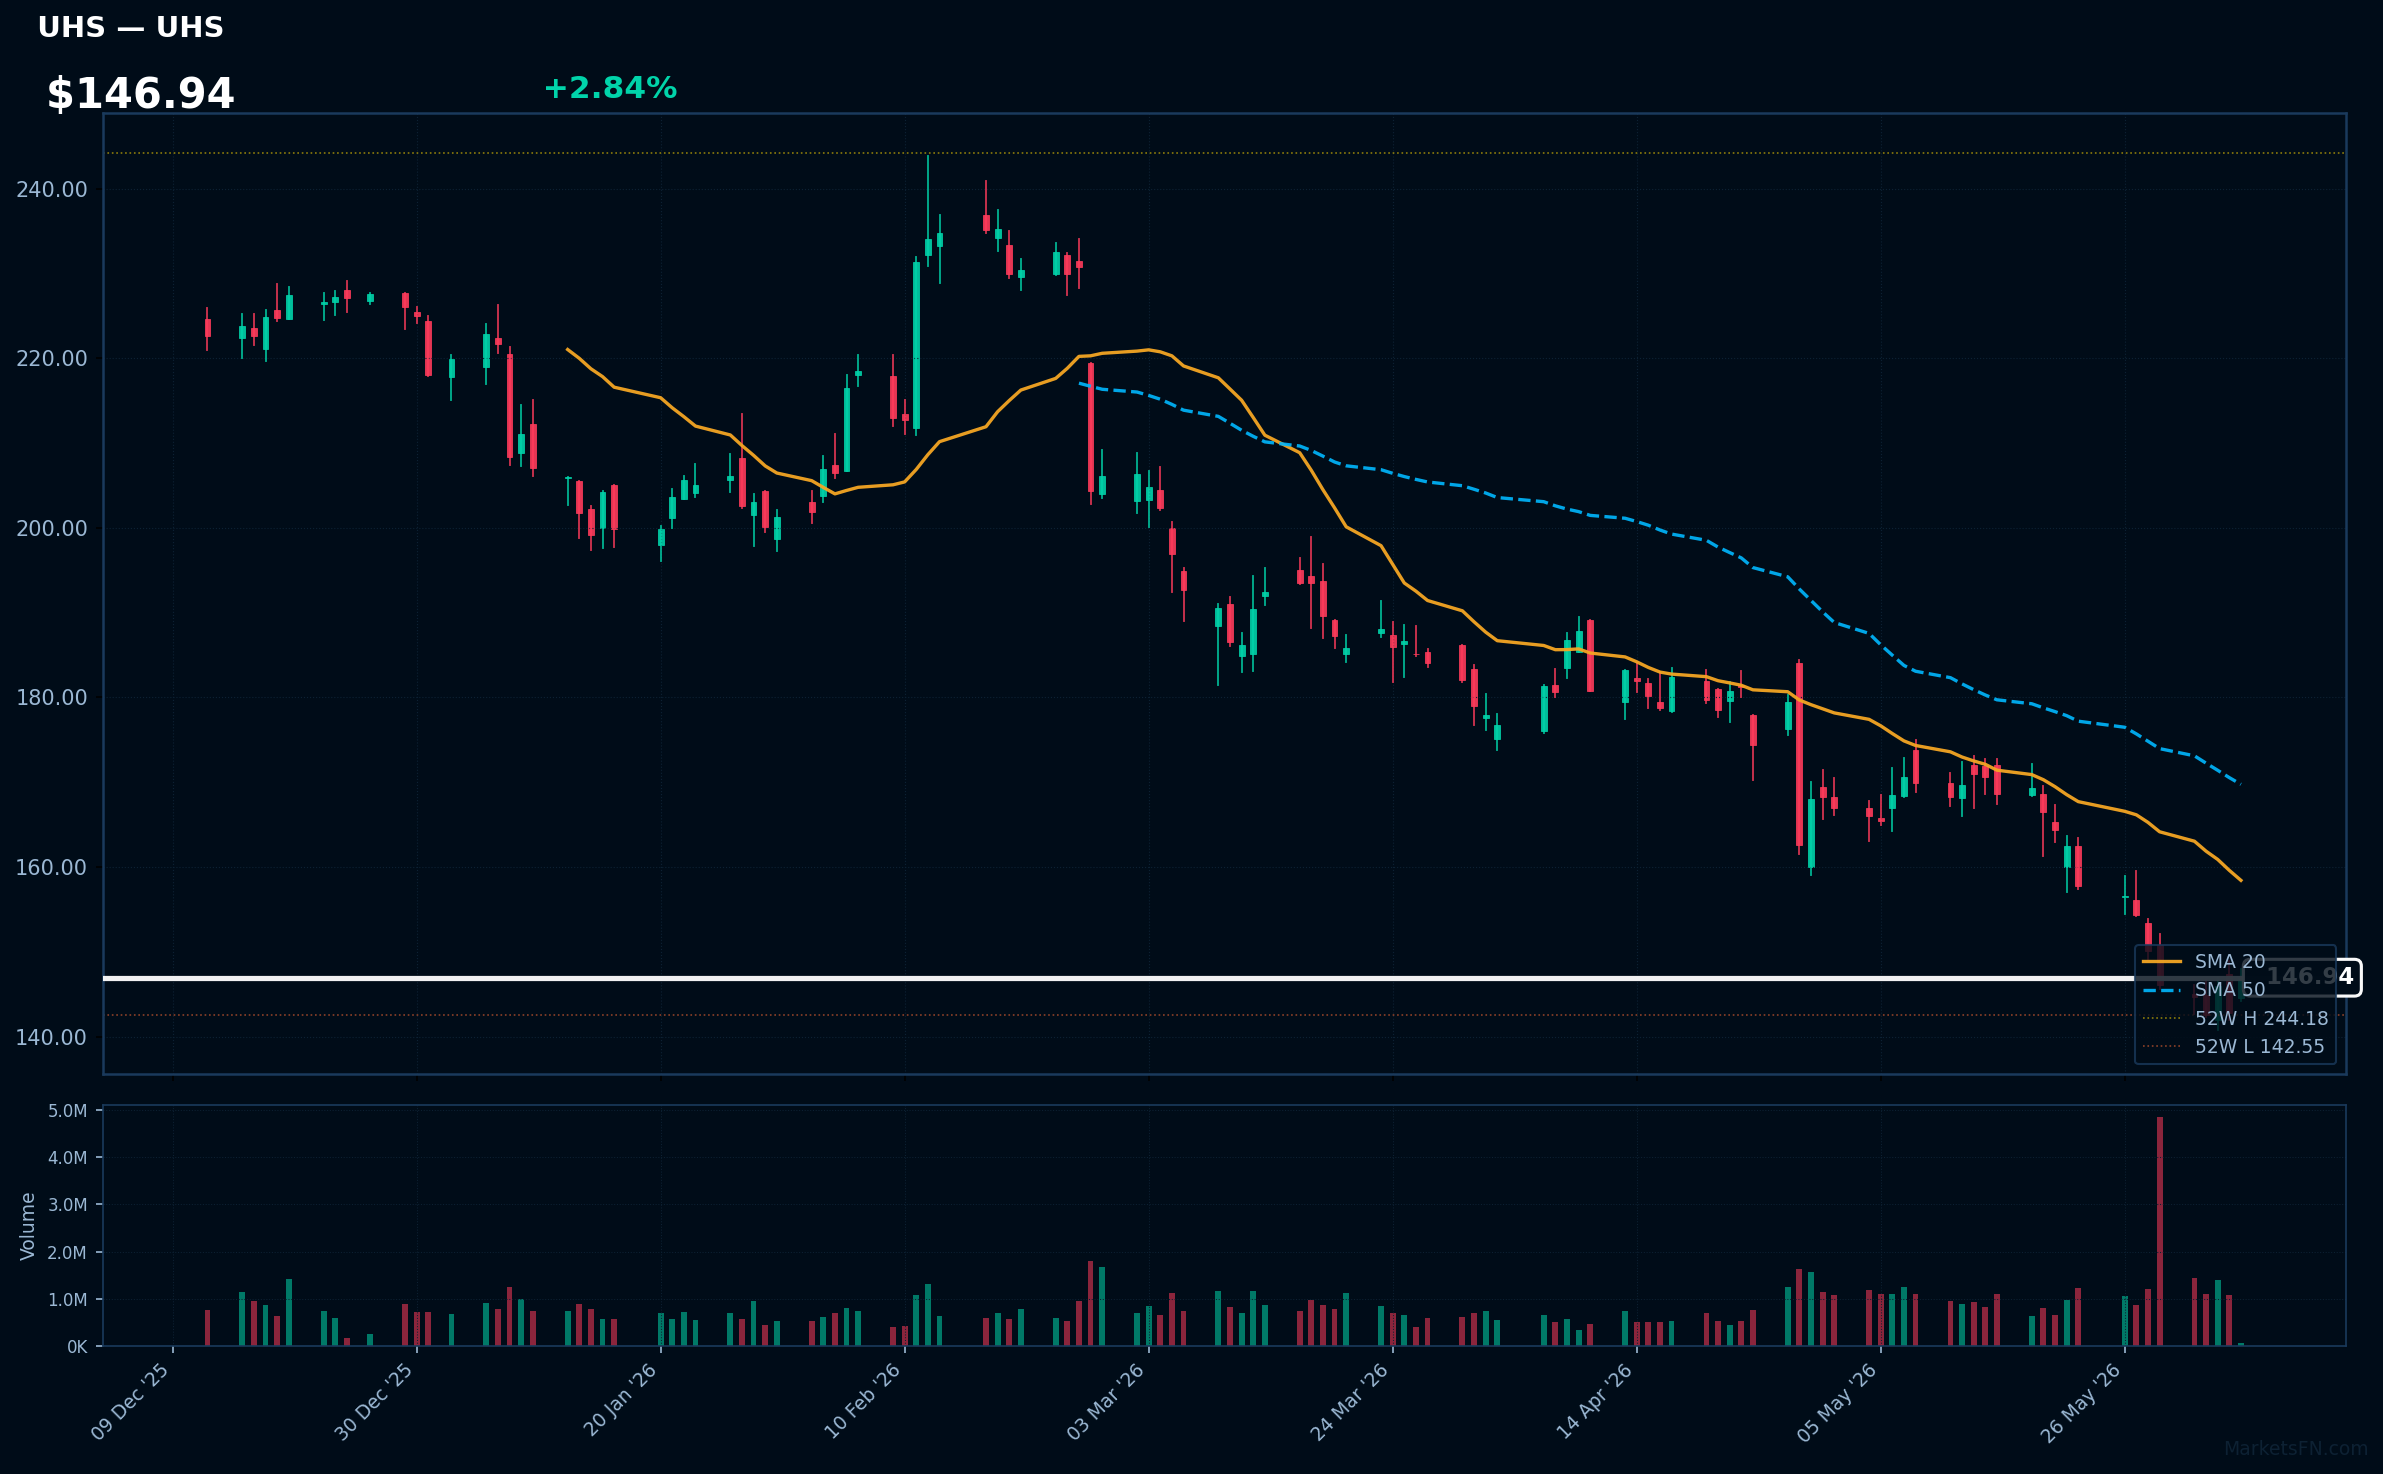
UHS | Universal Health Services, Inc | Healthcare | Price: $146.77 | Day: +2.84% | 1W: +0.57% | 1M: -12.79% | RSI: 32.6 | vs MA200: -26.5% | Trend: Below MA20, MA50, MA200
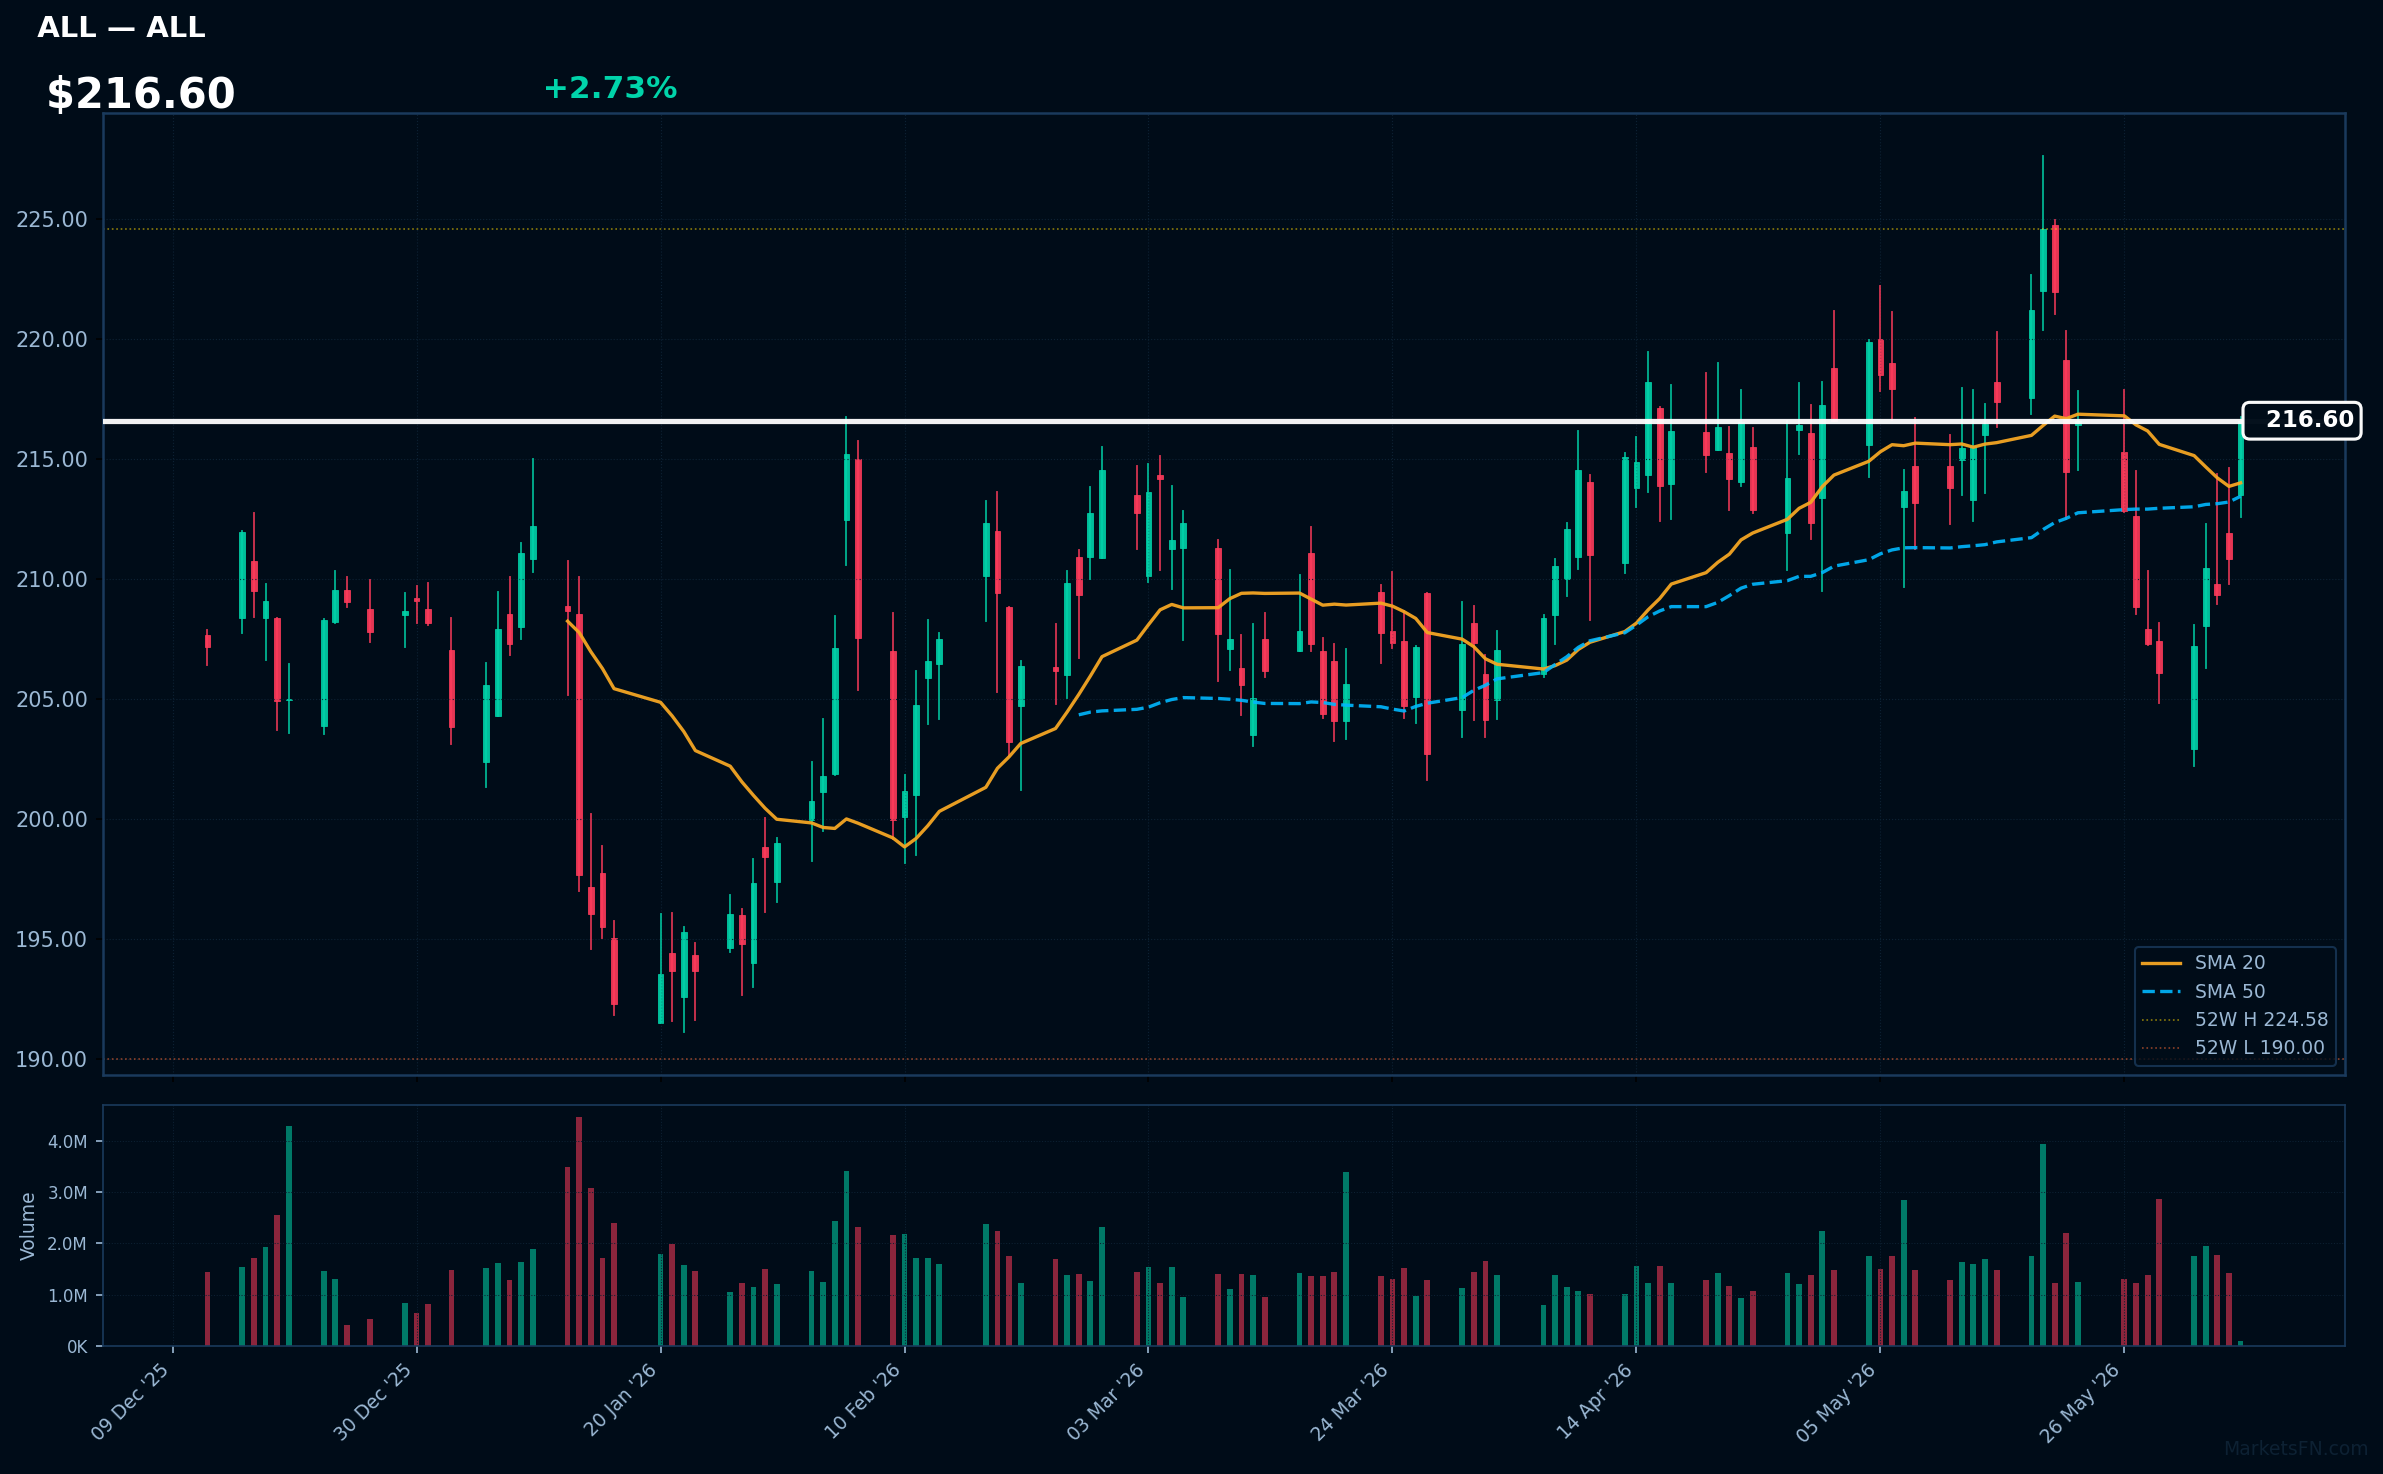
ALL | Allstate Corp | Financial | Price: $216.60 | Day: +2.73% | 1W: +5.10% | 1M: -0.61% | RSI: 55.1 | vs MA200: +4.7% | Trend: Above MA20, MA50, MA200
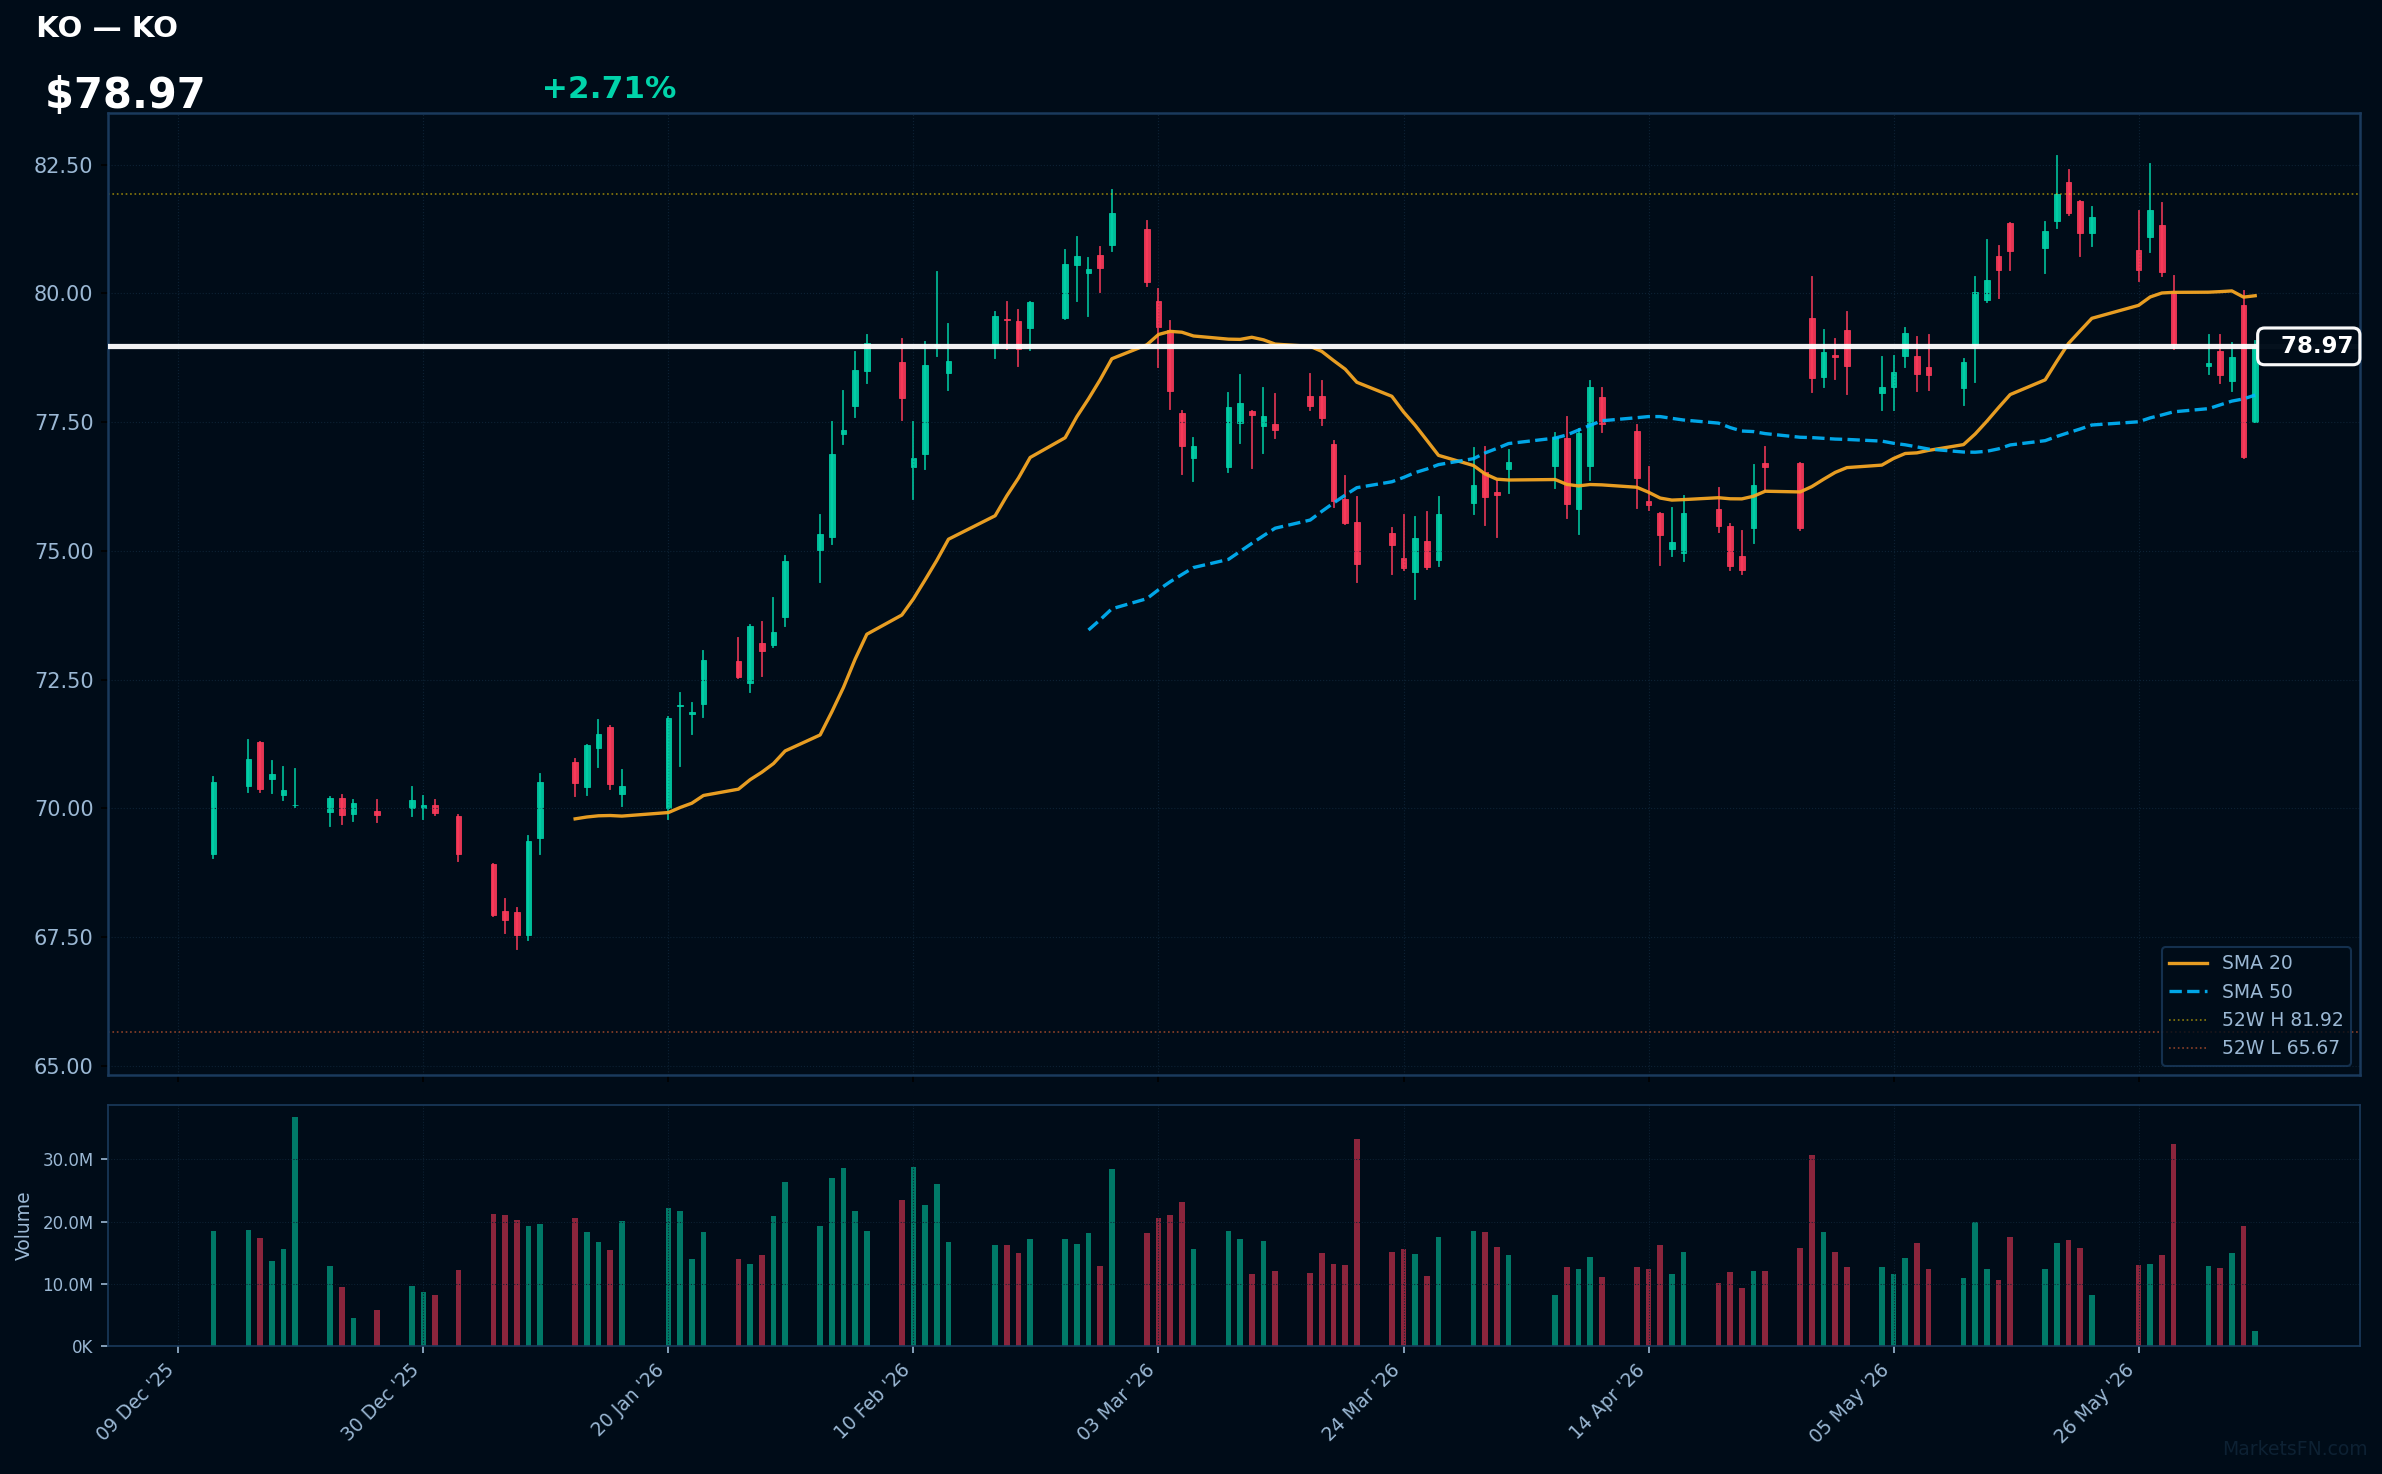
KO | Coca-Cola Co | Consumer Defensive | Price: $78.90 | Day: +2.71% | 1W: -0.05% | 1M: -0.33% | RSI: 49.3 | vs MA200: +7.8% | Trend: Above MA50, MA200 · Below MA20
Recent headlines (last 12h)
- KO Stock In Focus: Middle East Risk, Consumer Weakness, CEO Stock Sale Amplify Uncertainty
- Big Money Powers the Biggest Sporting Event Ever
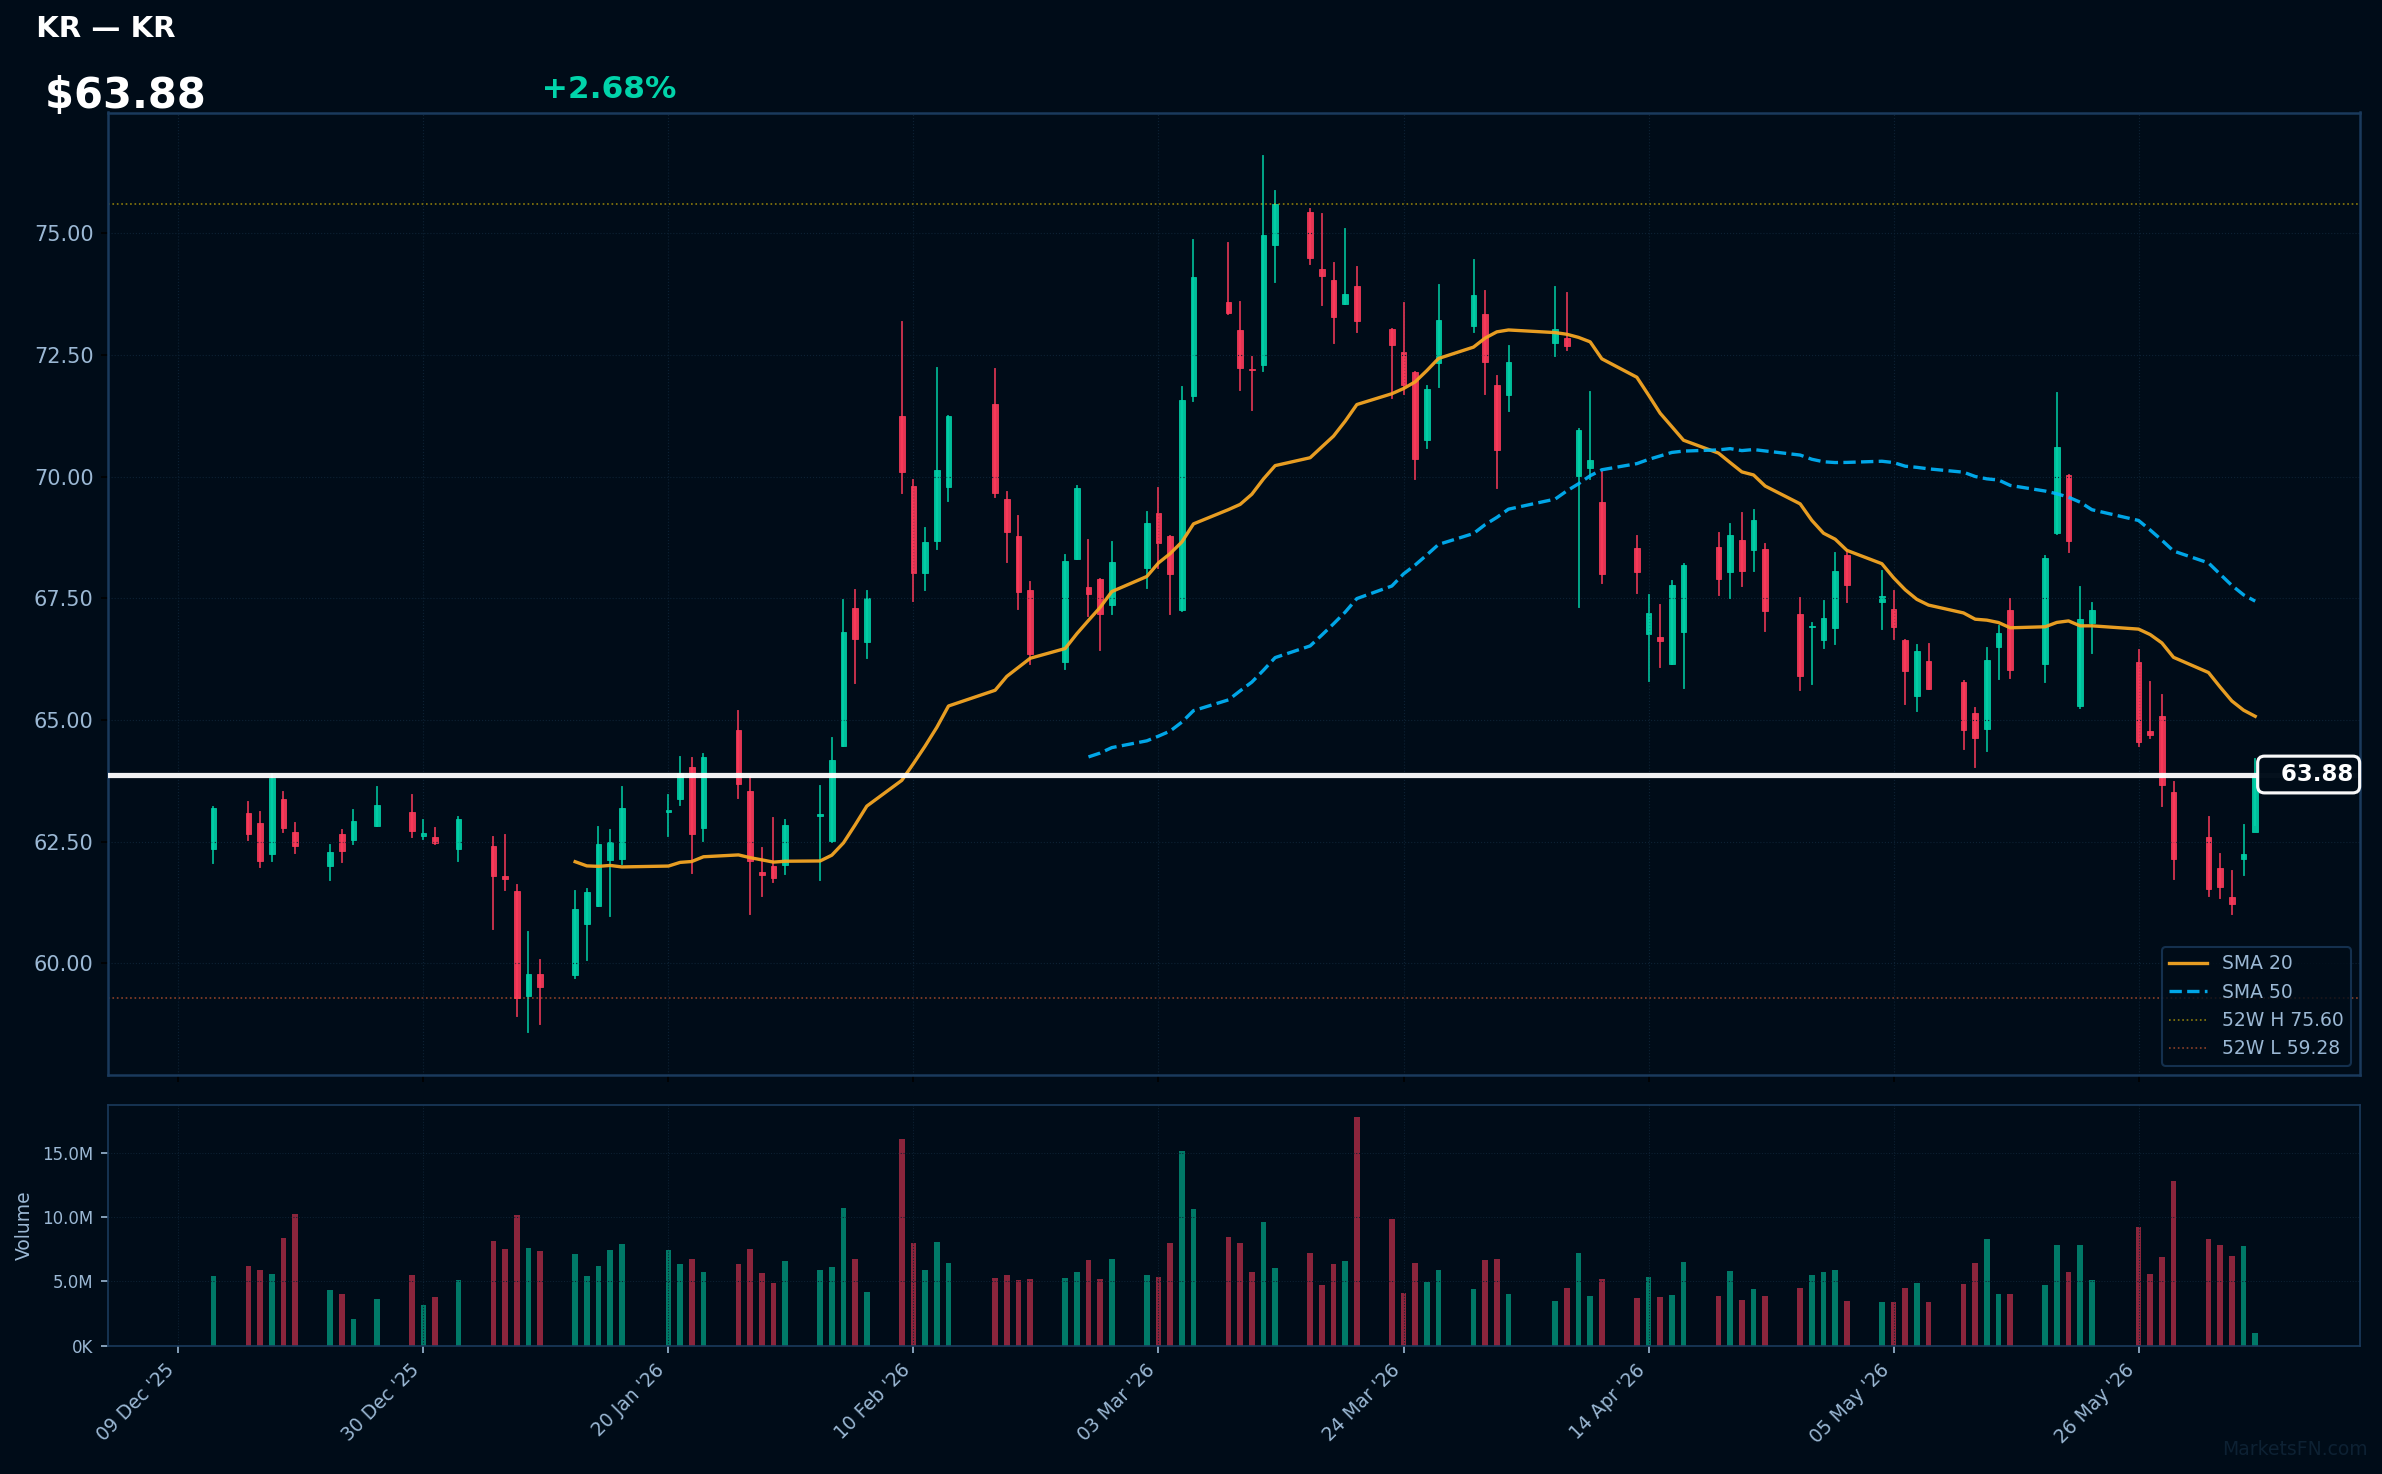
KR | Kroger Co | Consumer Defensive | Price: $63.91 | Day: +2.68% | 1W: +2.78% | 1M: -3.23% | RSI: 44.8 | vs MA200: -4.3% | Trend: Below MA20, MA50, MA200
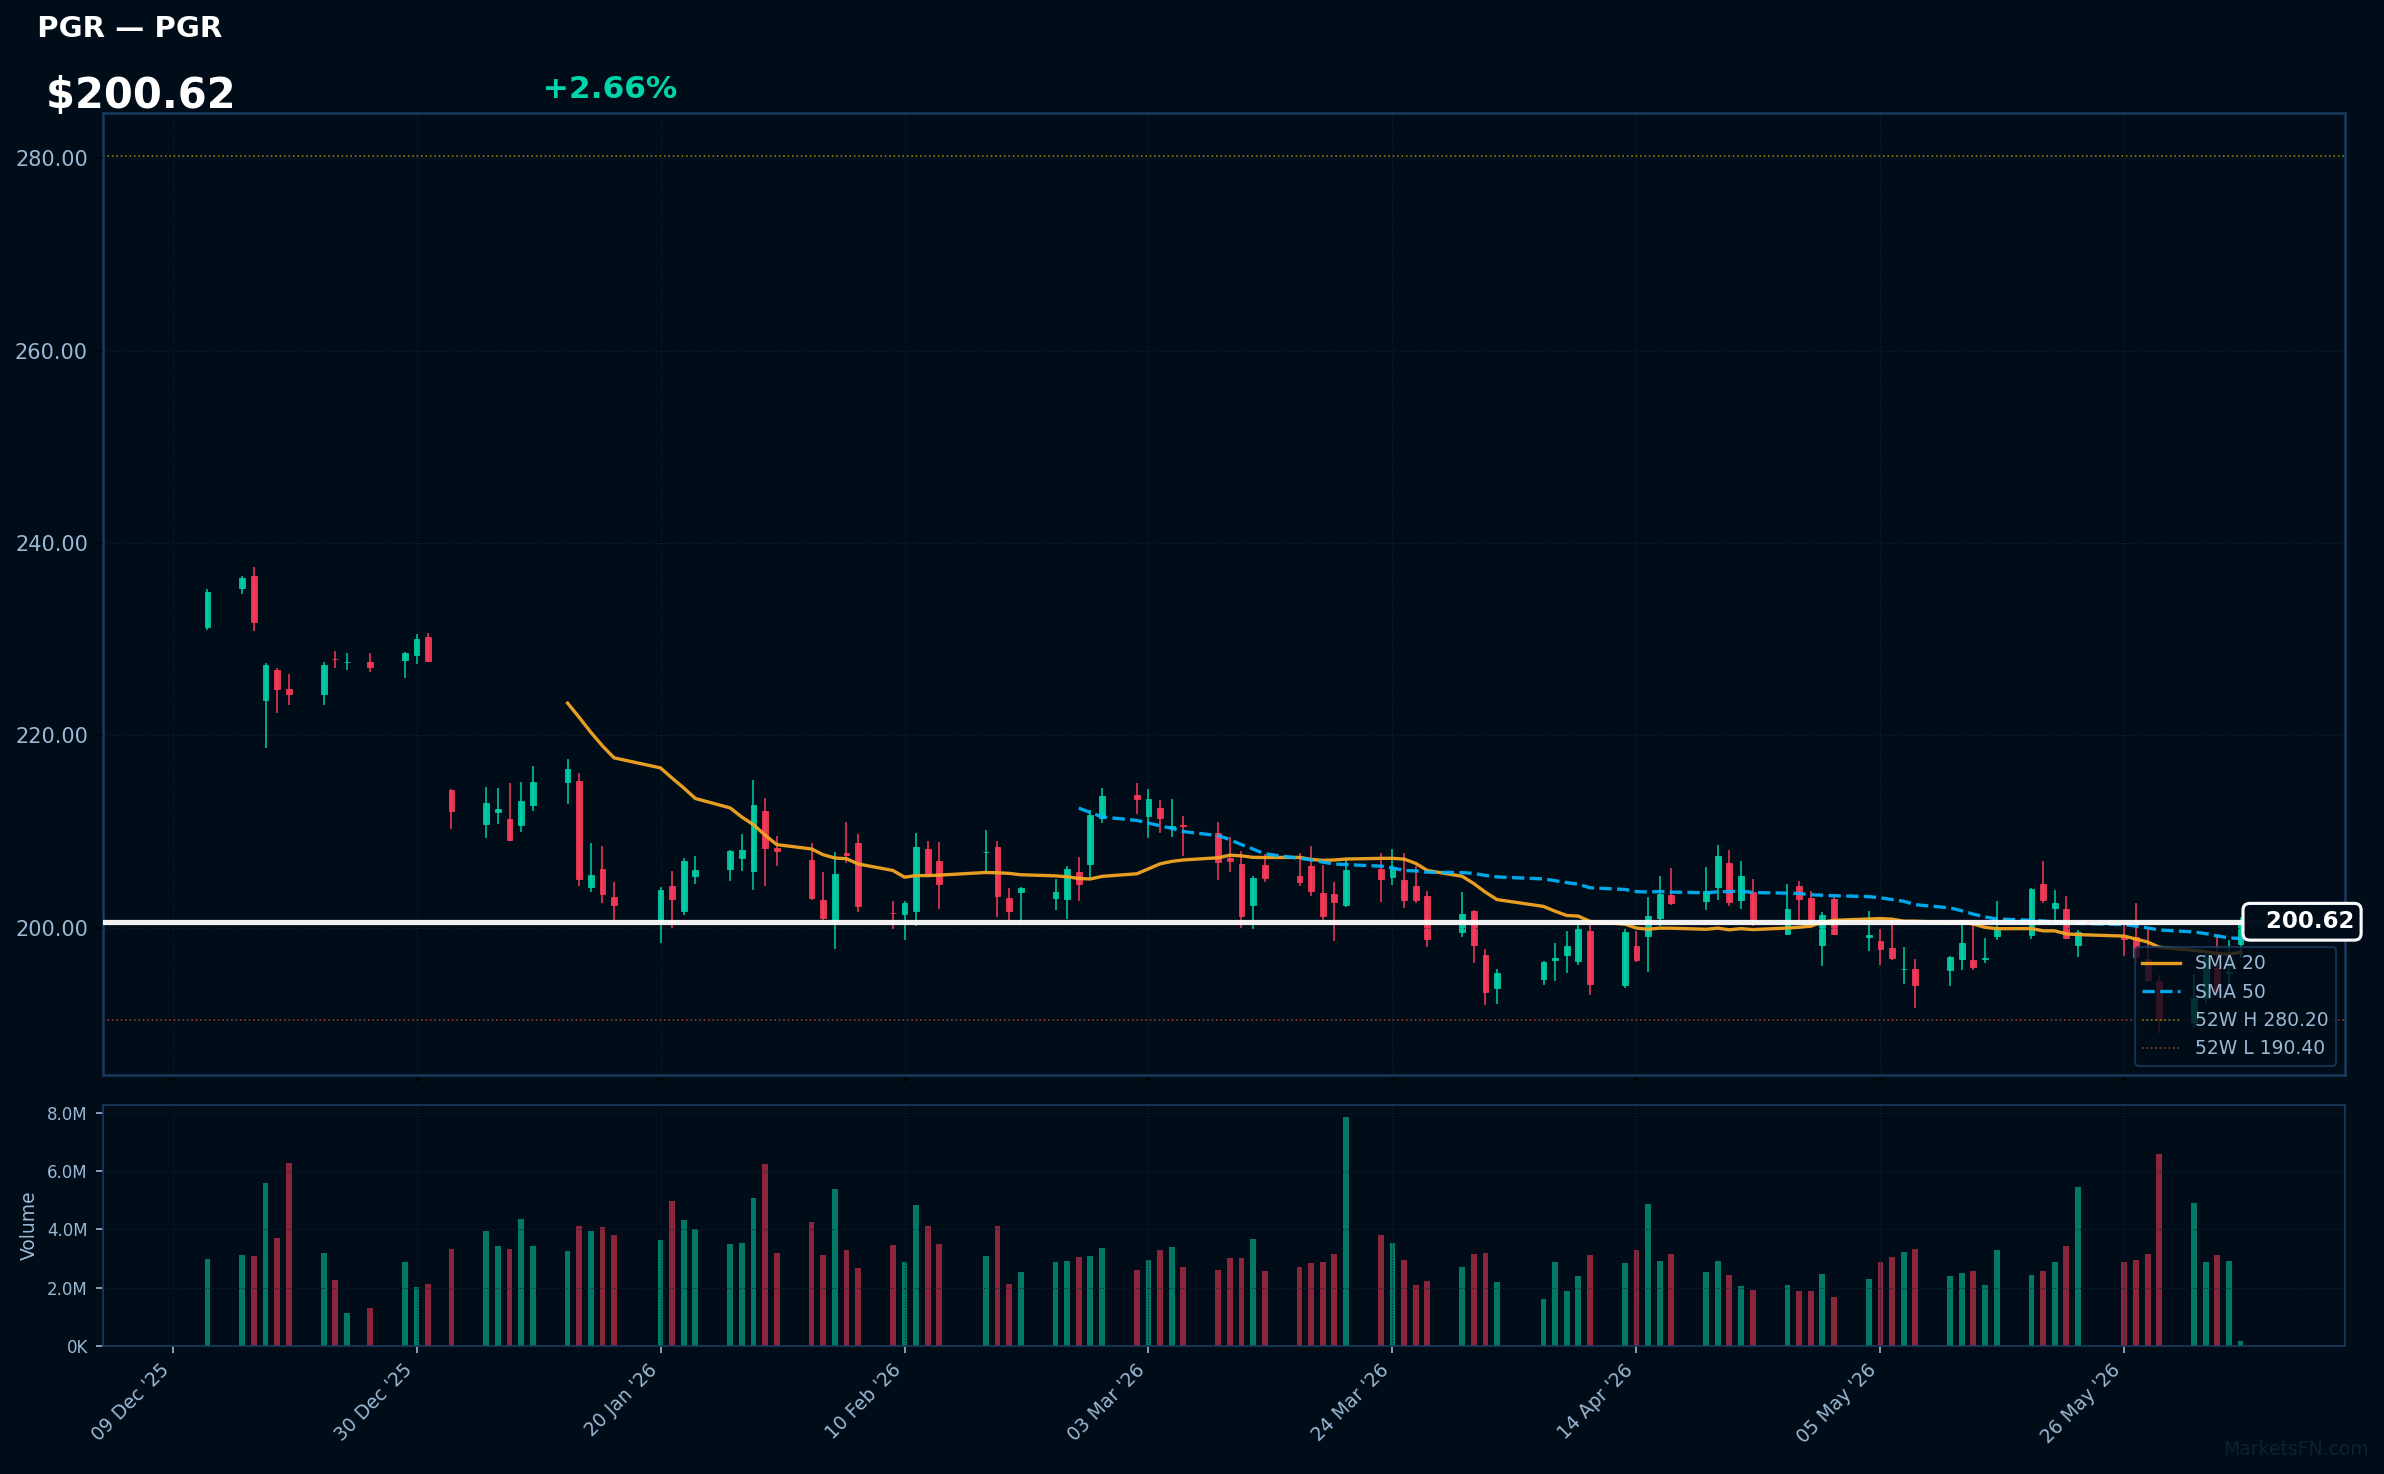
PGR | Progressive Corp | Financial | Price: $200.57 | Day: +2.66% | 1W: +5.37% | 1M: +1.94% | RSI: 54.2 | vs MA200: -7.4% | Trend: Above MA20, MA50 · Below MA200
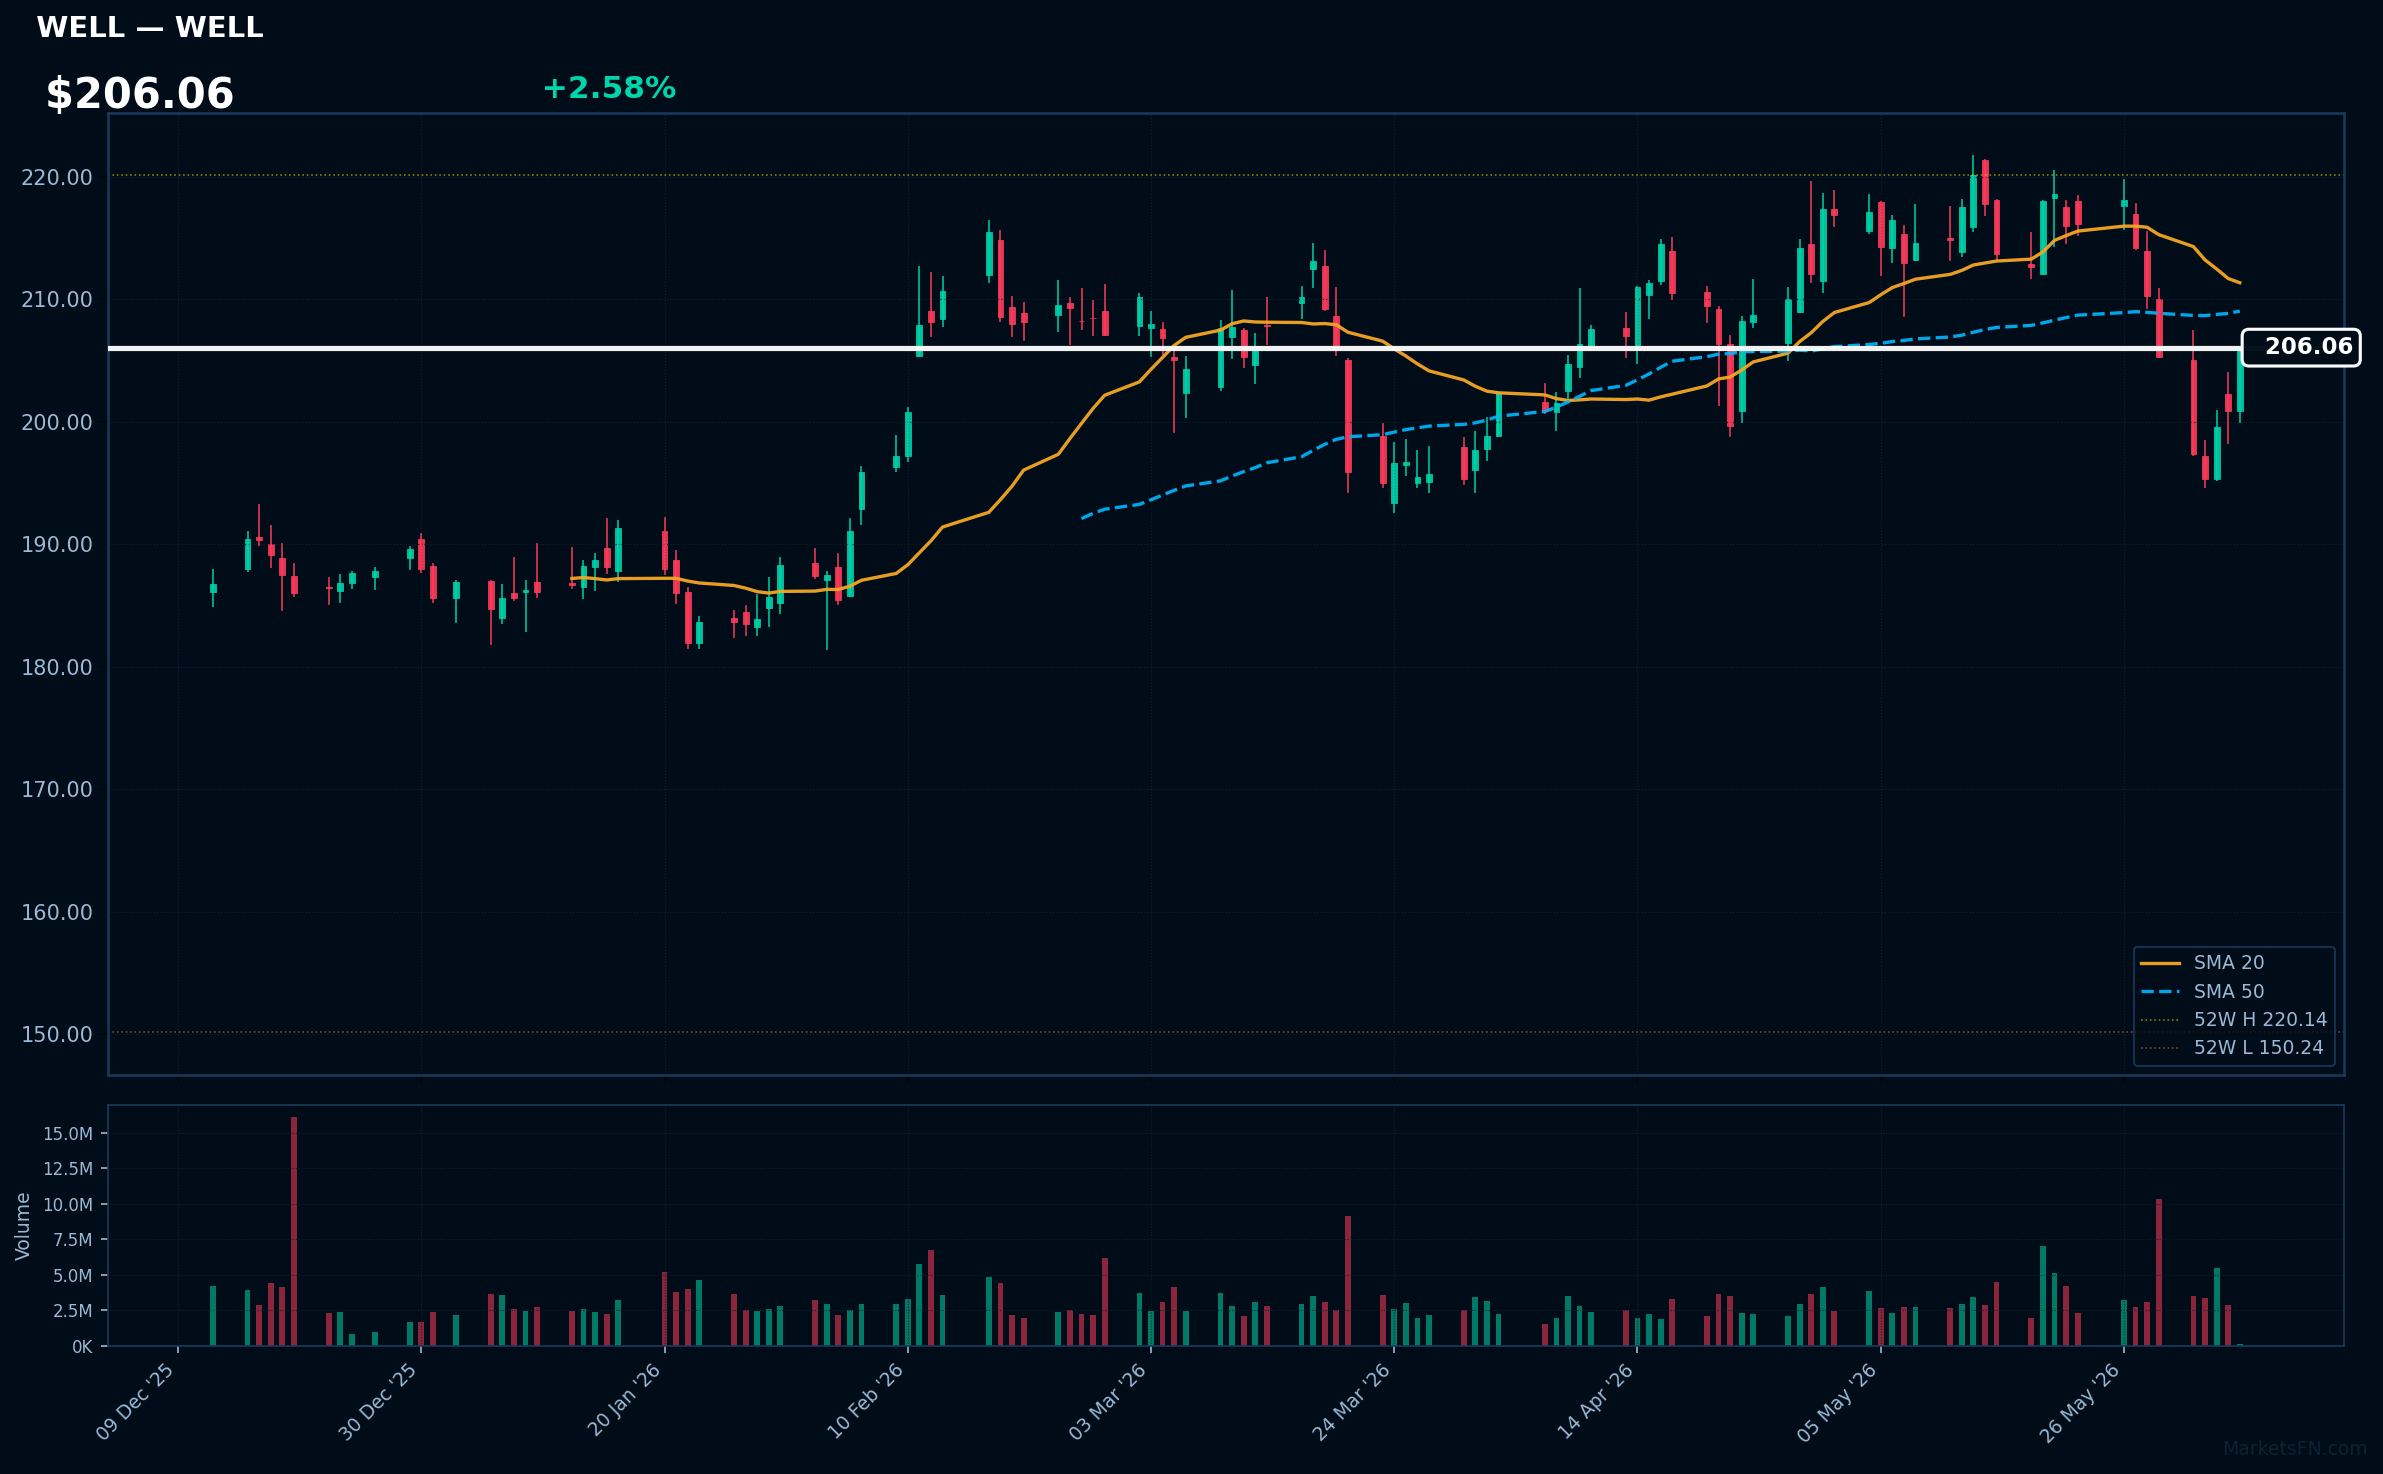
WELL | Welltower Inc | Real Estate | Price: $206.03 | Day: +2.58% | 1W: +0.36% | 1M: -4.81% | RSI: 46.3 | vs MA200: +6.8% | Trend: Above MA200 · Below MA20, MA50
Top 10 Losers
Today's weakest S&P 500 performers. Sector drag: Technology (9), Consumer Cyclical (1).
| Ticker | Company | Sector | Price | Day % | 1W % | 1M % | RSI | vs MA200 | Trend |
|---|---|---|---|---|---|---|---|---|---|
| AMD | Advanced Micro Devices Inc | Technology | $492.25 | -5.92% | -4.84% | +16.55% | 60.5 | +100.0% | Above MA20, MA50, MA200 |
| INTC | Intel Corp | Technology | $105.11 | -5.97% | -8.44% | -7.09% | 48.4 | +104.9% | Above MA50, MA200 · Below MA20 |
| MU | Micron Technology Inc | Technology | $932.29 | -6.40% | -4.19% | +39.57% | 61.6 | +158.1% | Above MA20, MA50, MA200 |
| FSLR | First Solar Inc | Technology | $293.93 | -6.67% | -4.47% | +34.44% | 65.2 | +27.6% | Above MA20, MA50, MA200 |
| SMCI | Super Micro Computer Inc | Technology | $43.69 | -6.83% | -5.23% | +26.02% | 63.0 | +21.3% | Above MA20, MA50, MA200 |
| GLW | Corning, Inc | Technology | $183.52 | -7.17% | +1.33% | +1.10% | 49.7 | +58.9% | Above MA50, MA200 · Below MA20 |
| ON | ON Semiconductor Corp | Technology | $122.36 | -7.17% | +1.43% | +15.68% | 58.7 | +86.8% | Above MA20, MA50, MA200 |
| WDC | Western Digital Corp | Technology | $532.40 | -7.49% | +0.23% | +10.20% | 59.2 | +119.4% | Above MA20, MA50, MA200 |
| LULU | Lululemon Athletica inc | Consumer Cyclical | $114.91 | -8.01% | -12.43% | -13.00% | 28.0 | -32.9% | Below MA20, MA50, MA200 |
| ENPH | Enphase Energy Inc | Technology | $62.07 | -9.24% | -9.55% | +72.71% | 57.8 | +61.0% | Above MA20, MA50, MA200 |
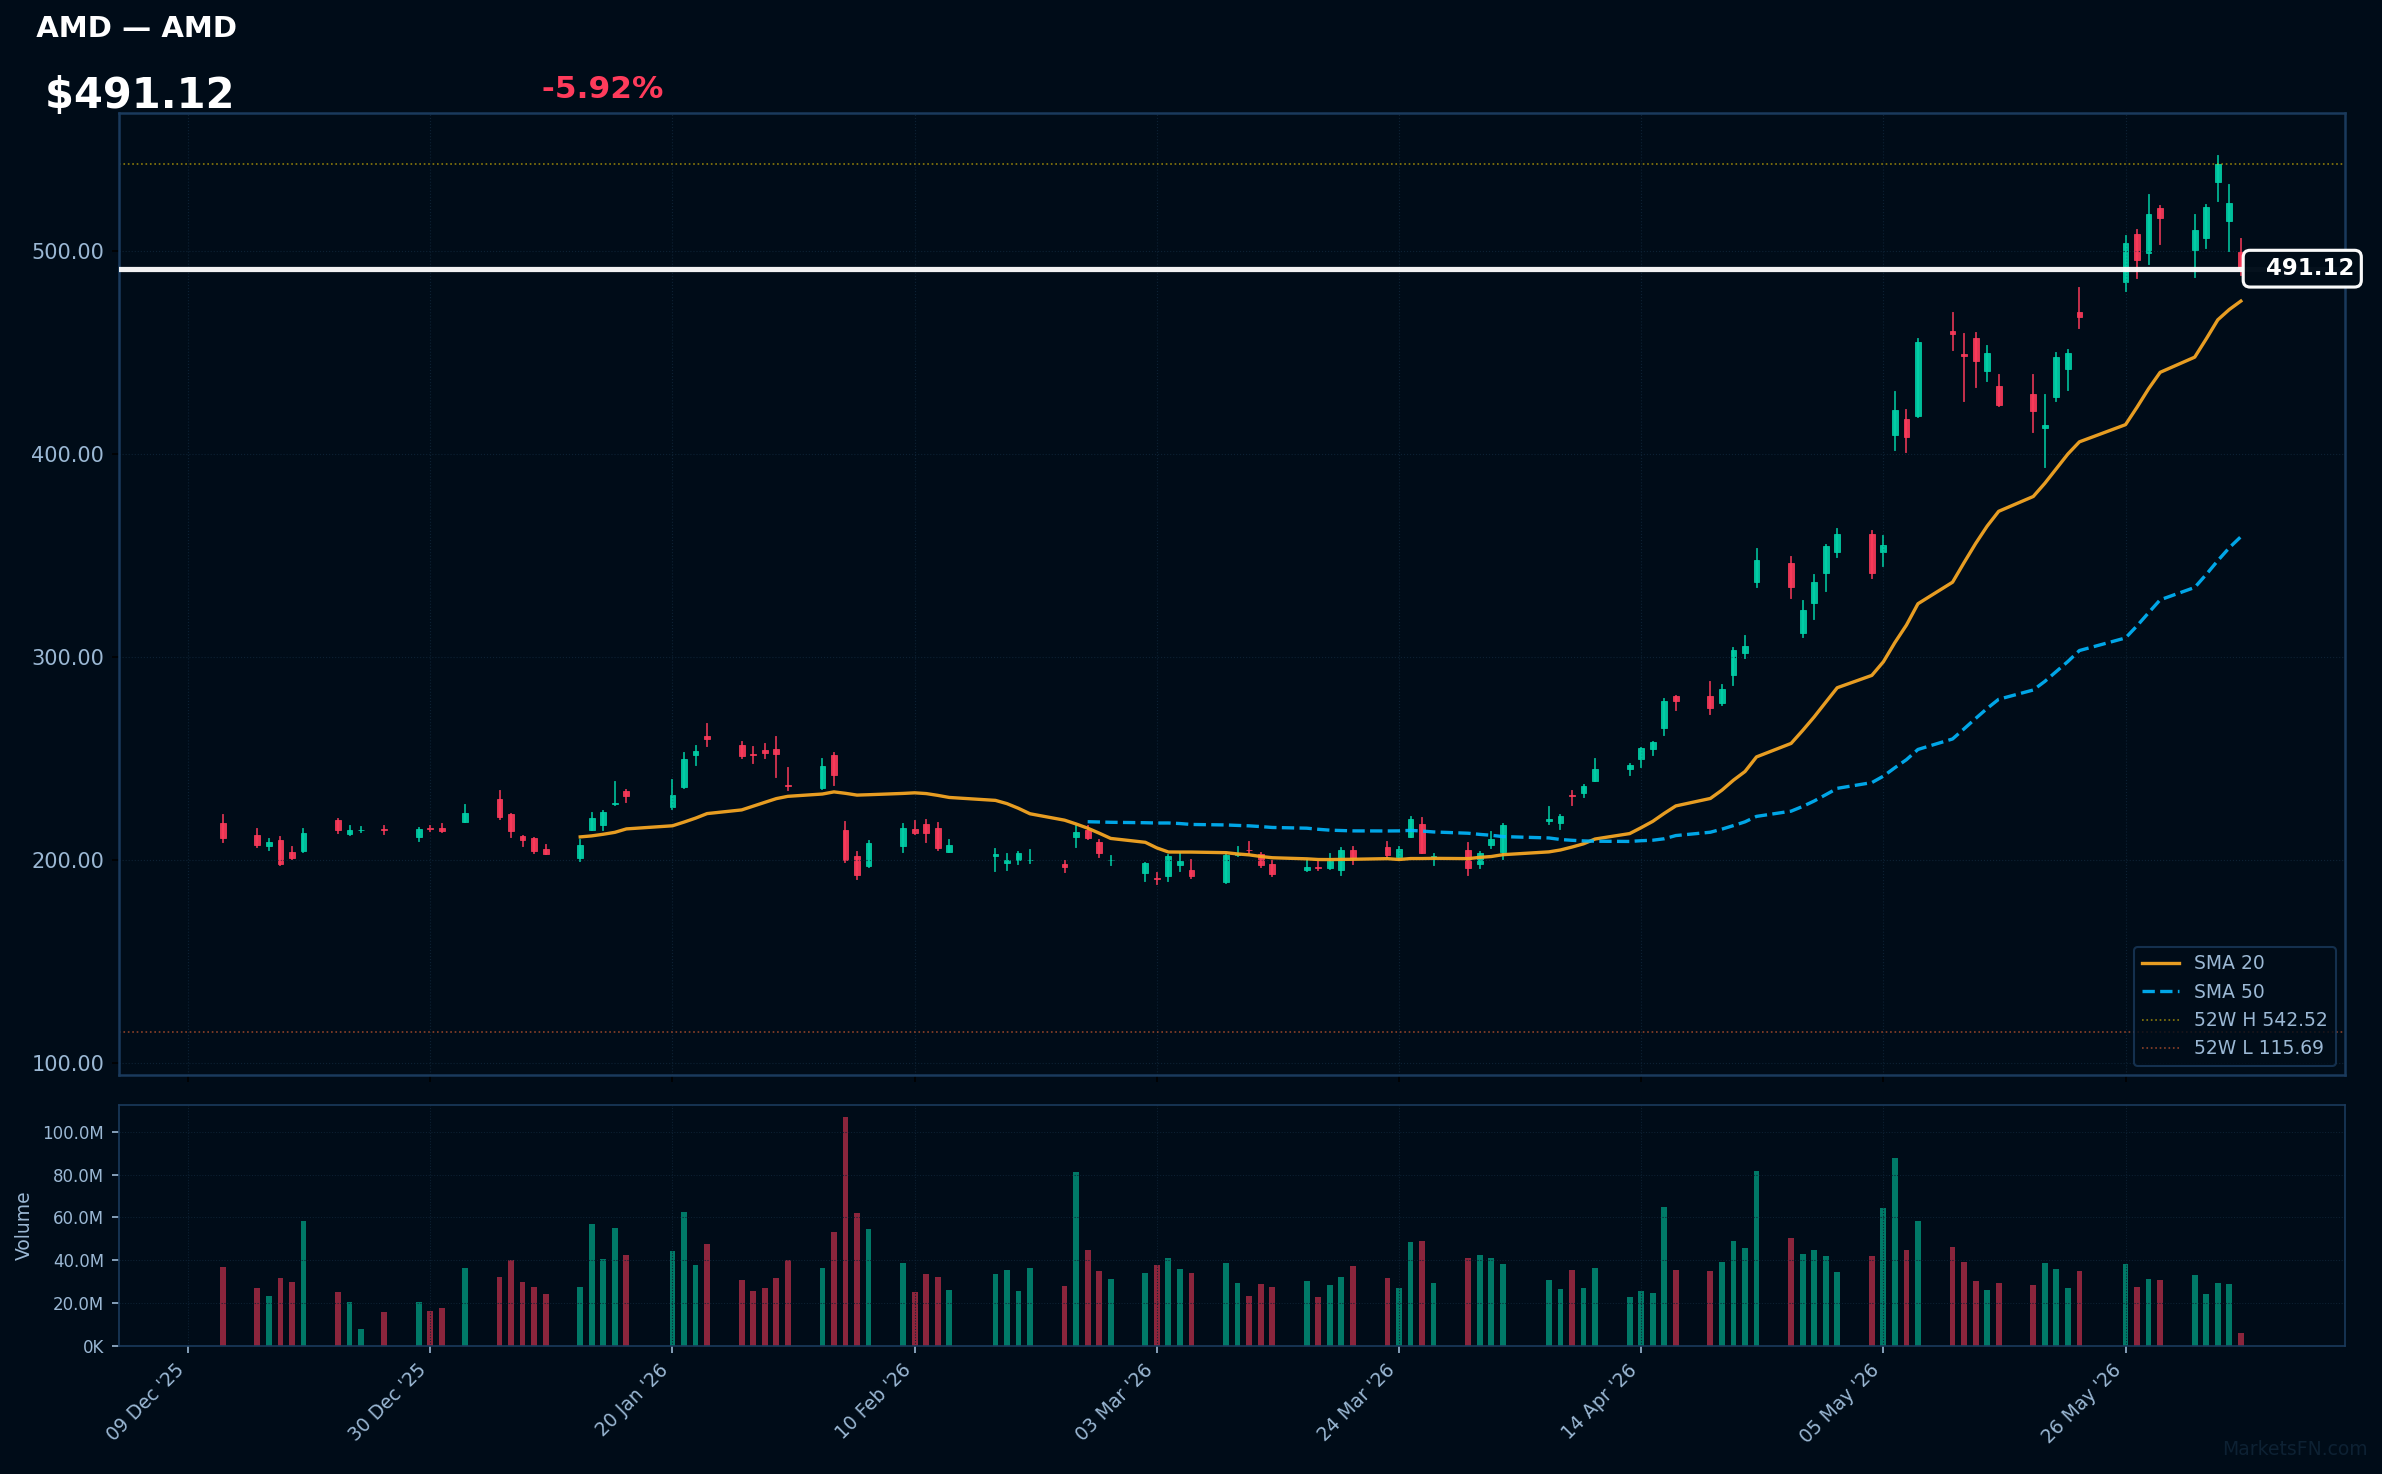
AMD | Advanced Micro Devices Inc | Technology | Price: $492.25 | Day: -5.92% | 1W: -4.84% | 1M: +16.55% | RSI: 60.5 | vs MA200: +100.0% | Trend: Above MA20, MA50, MA200
Recent headlines (last 12h)
- AMD Upgrade Highlights AI Growth Potential
- Nasdaq, S&P futures decline as semiconductors slip; payrolls in focus
- Broadcom and Intel Stocks Drop. The Chip Selloff Has Legs.
- Chip Selloff Hits SOX After Broadcom's 13% Drop
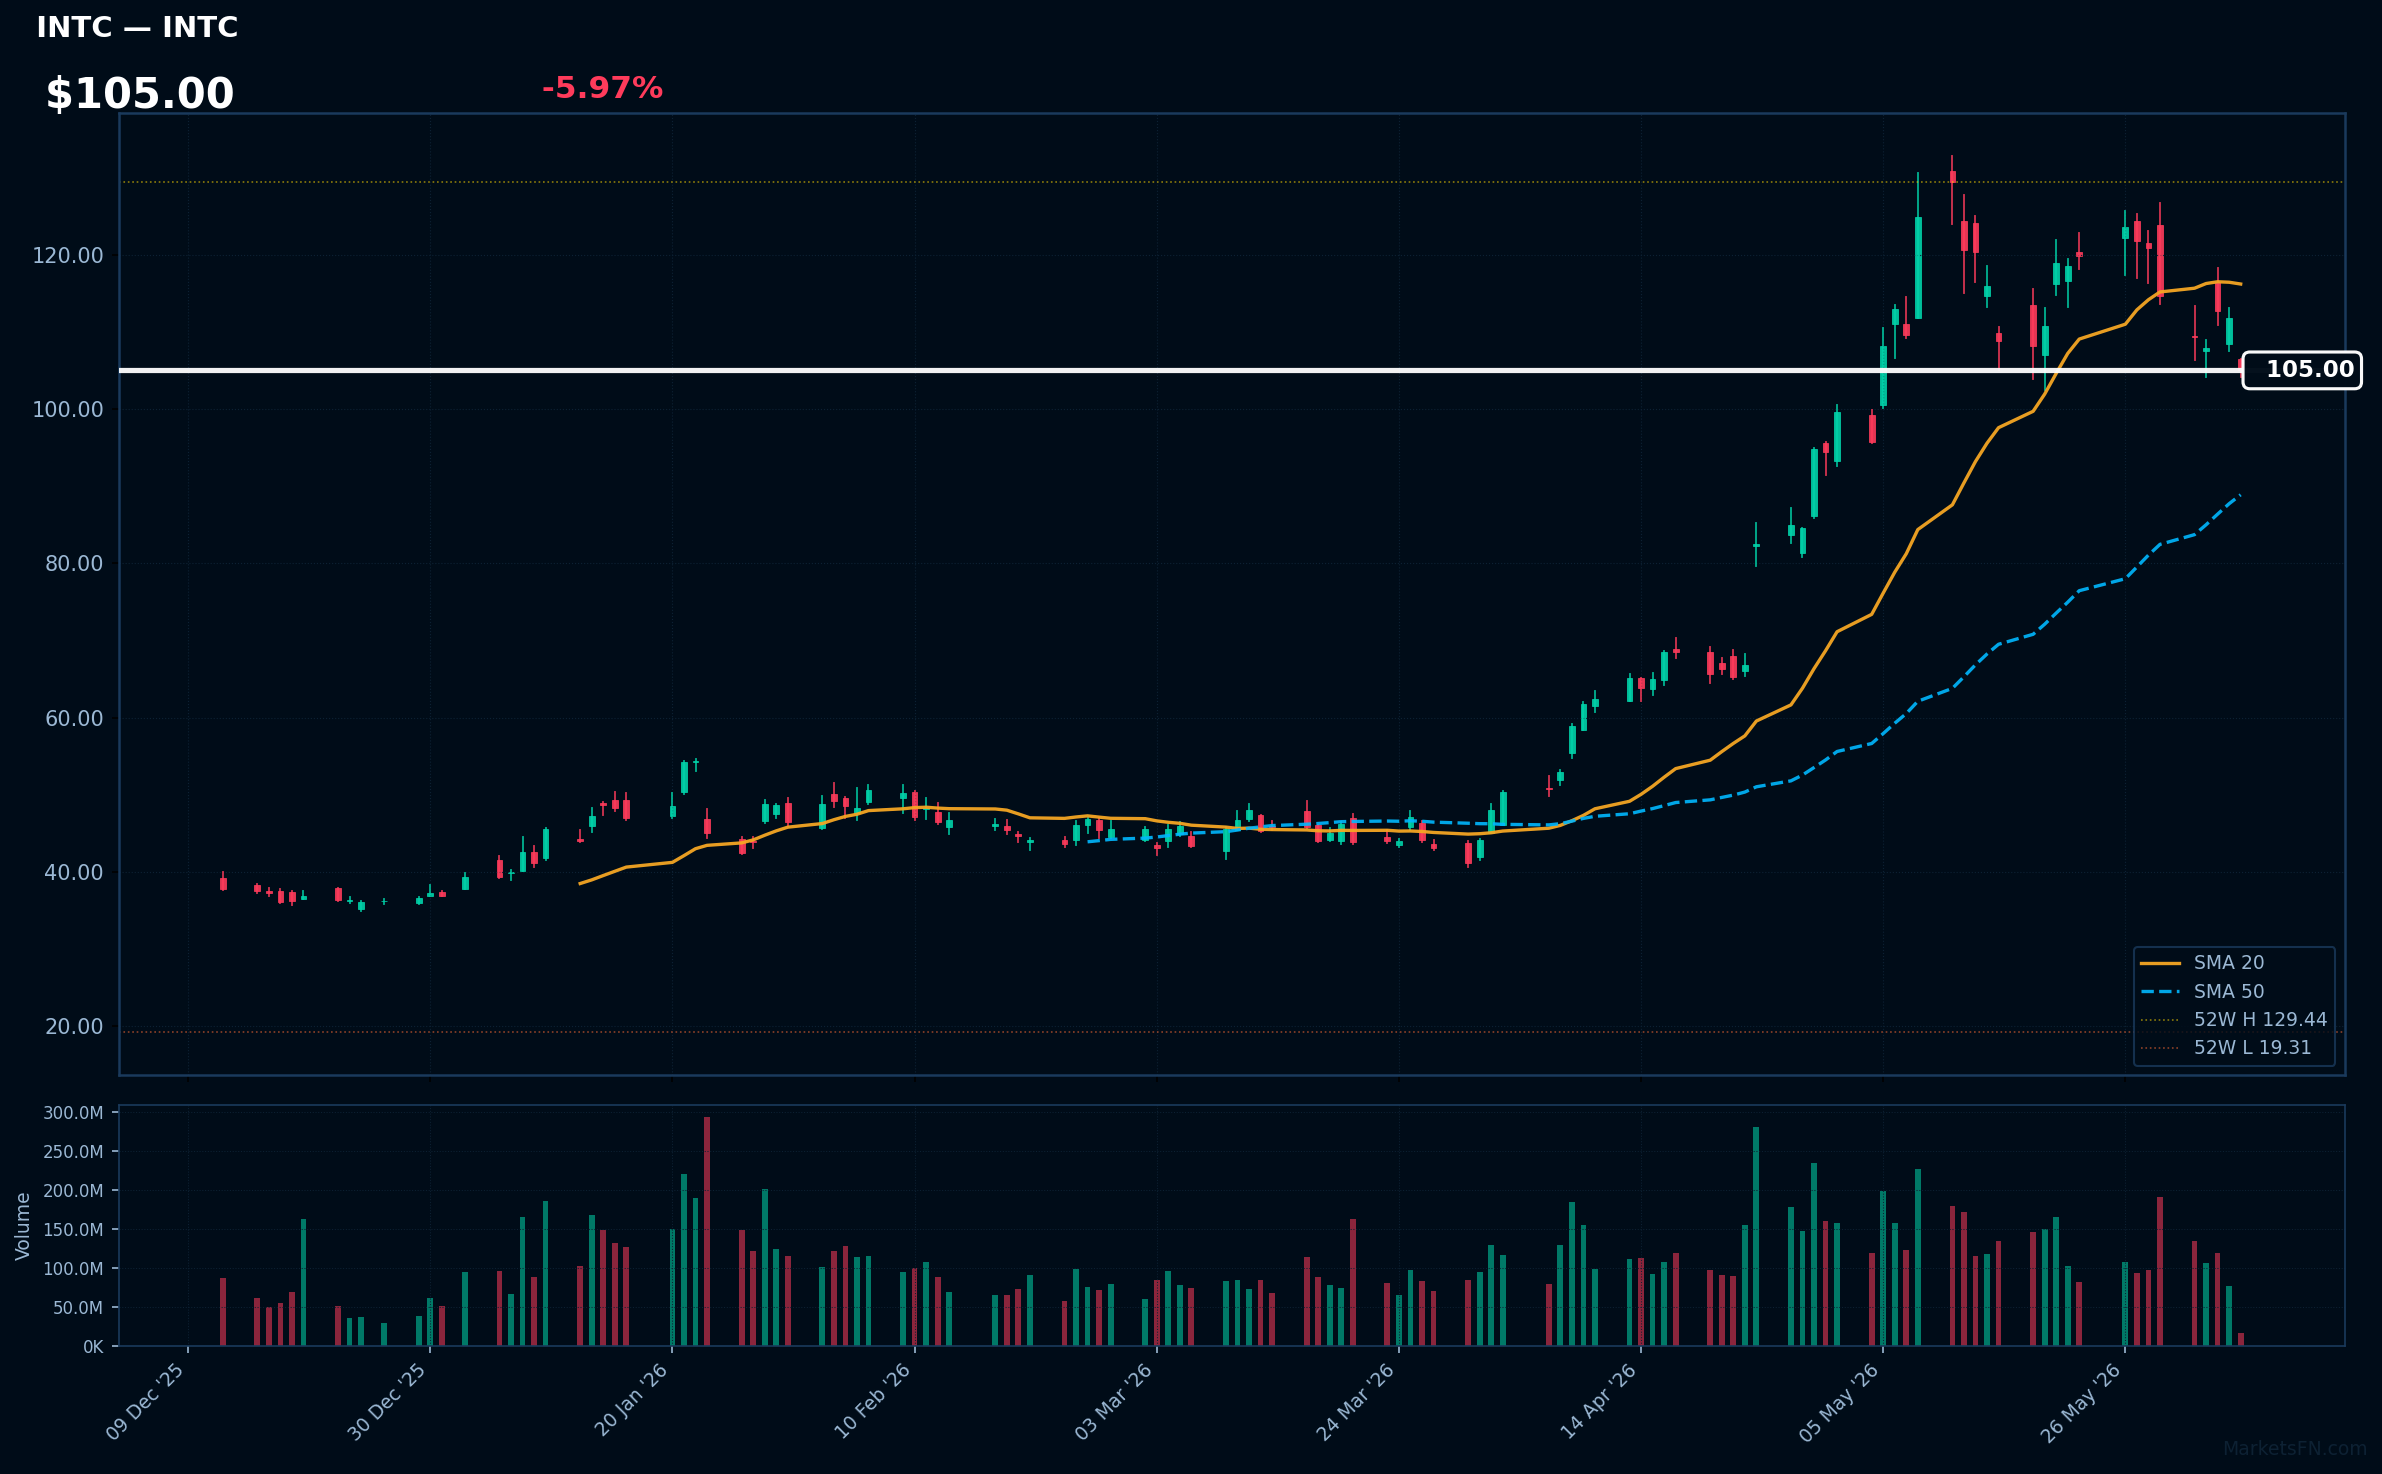
INTC | Intel Corp | Technology | Price: $105.11 | Day: -5.97% | 1W: -8.44% | 1M: -7.09% | RSI: 48.4 | vs MA200: +104.9% | Trend: Above MA50, MA200 · Below MA20
Recent headlines (last 12h)
- Hitachi and Intel announce strategic collaboration to accelerate AI transformation across key industries
- Nasdaq, S&P futures decline as semiconductors slip; payrolls in focus
- Broadcom and Intel Stocks Drop. The Chip Selloff Has Legs.
- NVDA, INTC, AMD, MU: Major Chip Stocks Fall For Second Day After AVGO's Soft AI Guidance
MU | Micron Technology Inc | Technology | Price: $932.29 | Day: -6.40% | 1W: -4.19% | 1M: +39.57% | RSI: 61.6 | vs MA200: +158.1% | Trend: Above MA20, MA50, MA200
Recent headlines (last 12h)
- Nvidia certifies Samsung, SK Hynix and Micron for Vera Rubin HBM4 supply
- Chip stocks extend pullback, but pare some losses after jobs data
- Nvidia Qualifies Three HBM4 Suppliers for Vera Rubin AI Platform
- Micron Gets Memory-Chip Approval From Nvidia. Why the Stock Is Falling.
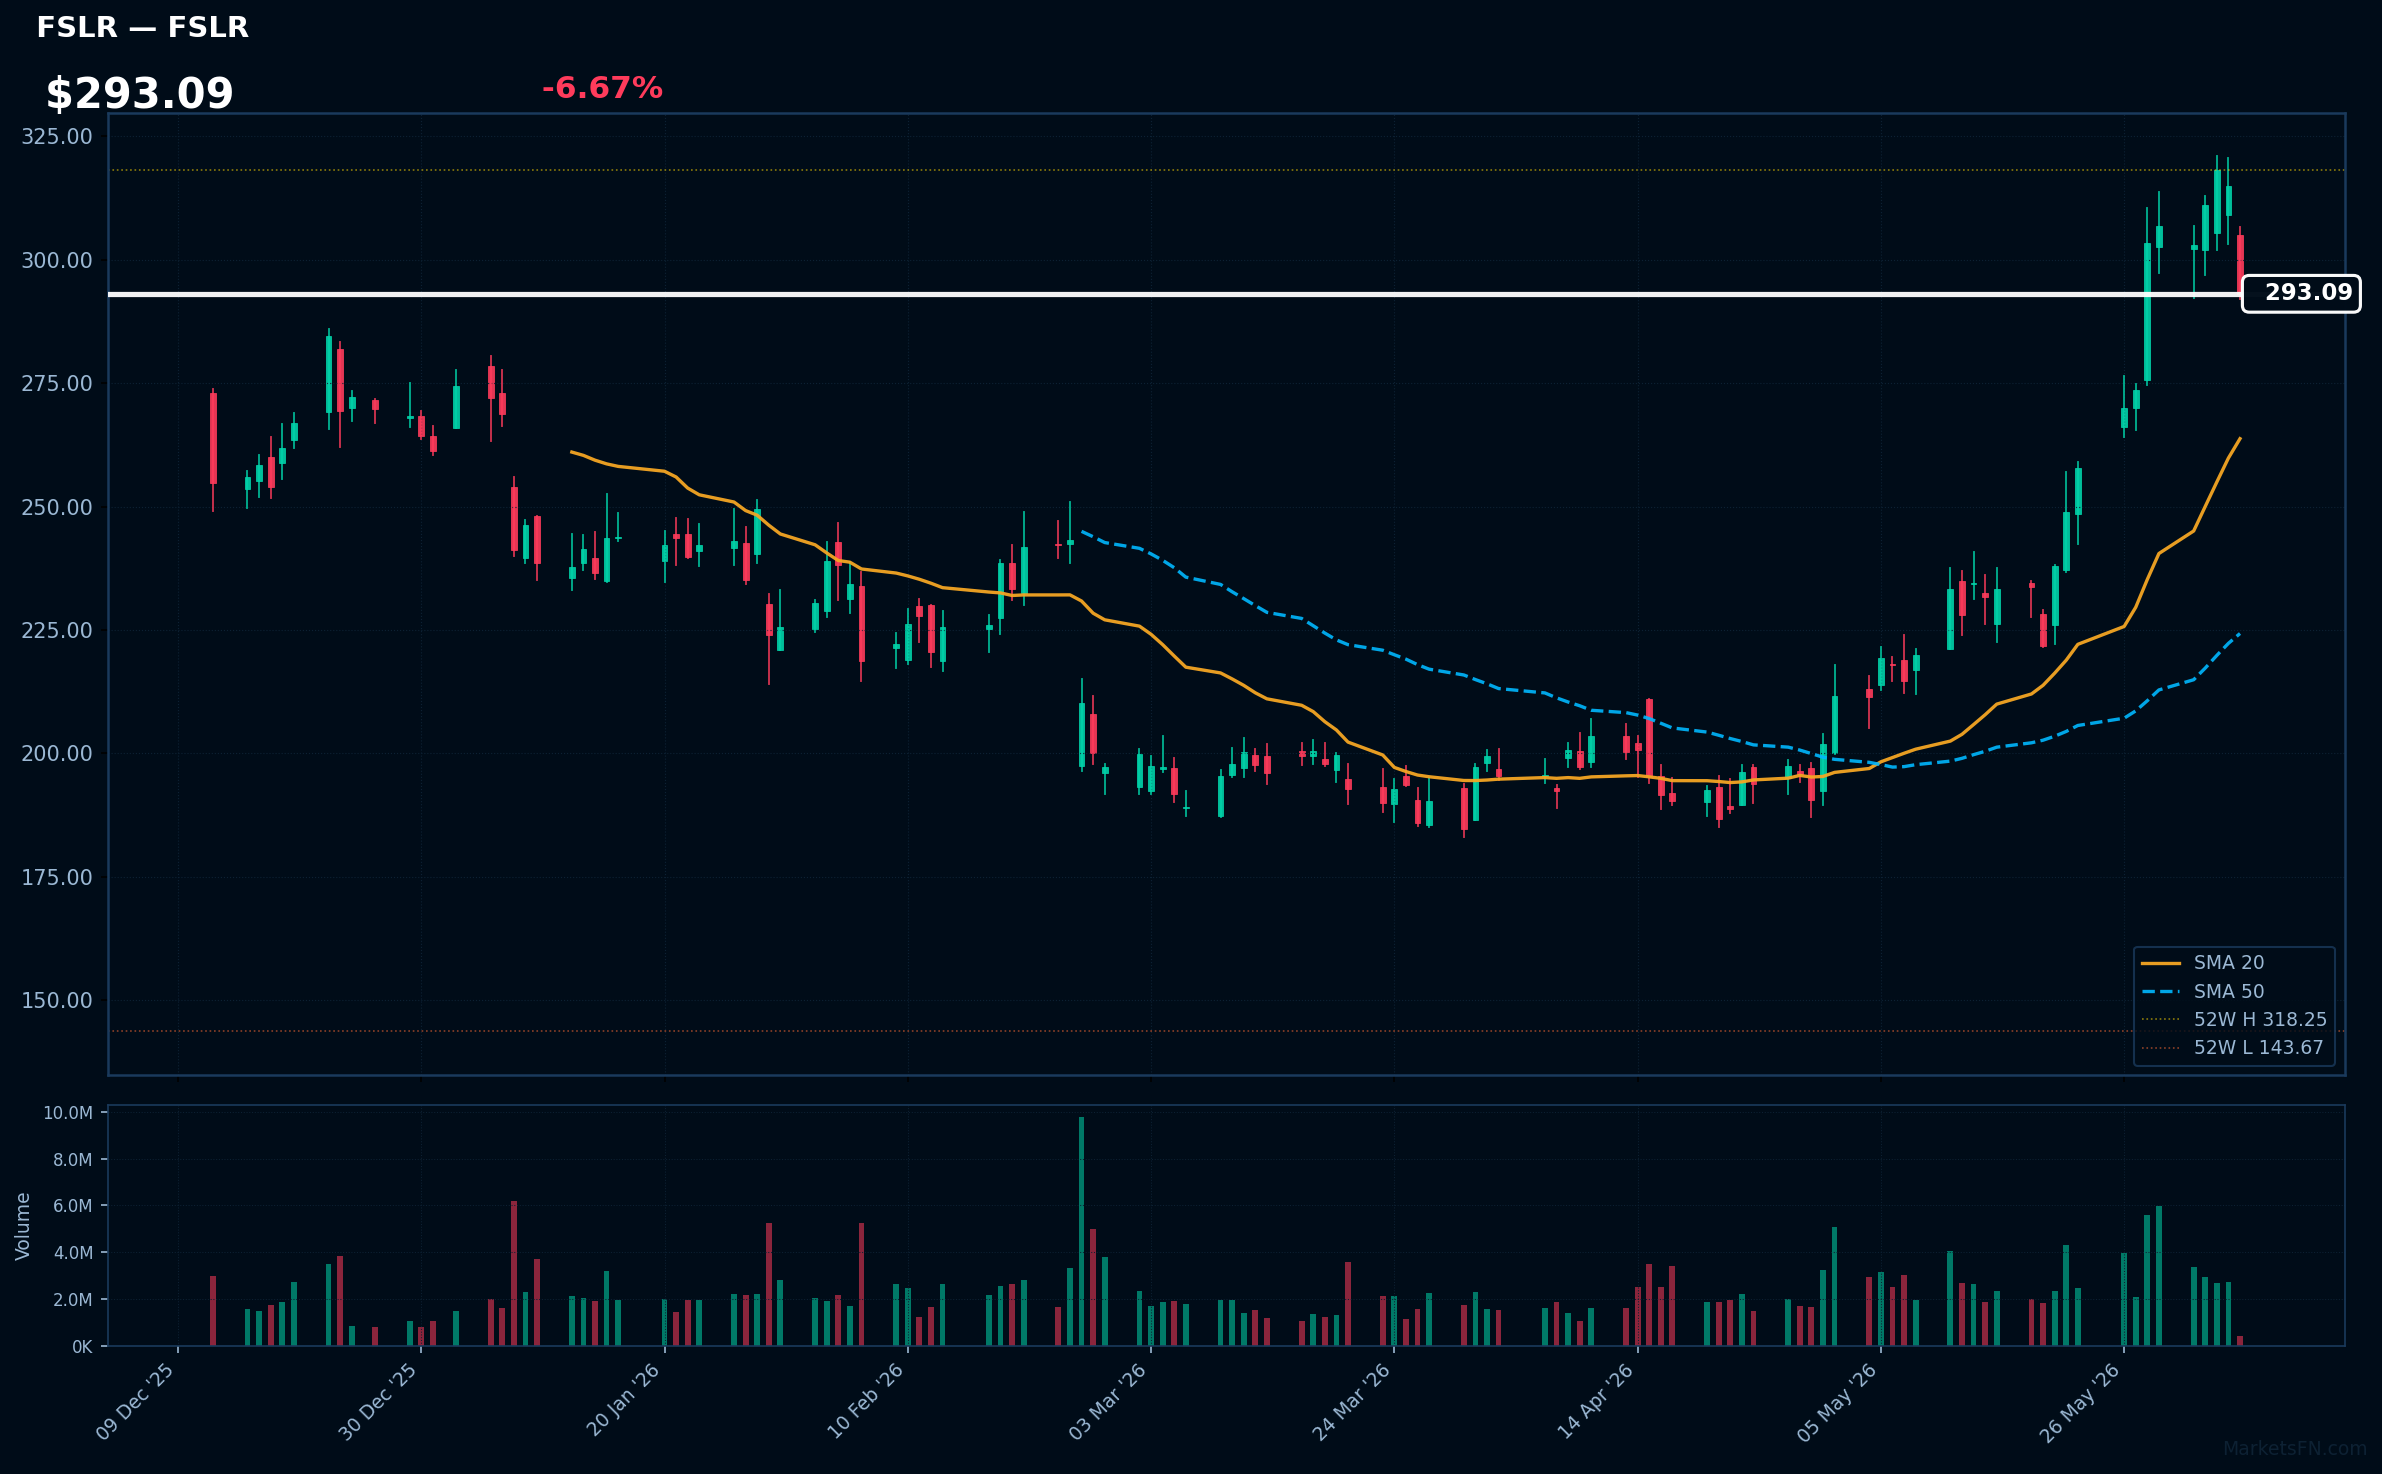
FSLR | First Solar Inc | Technology | Price: $293.93 | Day: -6.67% | 1W: -4.47% | 1M: +34.44% | RSI: 65.2 | vs MA200: +27.6% | Trend: Above MA20, MA50, MA200
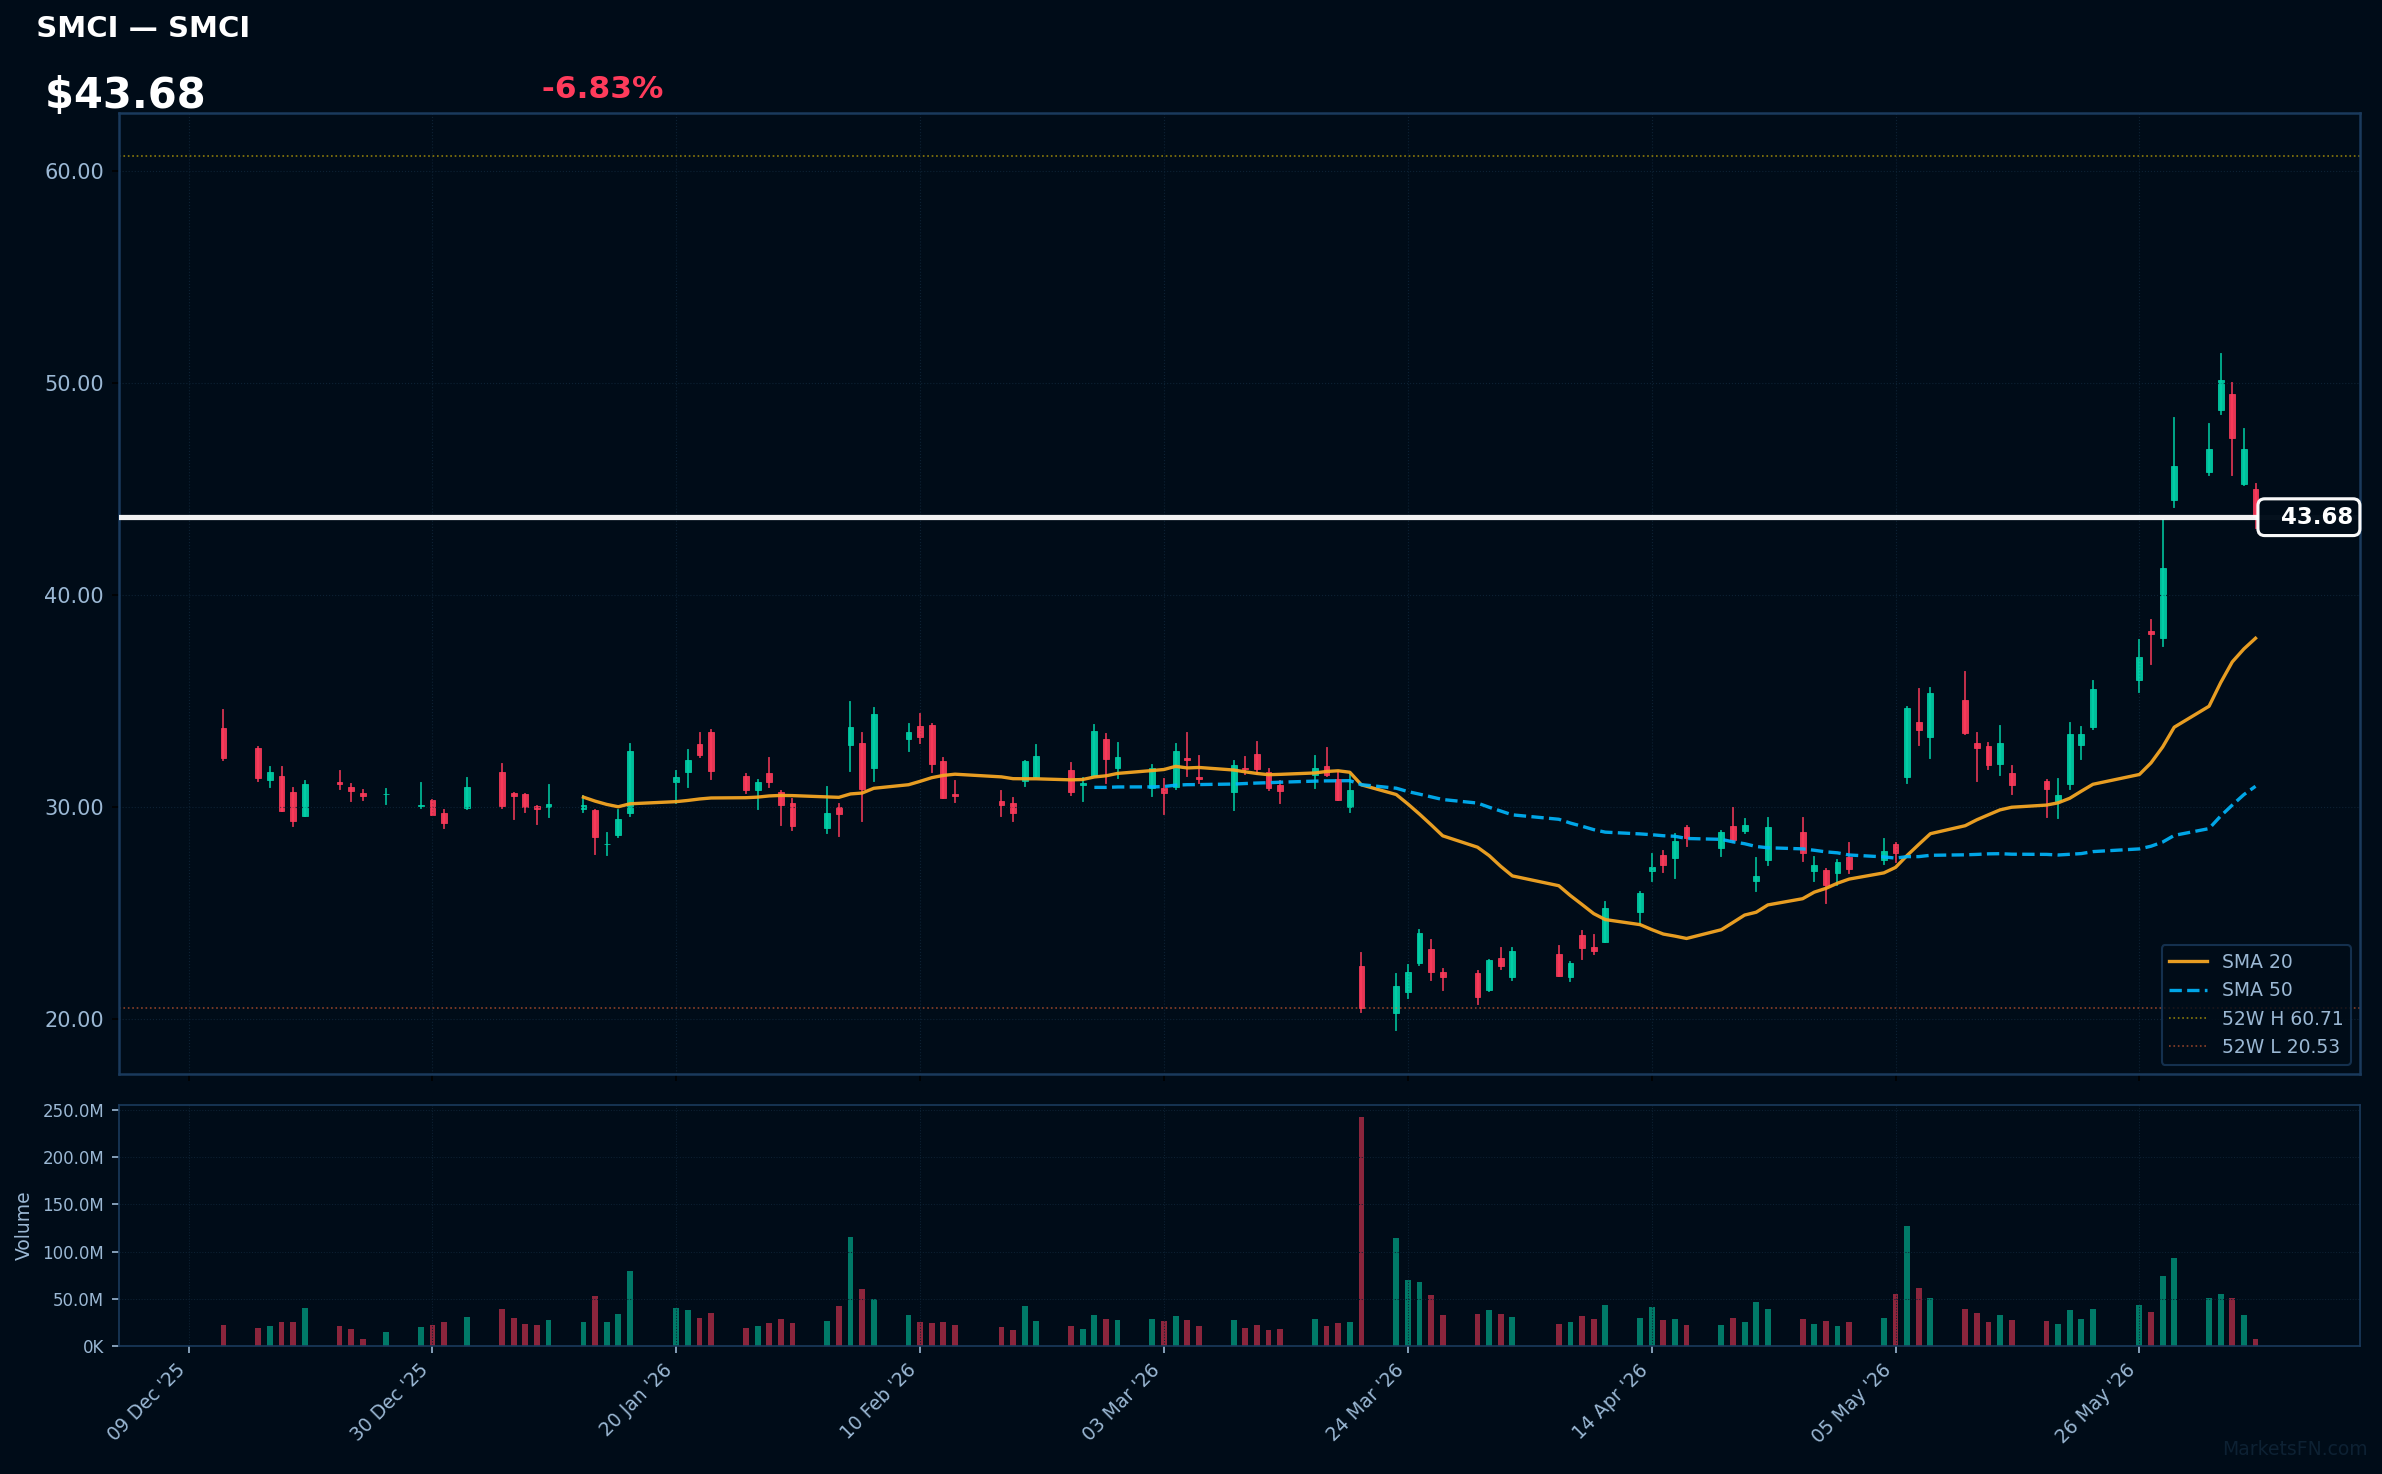
SMCI | Super Micro Computer Inc | Technology | Price: $43.69 | Day: -6.83% | 1W: -5.23% | 1M: +26.02% | RSI: 63.0 | vs MA200: +21.3% | Trend: Above MA20, MA50, MA200
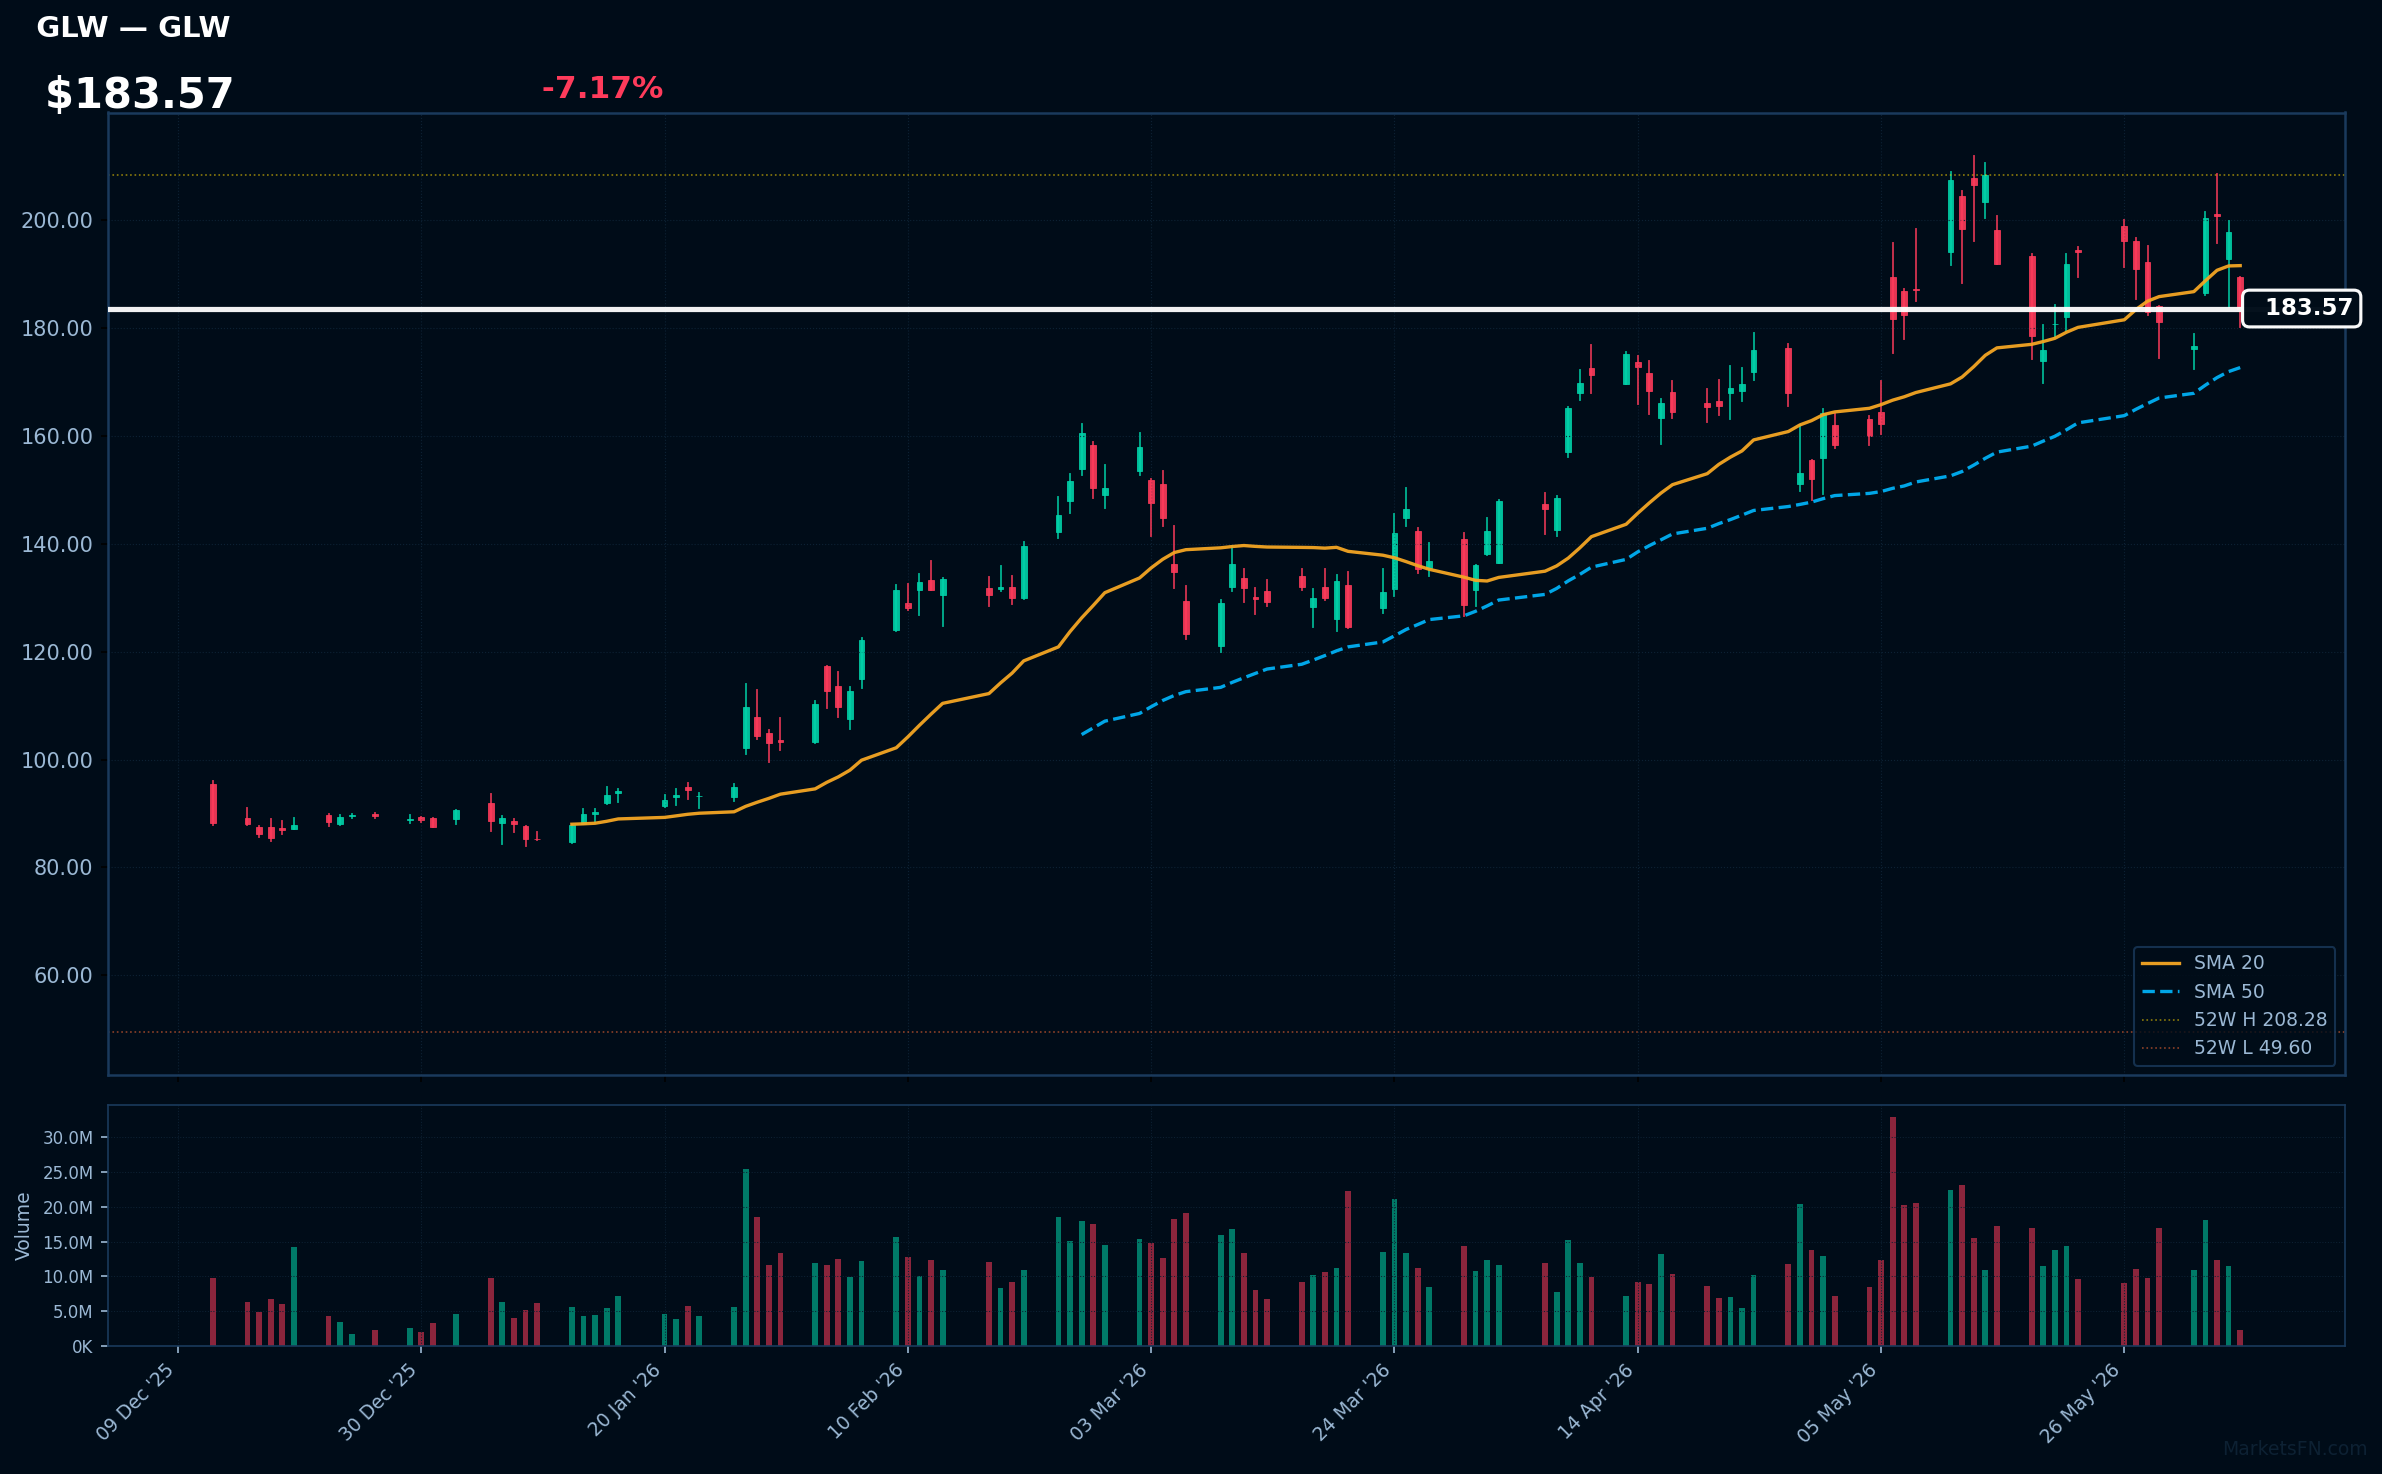
GLW | Corning, Inc | Technology | Price: $183.52 | Day: -7.17% | 1W: +1.33% | 1M: +1.10% | RSI: 49.7 | vs MA200: +58.9% | Trend: Above MA50, MA200 · Below MA20
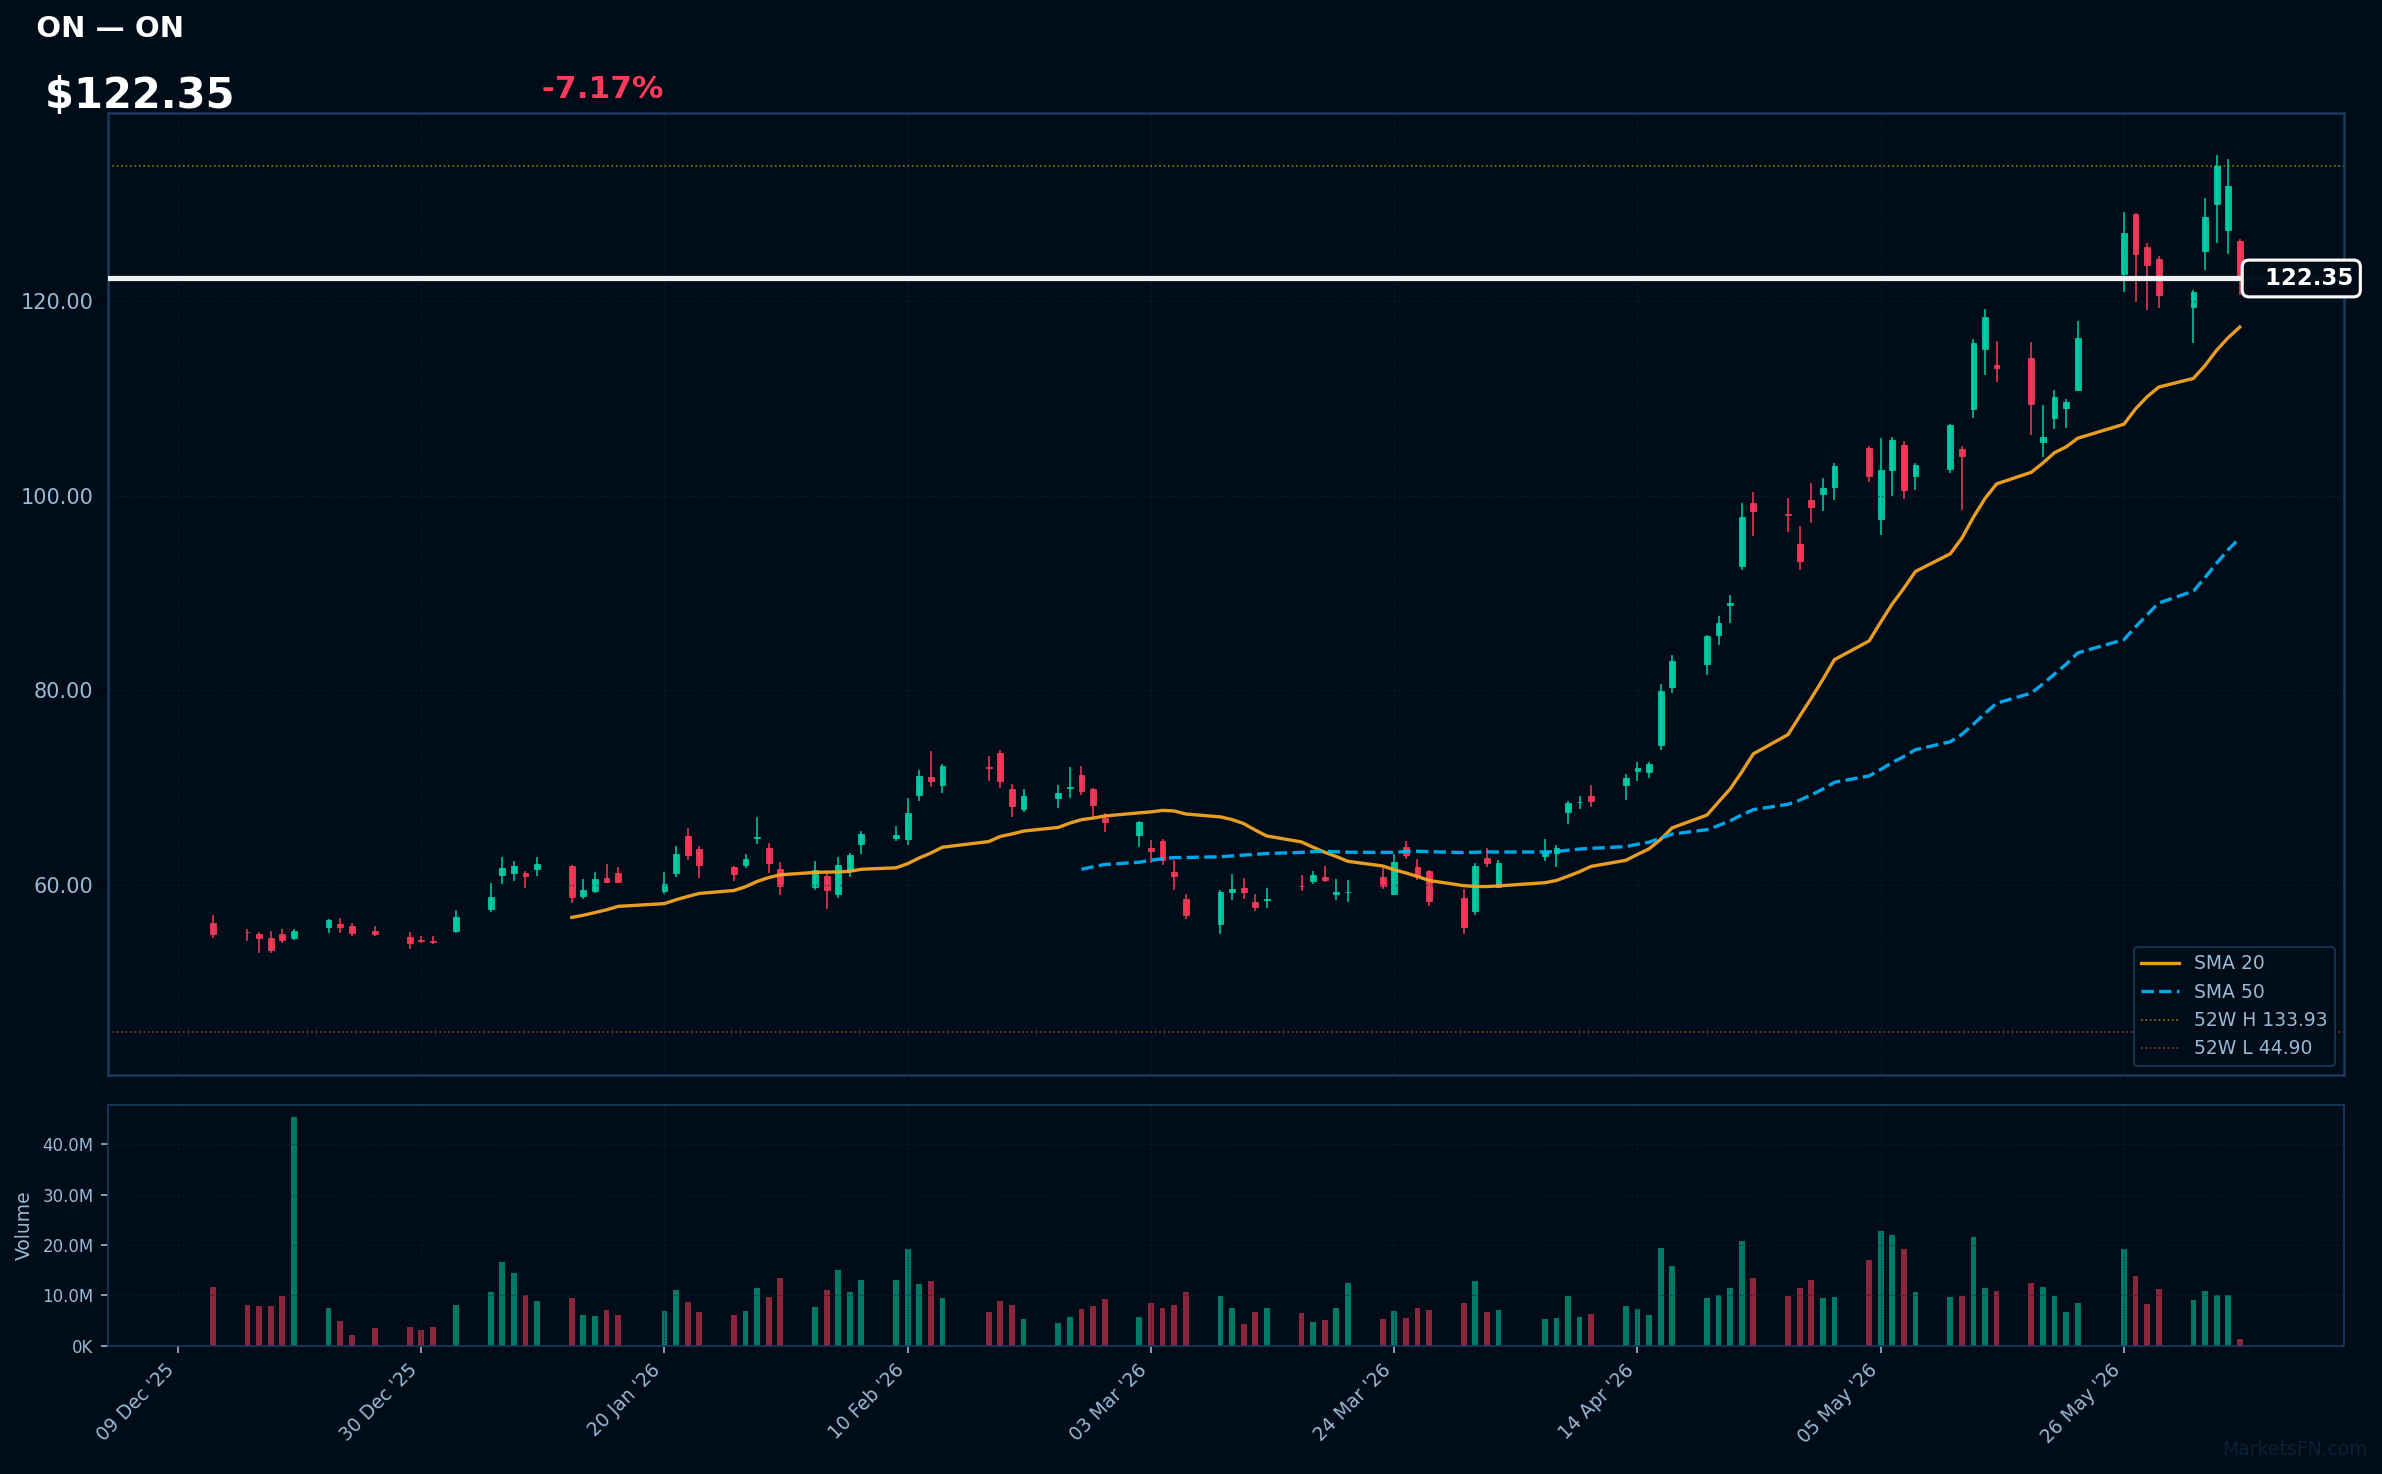
ON | ON Semiconductor Corp | Technology | Price: $122.36 | Day: -7.17% | 1W: +1.43% | 1M: +15.68% | RSI: 58.7 | vs MA200: +86.8% | Trend: Above MA20, MA50, MA200
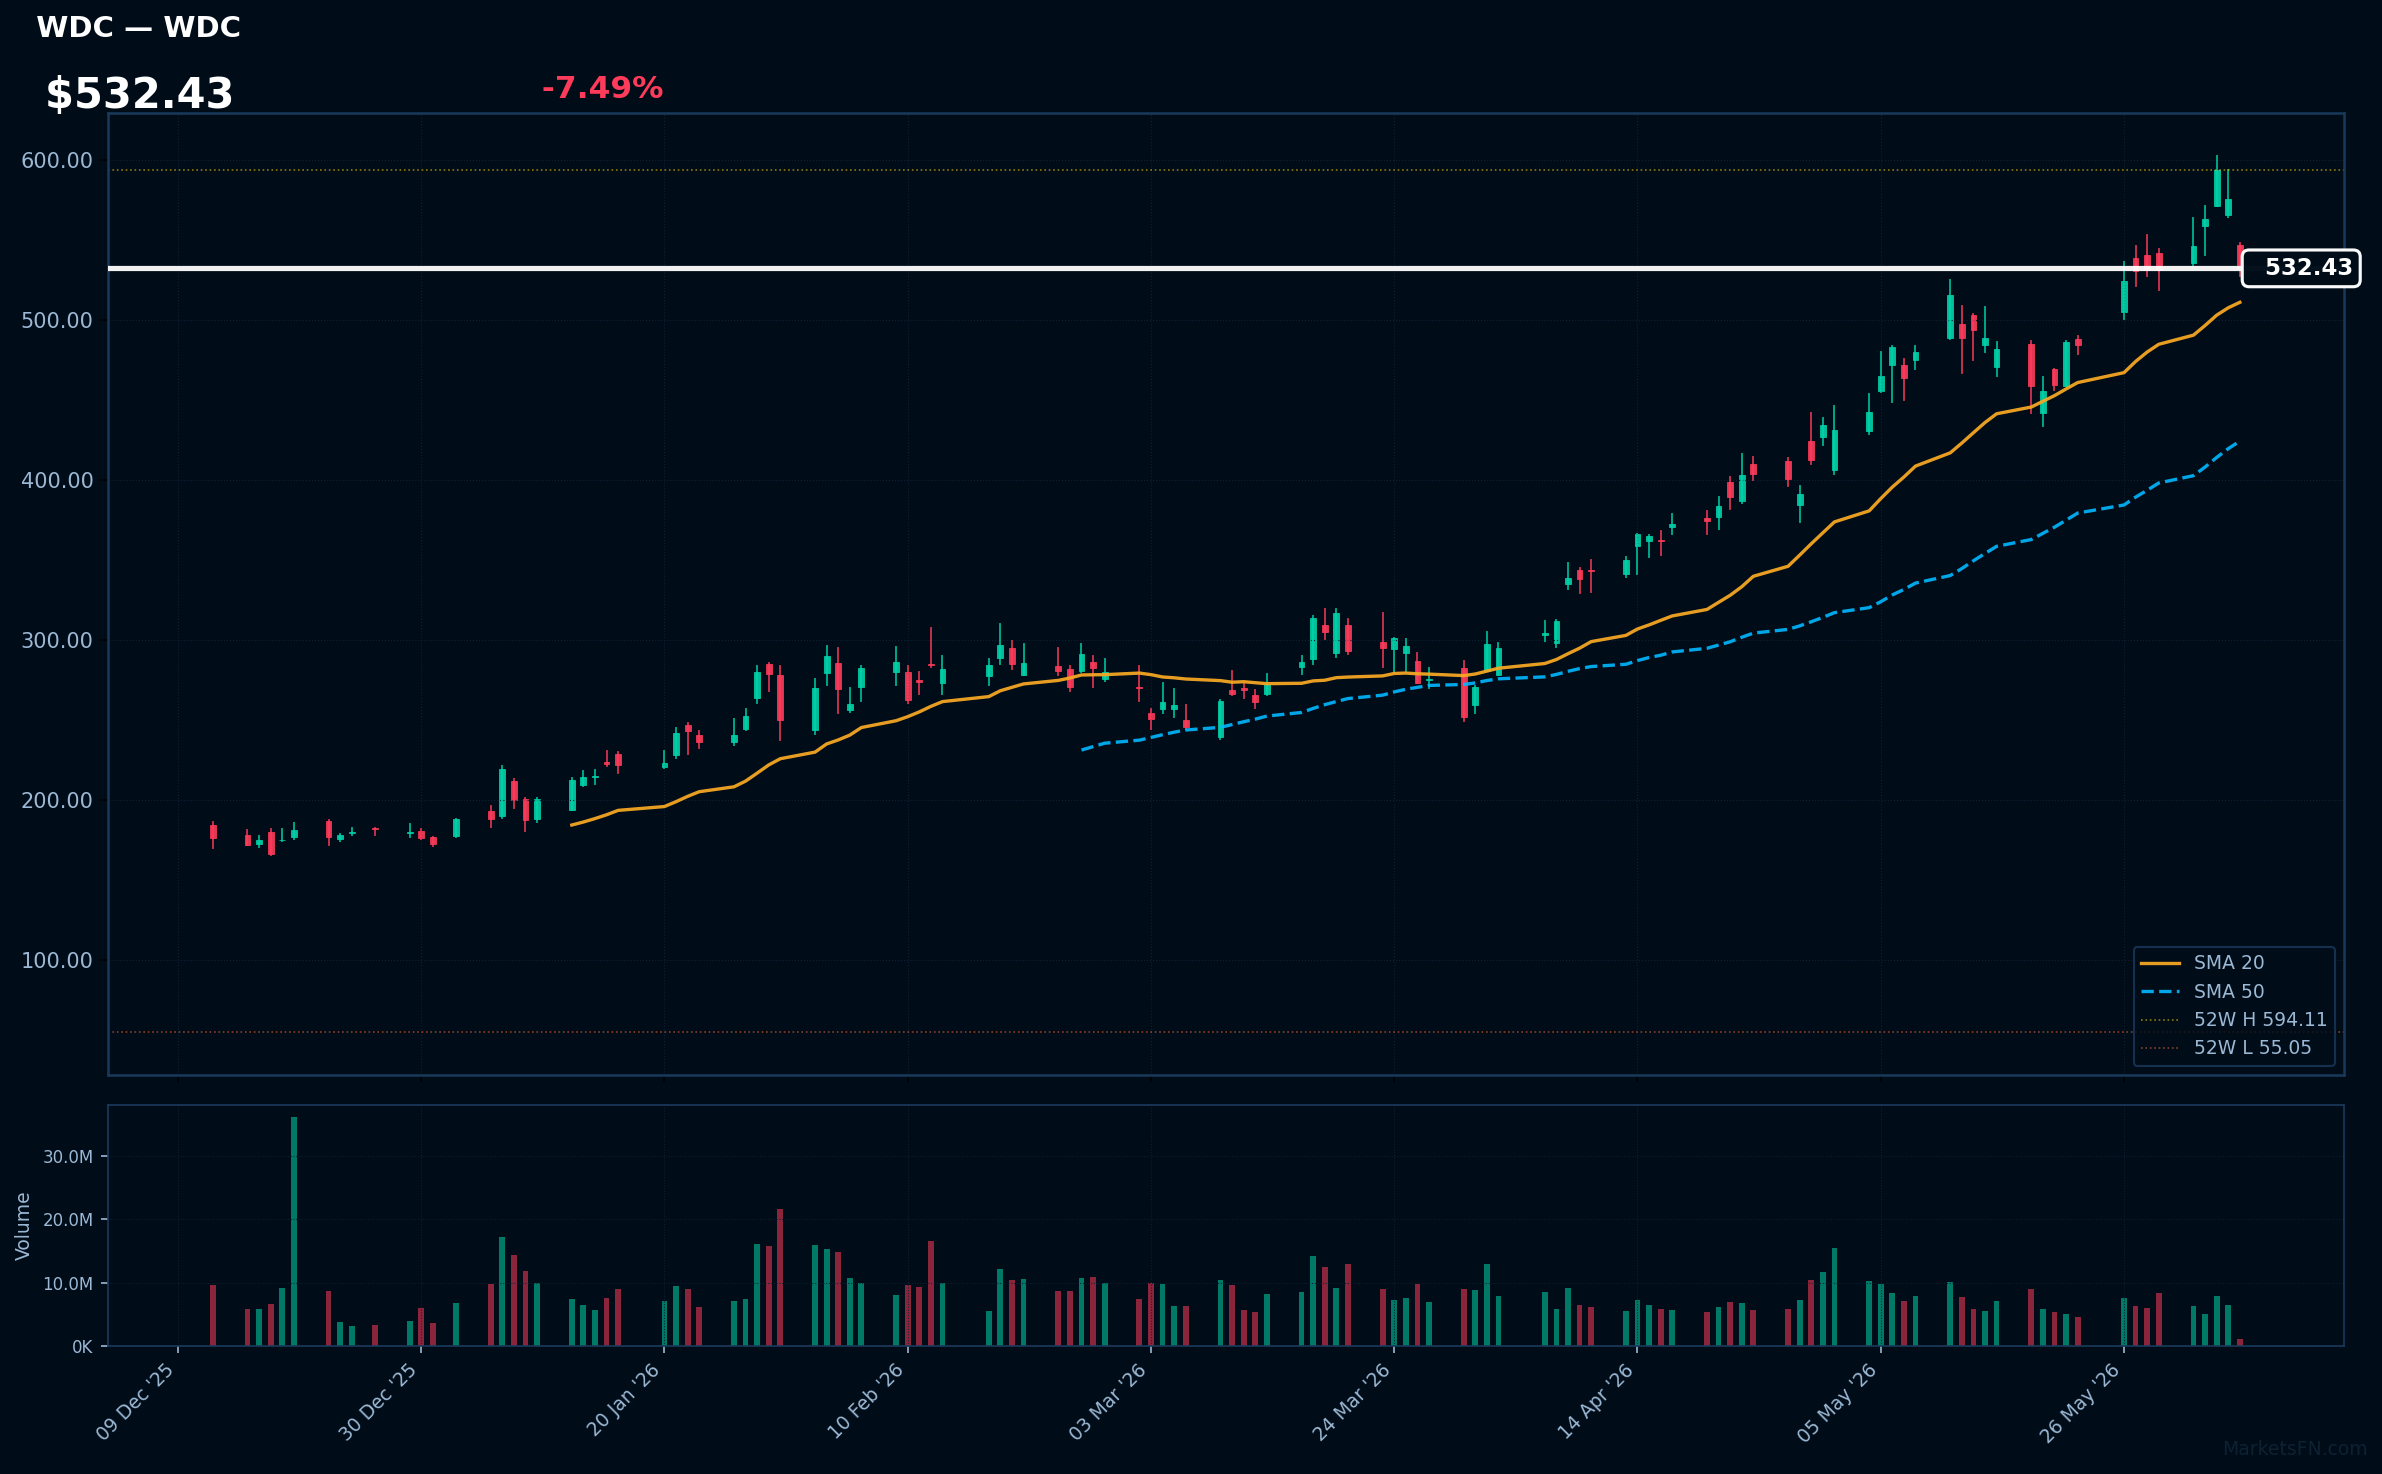
WDC | Western Digital Corp | Technology | Price: $532.40 | Day: -7.49% | 1W: +0.23% | 1M: +10.20% | RSI: 59.2 | vs MA200: +119.4% | Trend: Above MA20, MA50, MA200
Recent headlines (last 12h)
- MU, SNDK, WDC: Memory Stocks Dip As Broadcoms Forecast Dampens AI Sentiment, Retail Turns Buyer
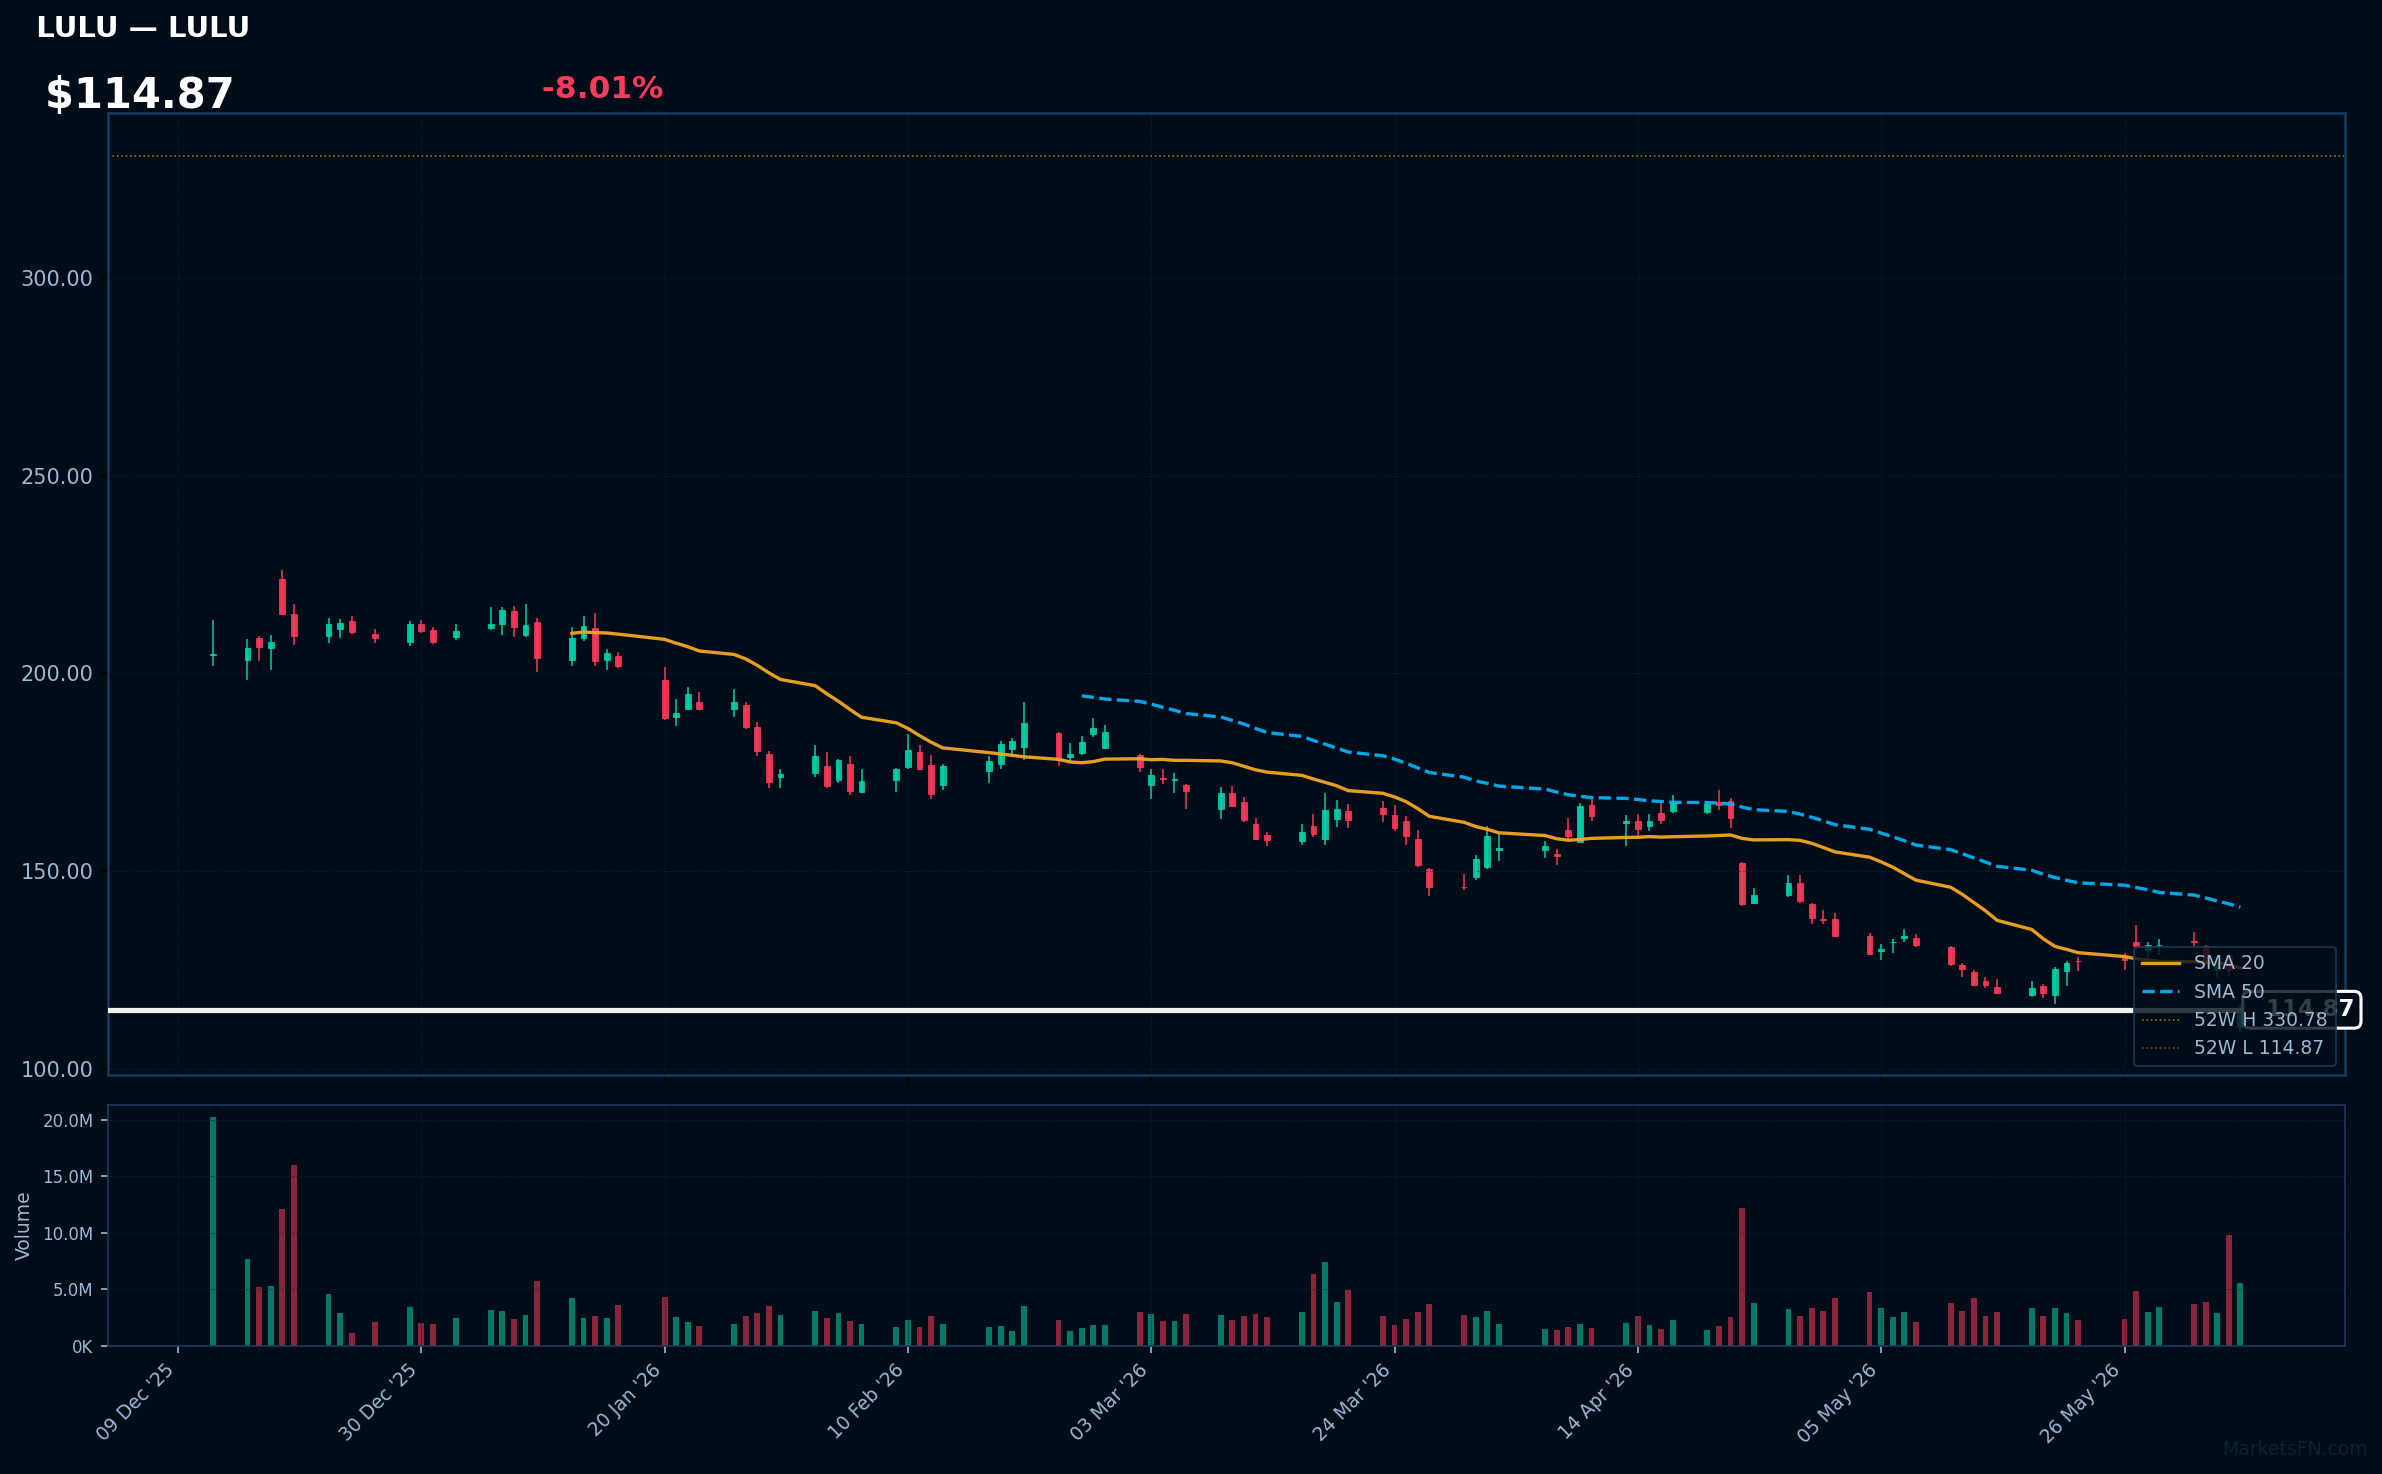
LULU | Lululemon Athletica inc | Consumer Cyclical | Price: $114.91 | Day: -8.01% | 1W: -12.43% | 1M: -13.00% | RSI: 28.0 | vs MA200: -32.9% | Trend: Below MA20, MA50, MA200
Recent headlines (last 12h)
- BTIG downgrades Lululemon as Q2 sales set to fall for first time since COVID
- Tesla upgraded, Lululemon downgraded: Wall Street's top analyst calls
- Lululemon Cuts Profit Outlook as Its Biggest Market Keeps Shrinking
- Lululemon Cuts Outlook as Growth Struggles Continue
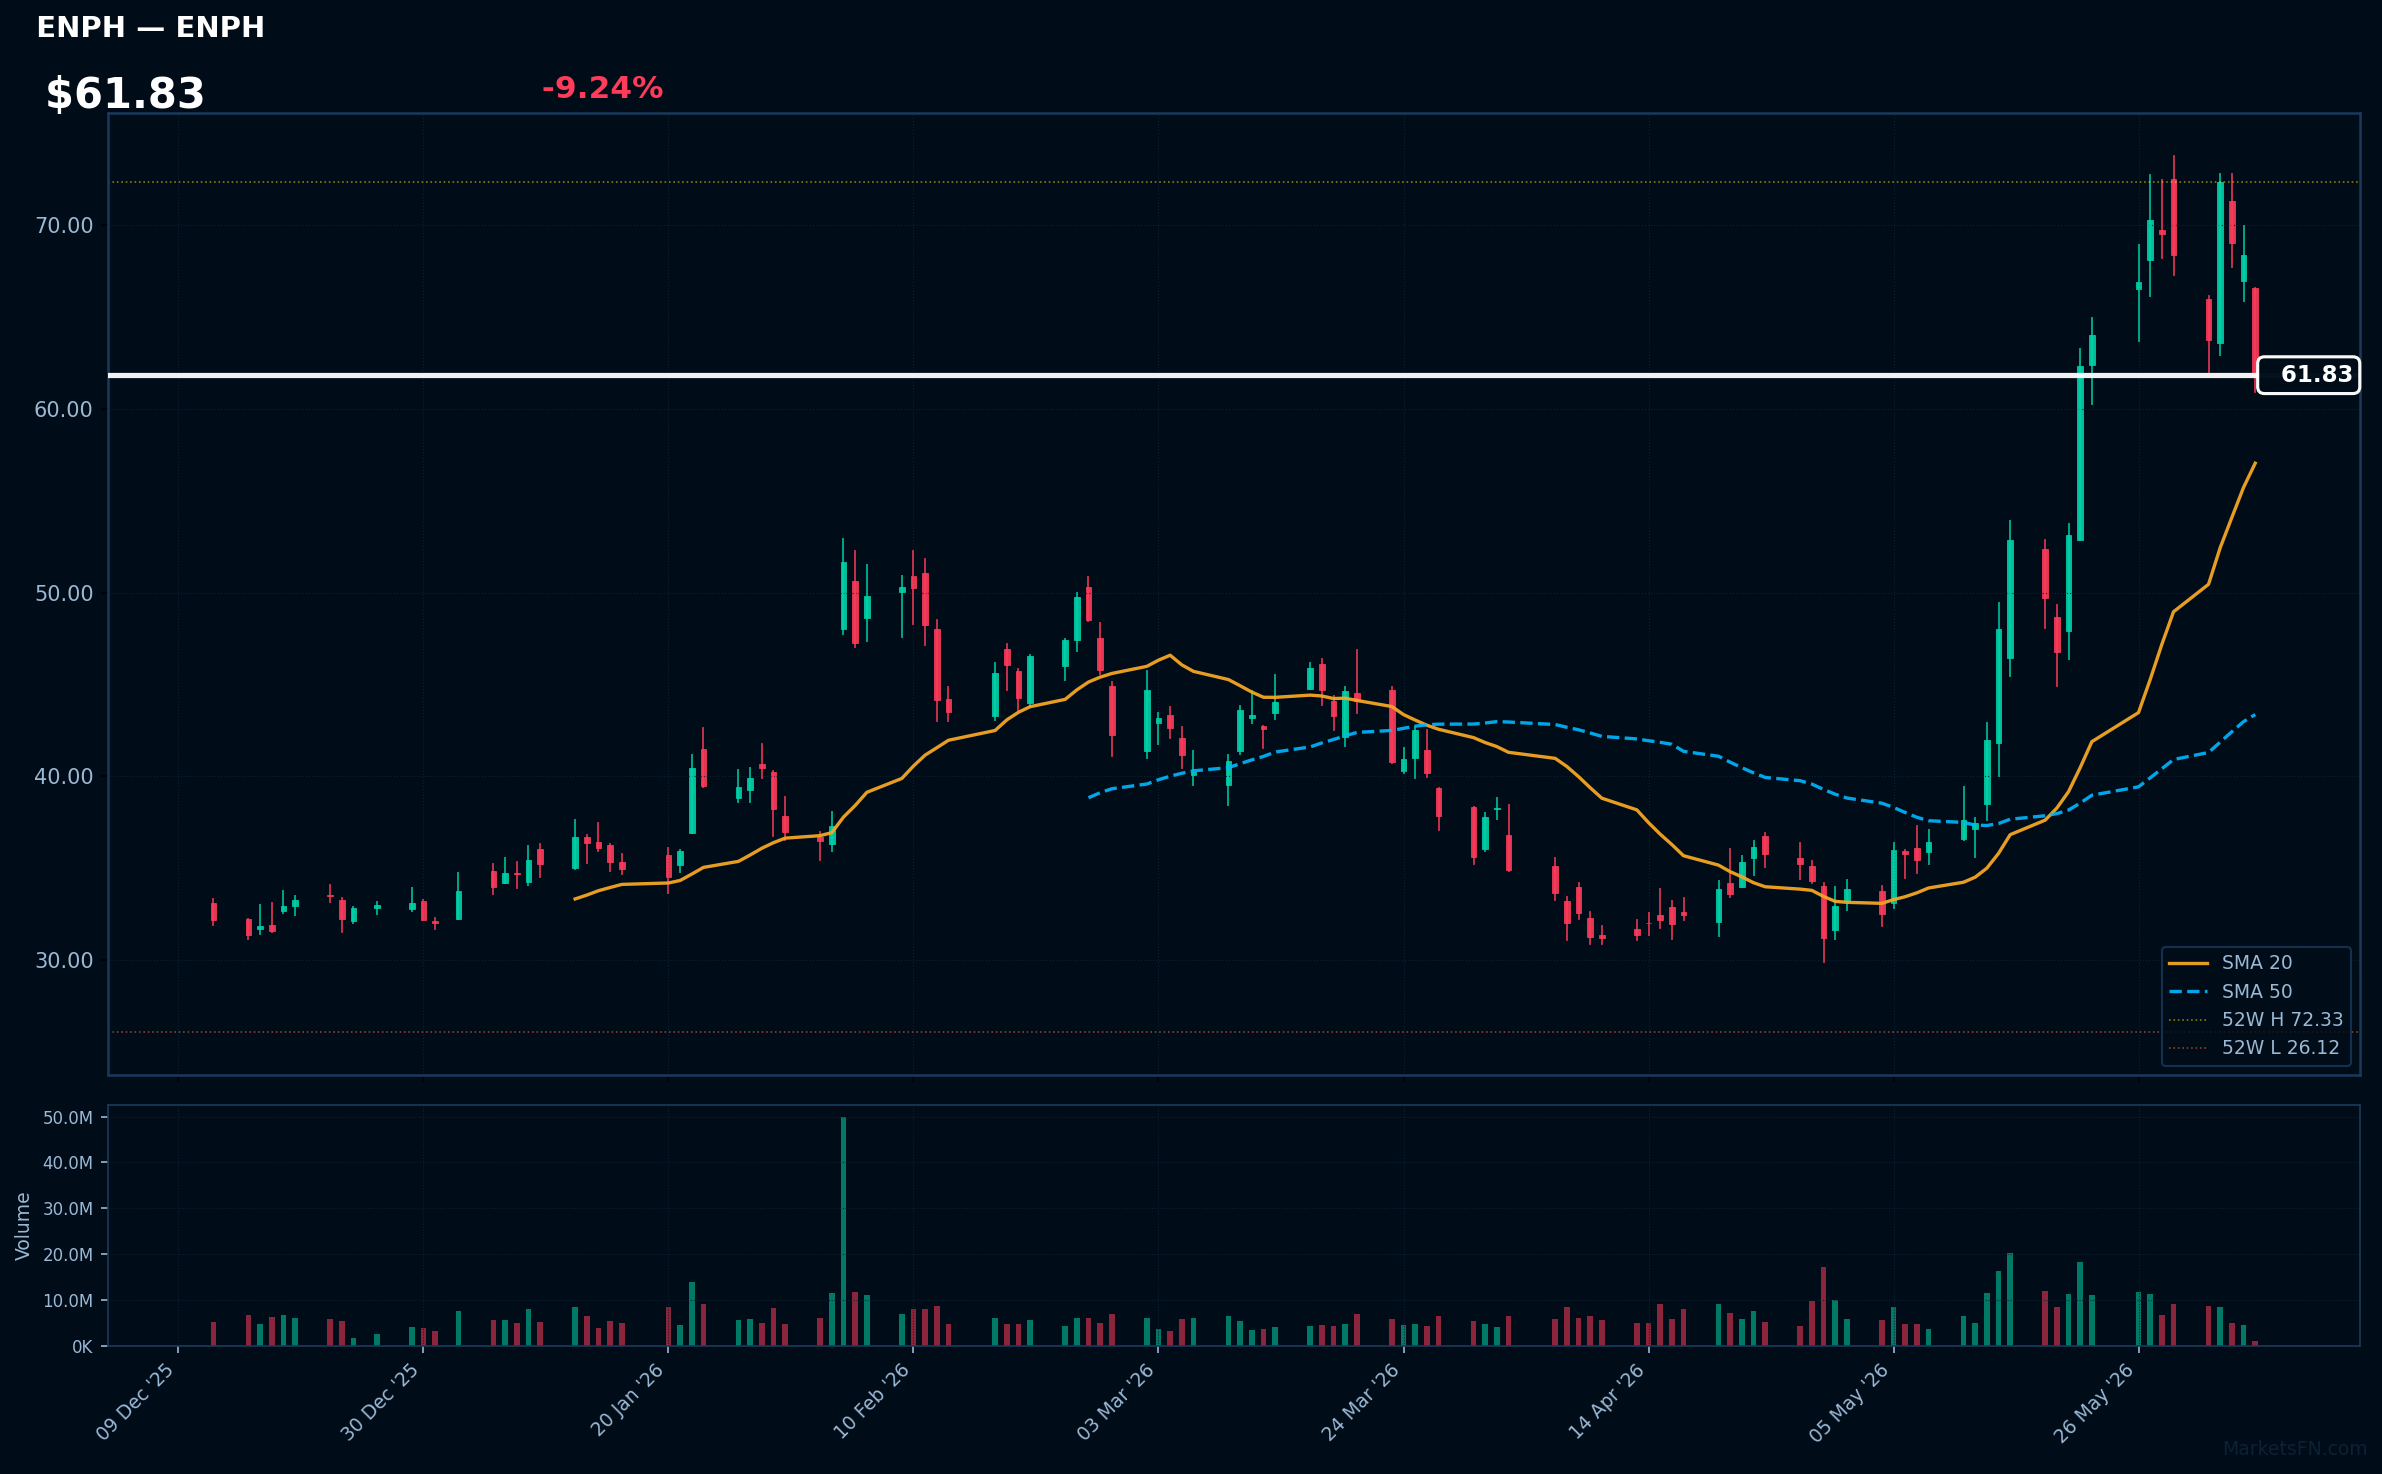
ENPH | Enphase Energy Inc | Technology | Price: $62.07 | Day: -9.24% | 1W: -9.55% | 1M: +72.71% | RSI: 57.8 | vs MA200: +61.0% | Trend: Above MA20, MA50, MA200
Recent headlines (last 12h)
- Tech Rally Fades, Killing Market's Winning Streak-and There Are More Risks Ahead
Market Commentary
The S&P 500 session on June 05, 2026, showed a near-balanced breadth with 249 advancing issues (50.2%) versus 243 declining issues (49.0%), indicating a neutral tone. The average daily change was a modest 0.31%, suggesting a lack of strong directional conviction.
Sector rotation was evident, with Healthcare, Consumer Cyclical, and Real Estate stocks leading gains, while Technology stocks dominated the losers list. Top gainers included COO, CMG, and PODD, while AMD, INTC, and MU were among the biggest decliners. This rotation suggests a potential shift in investor preference towards more defensive or cyclical sectors.
Traders should monitor the MA200 level, as only 2.6% of stocks (13 out of 496) are currently trading above it. A sustained move above this level could indicate a broader market recovery. Conversely, a failure to break above it may signal continued weakness. The next catalyst will be the upcoming earnings reports from key Technology sector players, which could validate or invalidate the current sector rotation trend.
Methodology
Daily ranking uses the latest session close versus the prior close. RSI (14-day EWM), MA20, MA50, and MA200 are computed from 12 months of daily OHLCV data sourced from Yahoo Finance. Charts show the last 120 trading sessions with SMA 20/50, 52-week H/L markers, and volume. Recent news (last 12 h) is sourced from FinViz. Updated every trading day.
Disclaimer
The content on MarketsFN.com is provided for educational and informational purposes only. It does not constitute financial advice, investment recommendations, or trading guidance. All investments involve risks, and past performance does not guarantee future results. You are solely responsible for your investment decisions and should conduct independent research and consult a qualified financial advisor before acting. MarketsFN.com and its authors are not liable for any losses or damages arising from your use of this information.
Related Articles
- Guidewire Software Inc. (GWRE) Sinks 5.54% After Earnings — Post Earning Analysis Guidewire Software Inc. (GWRE) Sinks 5.54% After Earnings Guidewire Software, Inc. specializes in…
- Guidewire Software (GWRE) GWRE Q3 Financial Results Summary — Guidewire (GWRE) Q3 2026: Revenue Surge, Profitability Mixed — Cautiously Optimistic Guidewire (NYSE: GWRE) reported…
- Guidewire (GWRE) GWRE Q3 Financial Results Summary — Guidewire (GWRE) Q3 2026: Revenue Growth Accelerates, Profitability Mixed — Positive Outlook Guidewire (NYSE: GWRE)…
- LULULEMON ATHLETICA INC. (LULU) Q1 2026 Financial Results Summary — lululemon athletica inc. (LULU) Q1 2026: Revenue Growth Amidst Declining Profitability — Disappointing Quarter for…
- Planet Labs PBC (PL) Q1 2027 Financial Results Summary — Planet Labs PBC (PL) Q1 2027: Record Revenue Growth — Strong Momentum Planet Labs PBC (NYSE: PL) reported a remarkable…