S&P 500 Bull & Bear Radar — May 11, 2026
· Stocks · QuoteReporter
S&P 500 Bull & Bear Radar — May 11, 2026
A daily technical sweep of 497 S&P 500 constituents ranked by session performance, enriched with RSI, MA20/MA50/MA200 trend signals, Bloomberg-style charts, and recent news.
Index-Wide Breadth
| Constituents tracked | 497 |
| Advancing | 213 (42.9%) |
| Declining | 282 (56.7%) |
| Average daily change | 0.28% |
| Above MA200 | 12 (2.4%) |
Top 10 Gainers
Today's strongest S&P 500 performers. Sector leadership: Technology (6), Basic Materials (2), Healthcare (1), Consumer Defensive (1).
| Ticker | Company | Sector | Price | Day % | 1W % | 1M % | RSI | vs MA200 | Trend |
|---|---|---|---|---|---|---|---|---|---|
| QCOM | Qualcomm, Inc | Technology | $237.99 | +8.63% | +40.53% | +84.77% | 88.3 | +50.6% | Above MA20, MA50, MA200 |
| WDC | Western Digital Corp | Technology | $515.47 | +7.39% | +16.55% | +50.12% | 80.6 | +153.6% | Above MA20, MA50, MA200 |
| GLW | Corning, Inc | Technology | $200.45 | +7.23% | +25.24% | +16.99% | 72.0 | +92.8% | Above MA20, MA50, MA200 |
| ALB | Albemarle Corp | Basic Materials | $215.39 | +5.83% | +12.91% | +24.00% | 64.9 | +61.3% | Above MA20, MA50, MA200 |
| MRNA | Moderna Inc | Healthcare | $57.52 | +5.83% | +21.54% | +12.81% | 65.8 | +58.7% | Above MA20, MA50, MA200 |
| STX | Seagate Technology Holdings Plc | Technology | $826.95 | +5.66% | +12.11% | +64.57% | 84.7 | +154.6% | Above MA20, MA50, MA200 |
| MU | Micron Technology Inc | Technology | $788.43 | +5.57% | +36.82% | +87.52% | 85.6 | +168.2% | Above MA20, MA50, MA200 |
| CF | CF Industries Holdings Inc | Basic Materials | $121.07 | +5.26% | -3.83% | -0.21% | 49.3 | +27.3% | Above MA200 · Below MA20, MA50 |
| FSLR | First Solar Inc | Technology | $231.49 | +5.25% | +9.51% | +13.77% | 70.0 | +3.7% | Above MA20, MA50, MA200 |
| PM | Philip Morris International Inc | Consumer Defensive | $178.97 | +4.67% | +5.64% | +11.39% | 66.9 | +9.0% | Above MA20, MA50, MA200 |
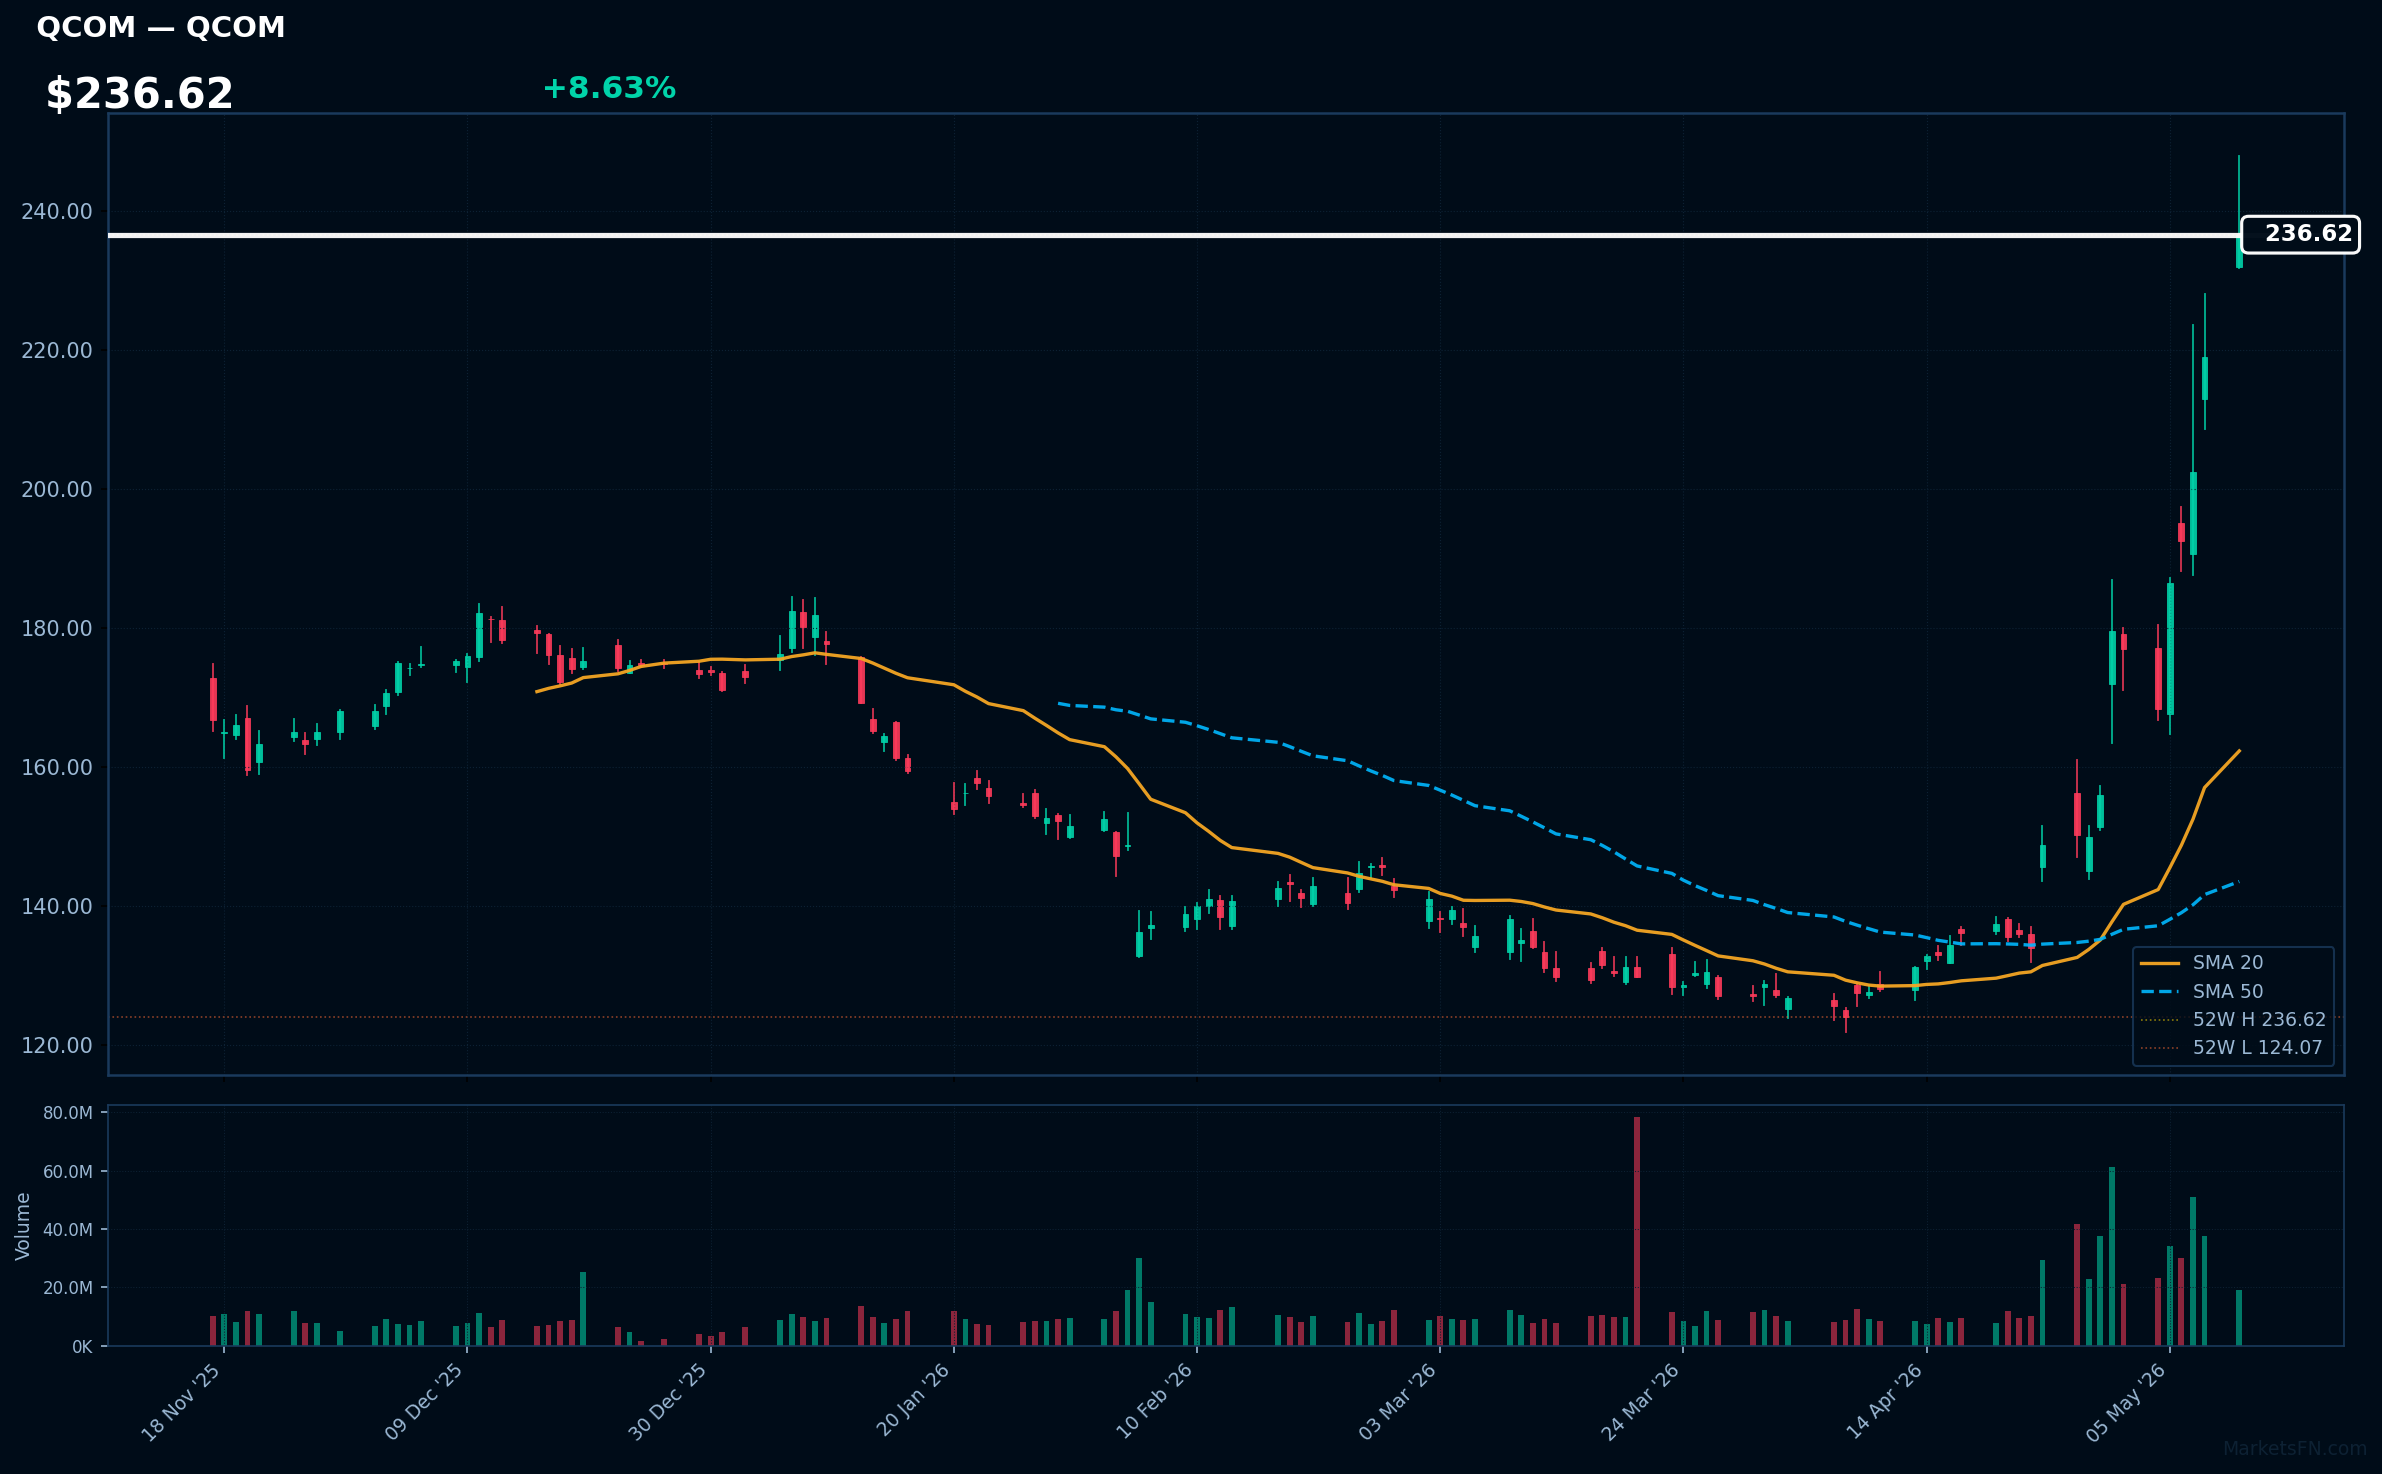
QCOM | Qualcomm, Inc | Technology | Price: $237.99 | Day: +8.63% | 1W: +40.53% | 1M: +84.77% | RSI: 88.3 | vs MA200: +50.6% | Trend: Above MA20, MA50, MA200
Recent headlines (last 12h)
- Today Is All About Chip Stocks-Again
- Qualcomms 70% Rally May Be Just the Start
- AI chip stocks surge as investors refocus on growth
- S&P 500 set for muted open as Trump brands Iran offer 'totally unacceptable'
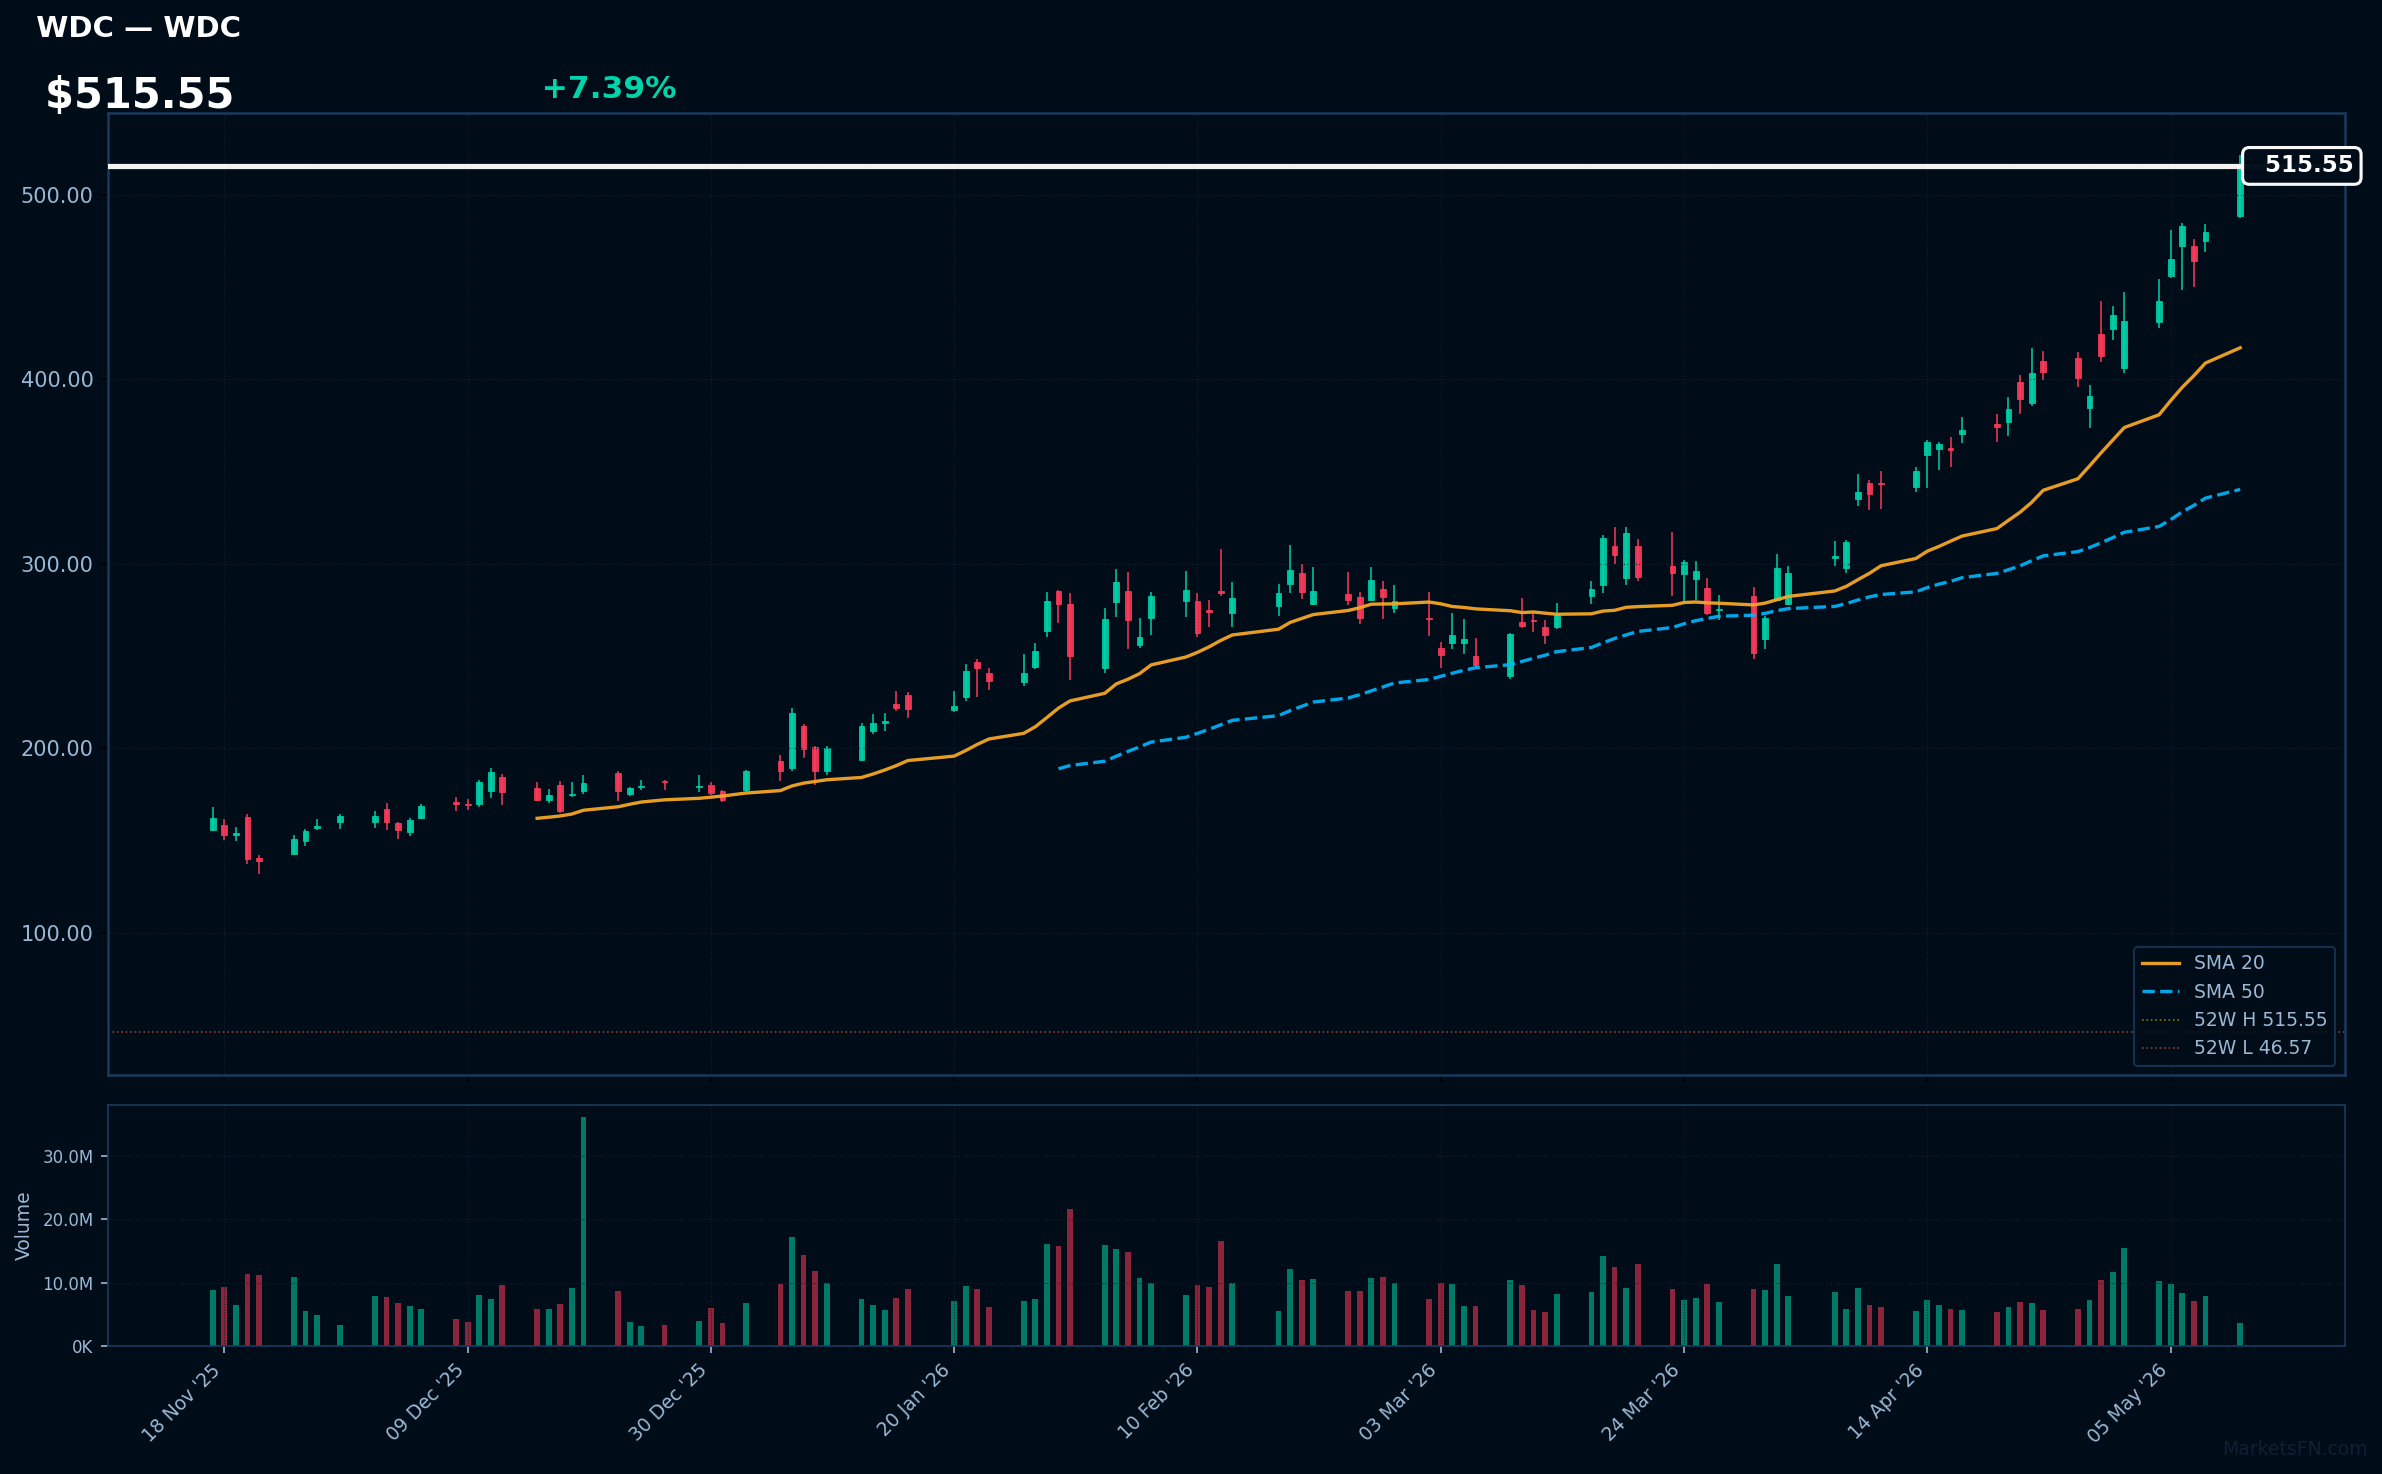
WDC | Western Digital Corp | Technology | Price: $515.47 | Day: +7.39% | 1W: +16.55% | 1M: +50.12% | RSI: 80.6 | vs MA200: +153.6% | Trend: Above MA20, MA50, MA200
Recent headlines (last 12h)
- S&P 500 set for muted open as Trump brands Iran offer 'totally unacceptable'
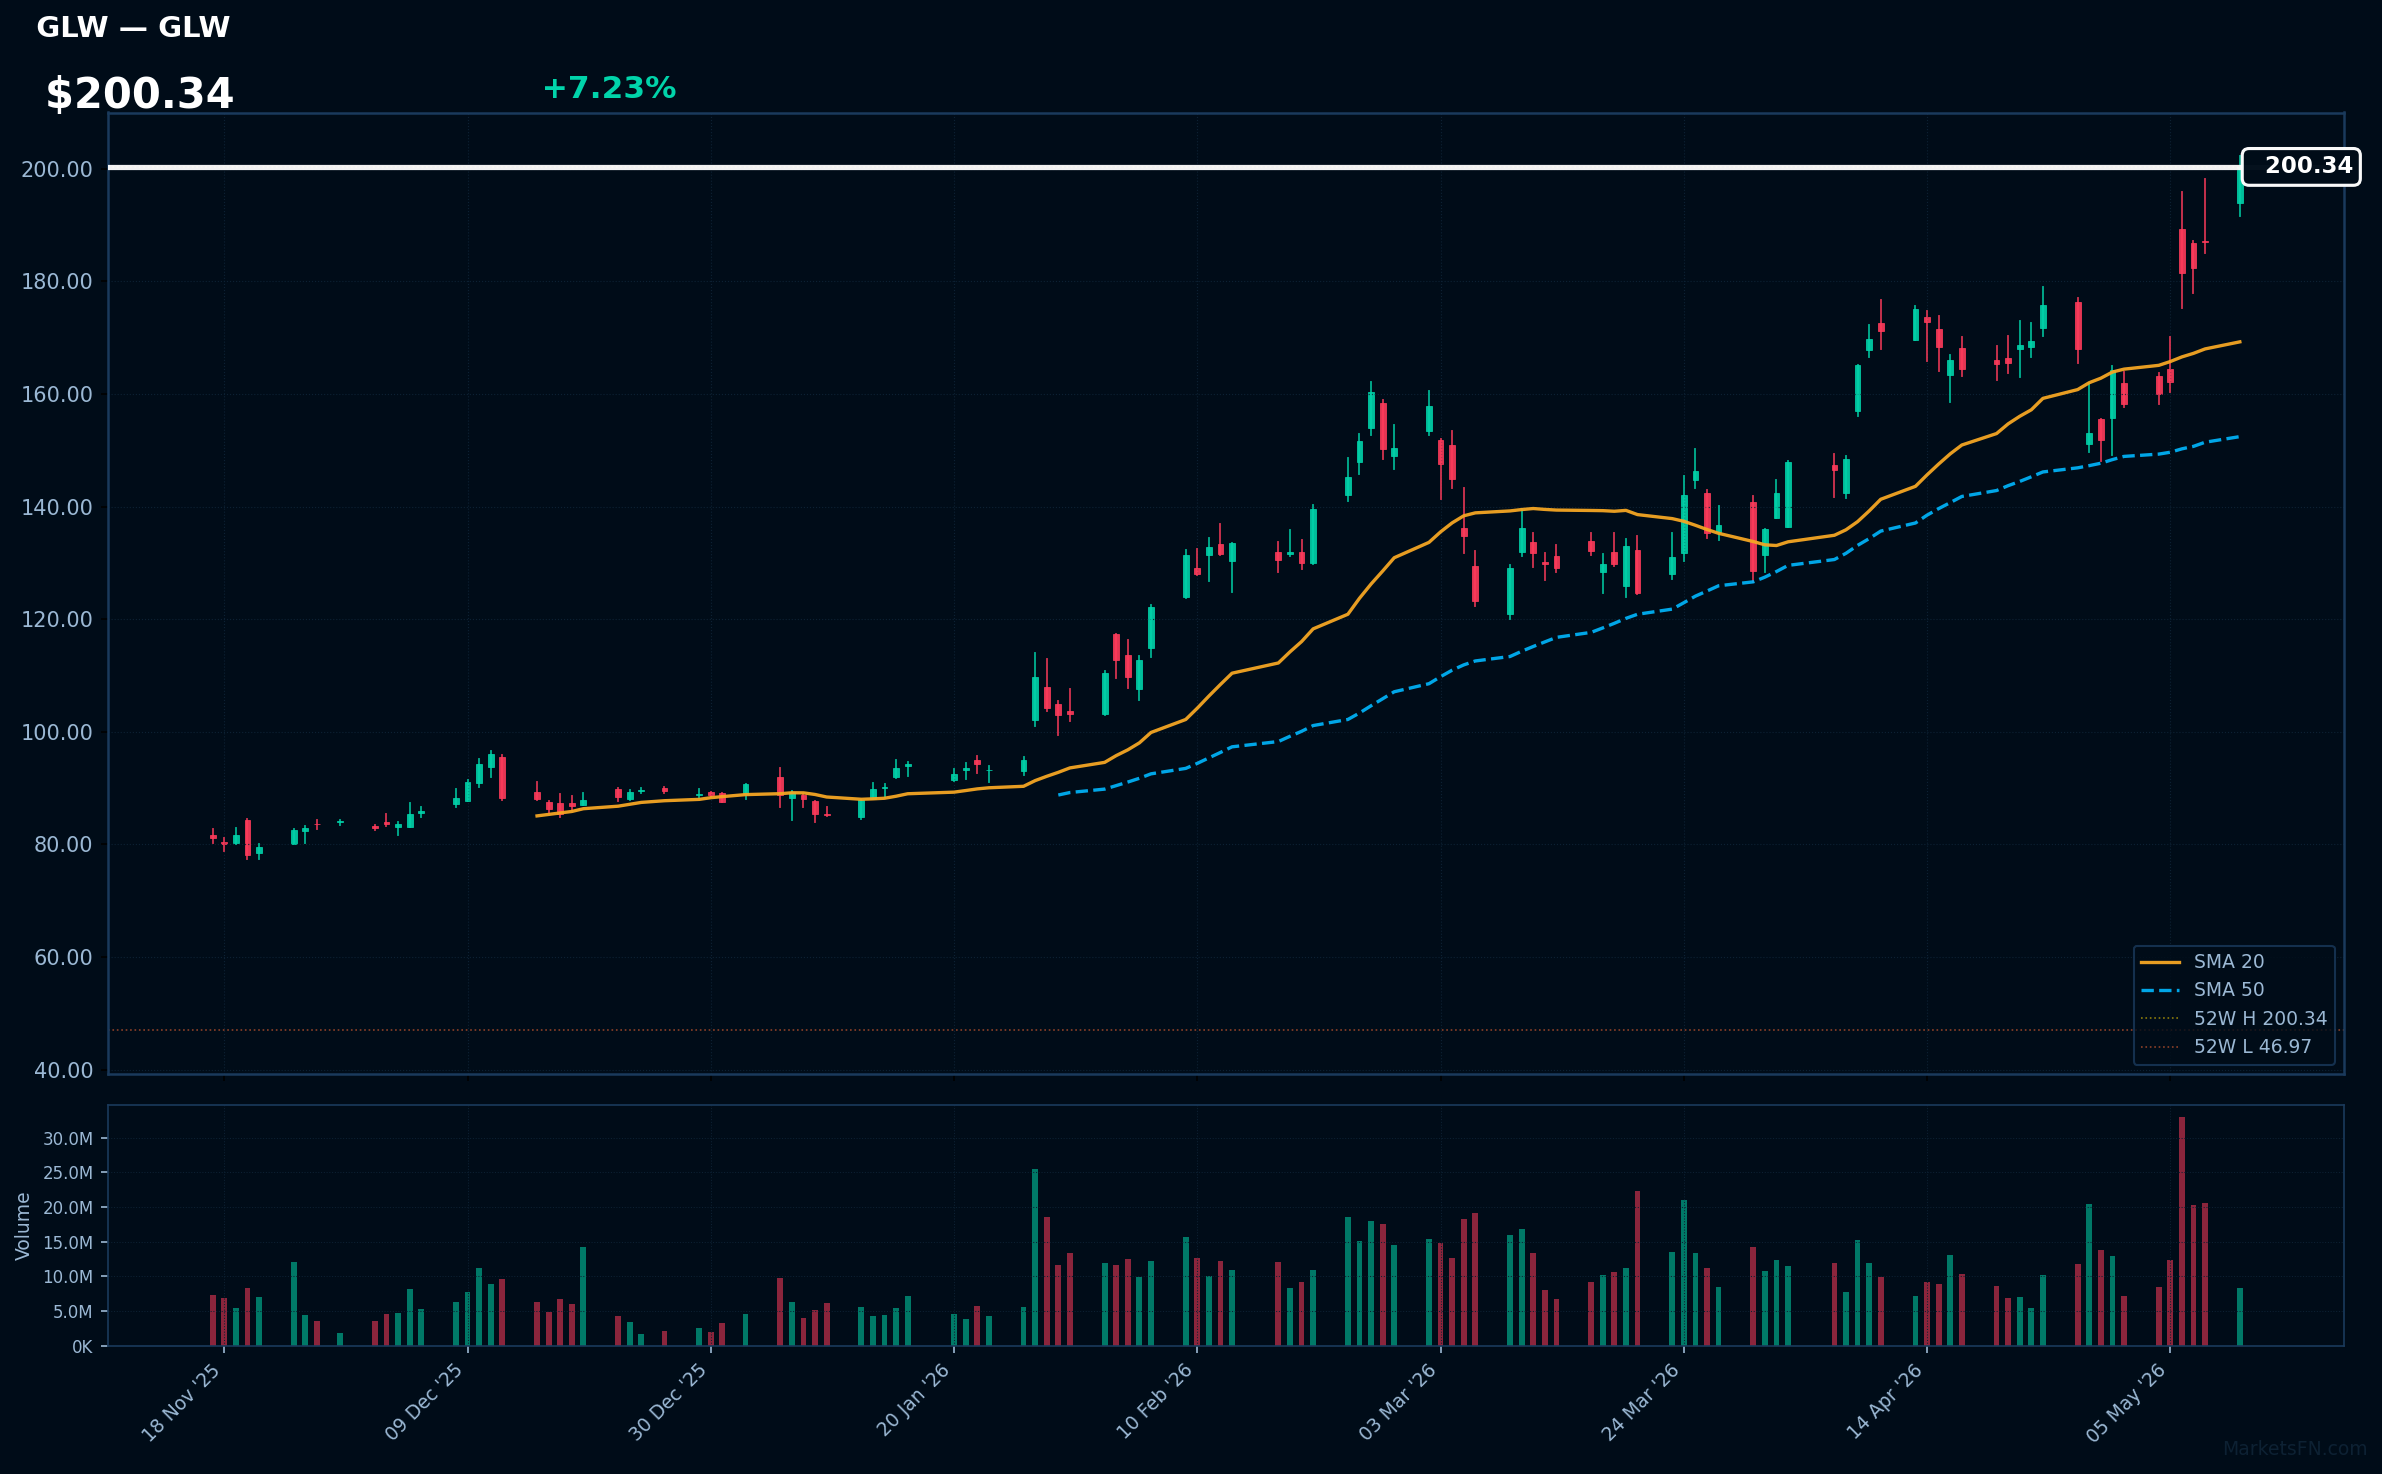
GLW | Corning, Inc | Technology | Price: $200.45 | Day: +7.23% | 1W: +25.24% | 1M: +16.99% | RSI: 72.0 | vs MA200: +92.8% | Trend: Above MA20, MA50, MA200
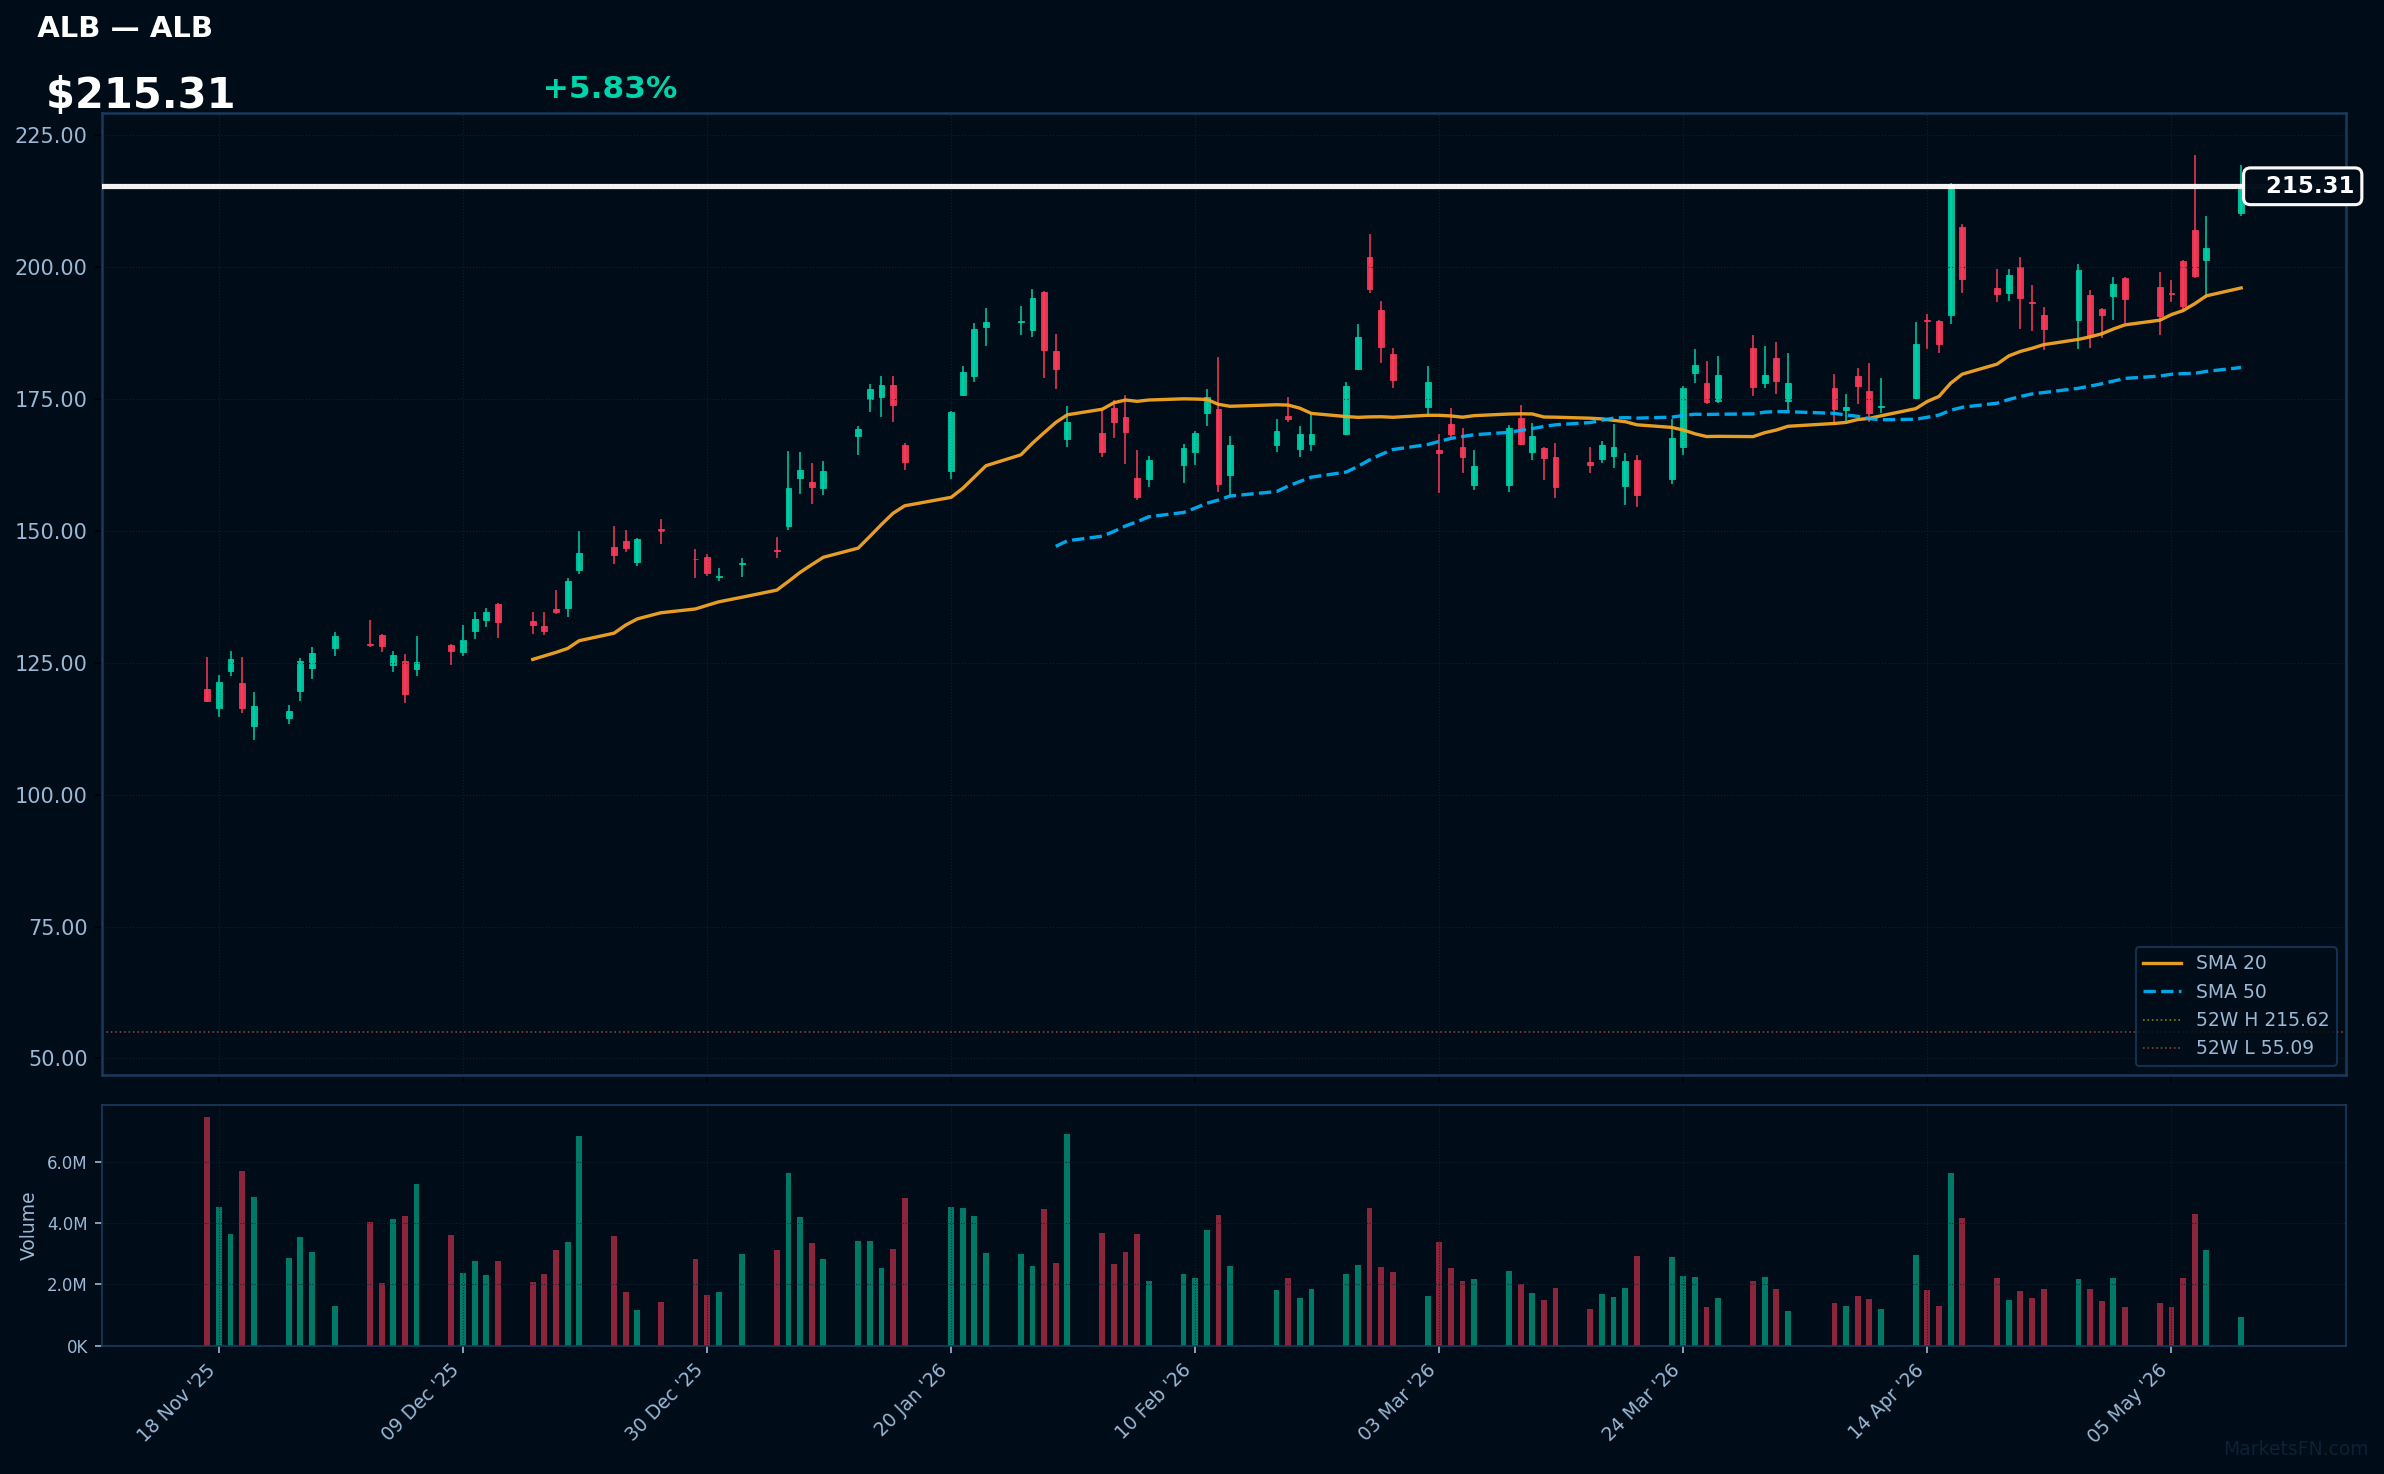
ALB | Albemarle Corp | Basic Materials | Price: $215.39 | Day: +5.83% | 1W: +12.91% | 1M: +24.00% | RSI: 64.9 | vs MA200: +61.3% | Trend: Above MA20, MA50, MA200
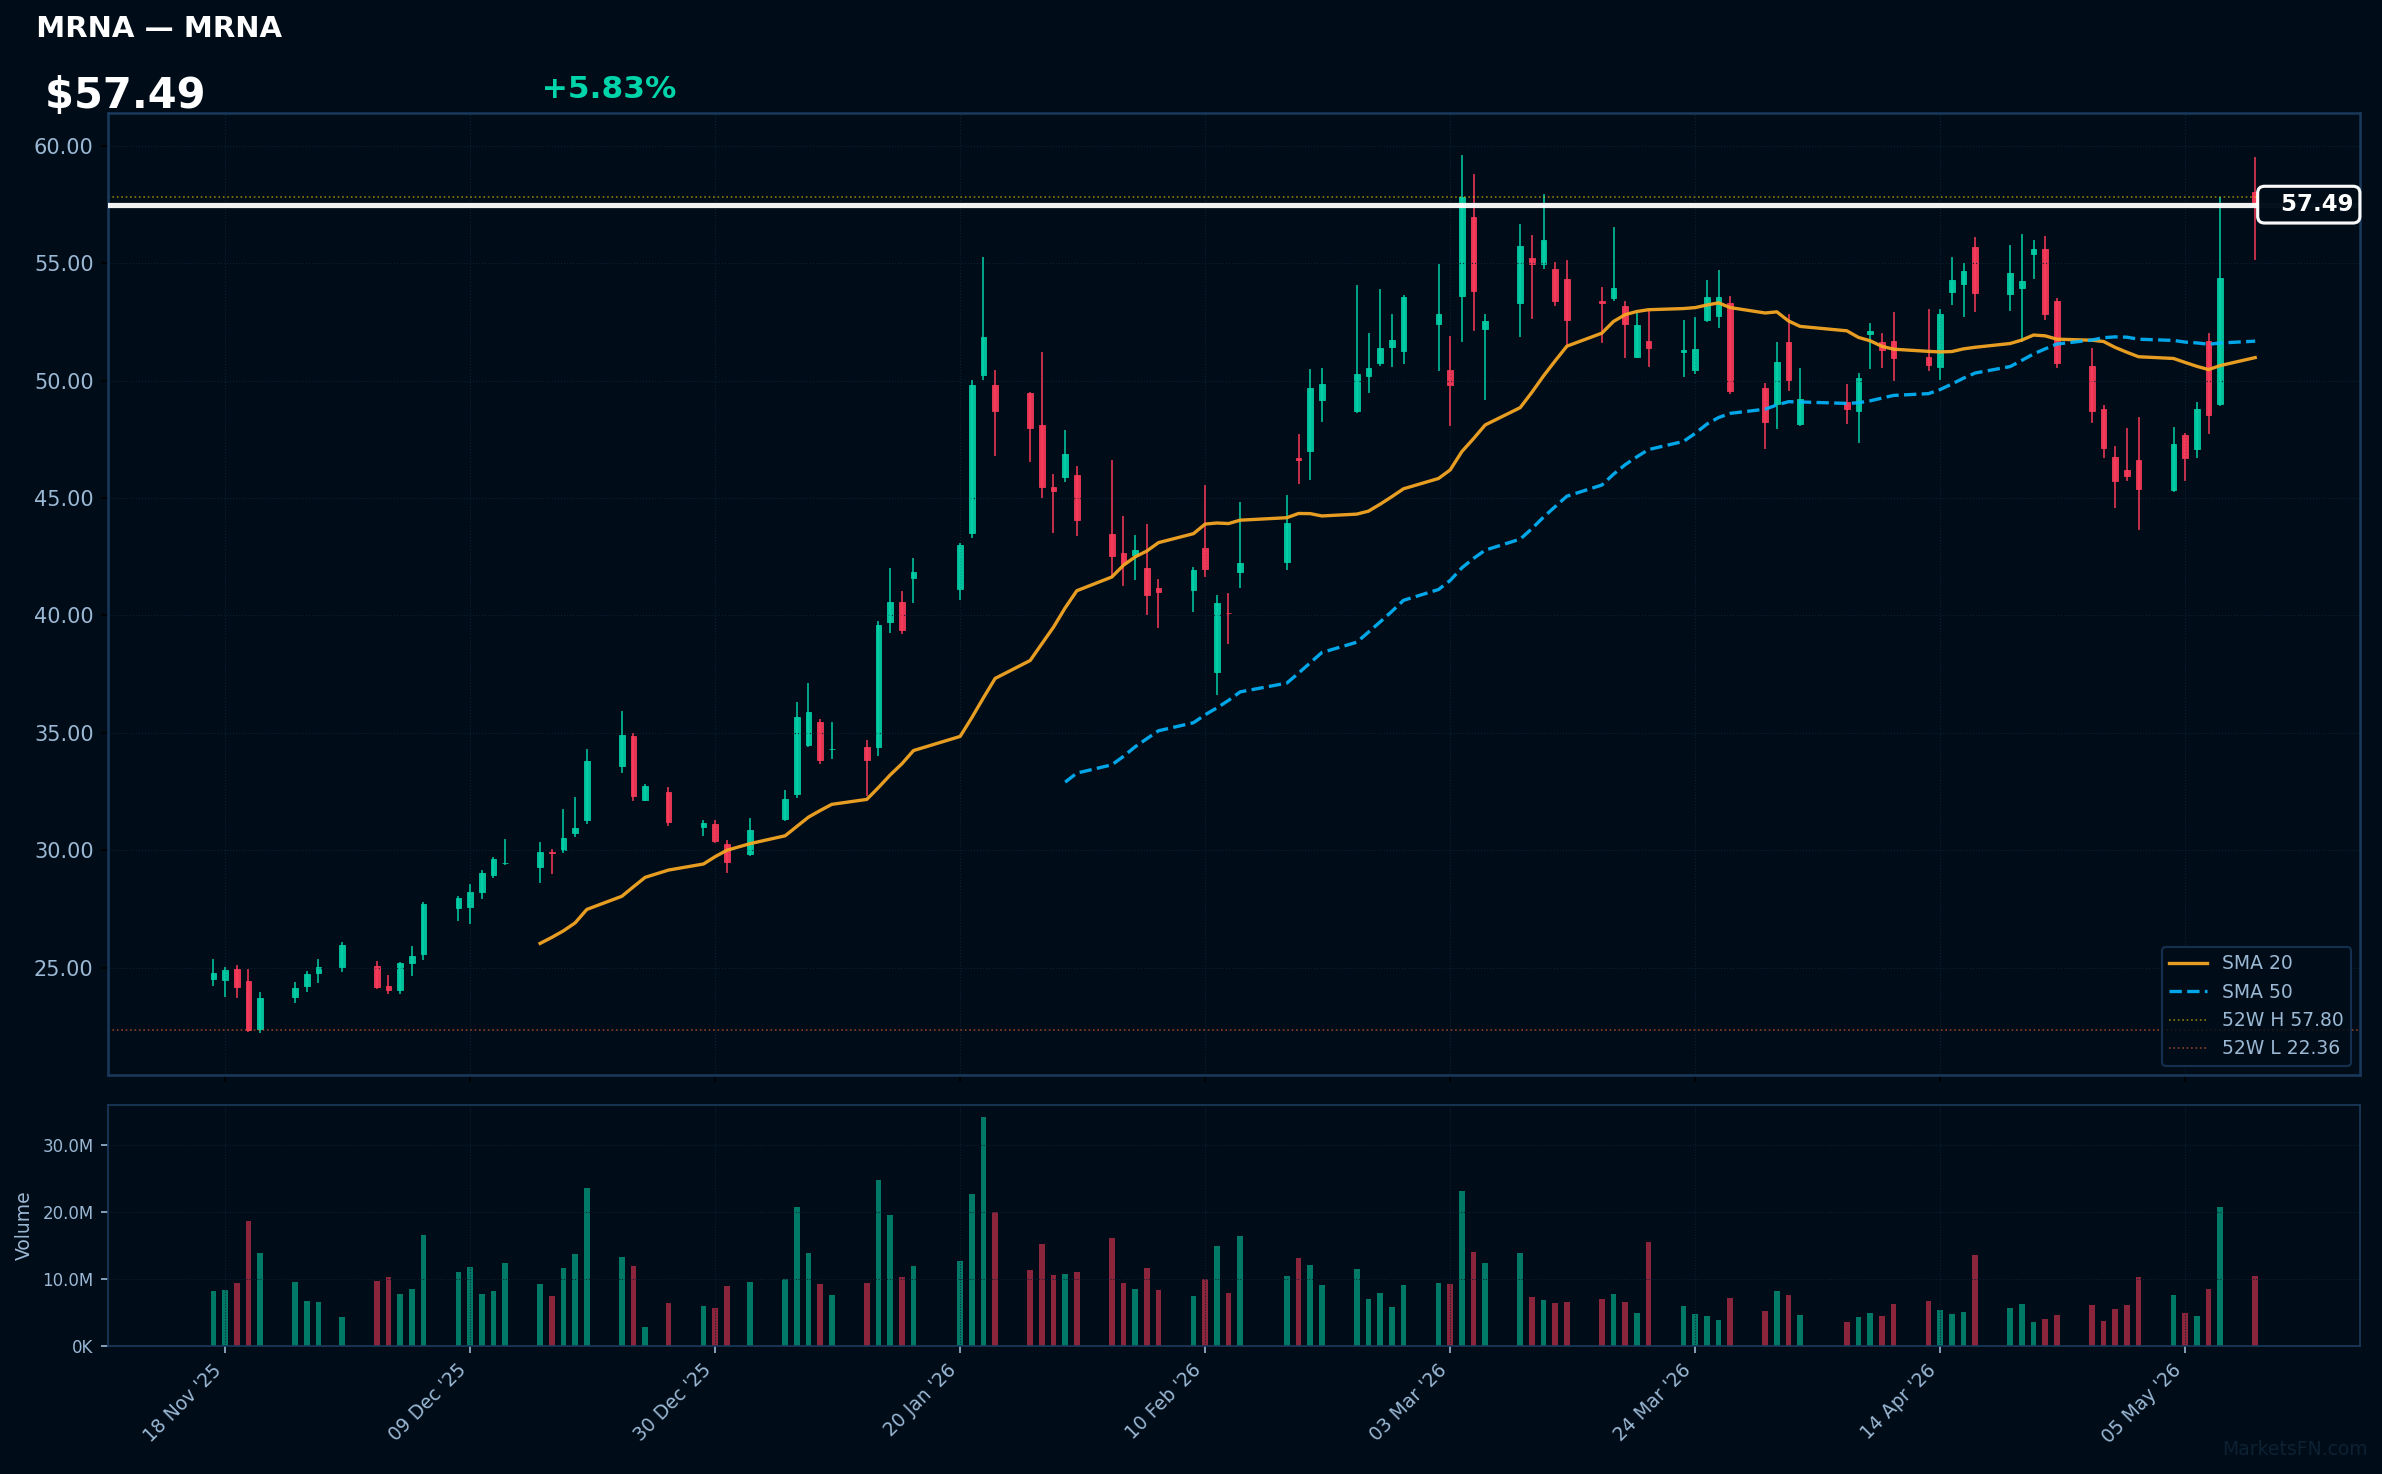
MRNA | Moderna Inc | Healthcare | Price: $57.52 | Day: +5.83% | 1W: +21.54% | 1M: +12.81% | RSI: 65.8 | vs MA200: +58.7% | Trend: Above MA20, MA50, MA200
Recent headlines (last 12h)
- Stocks to Watch: Moderna, Intel, Micron, Fox
- Moderna stock extends gains on hantavirus research
- S&P 500 set for muted open as Trump brands Iran offer 'totally unacceptable'
- Moderna stock surges as hantavirus outbreak spotlights early vaccine work and flu data
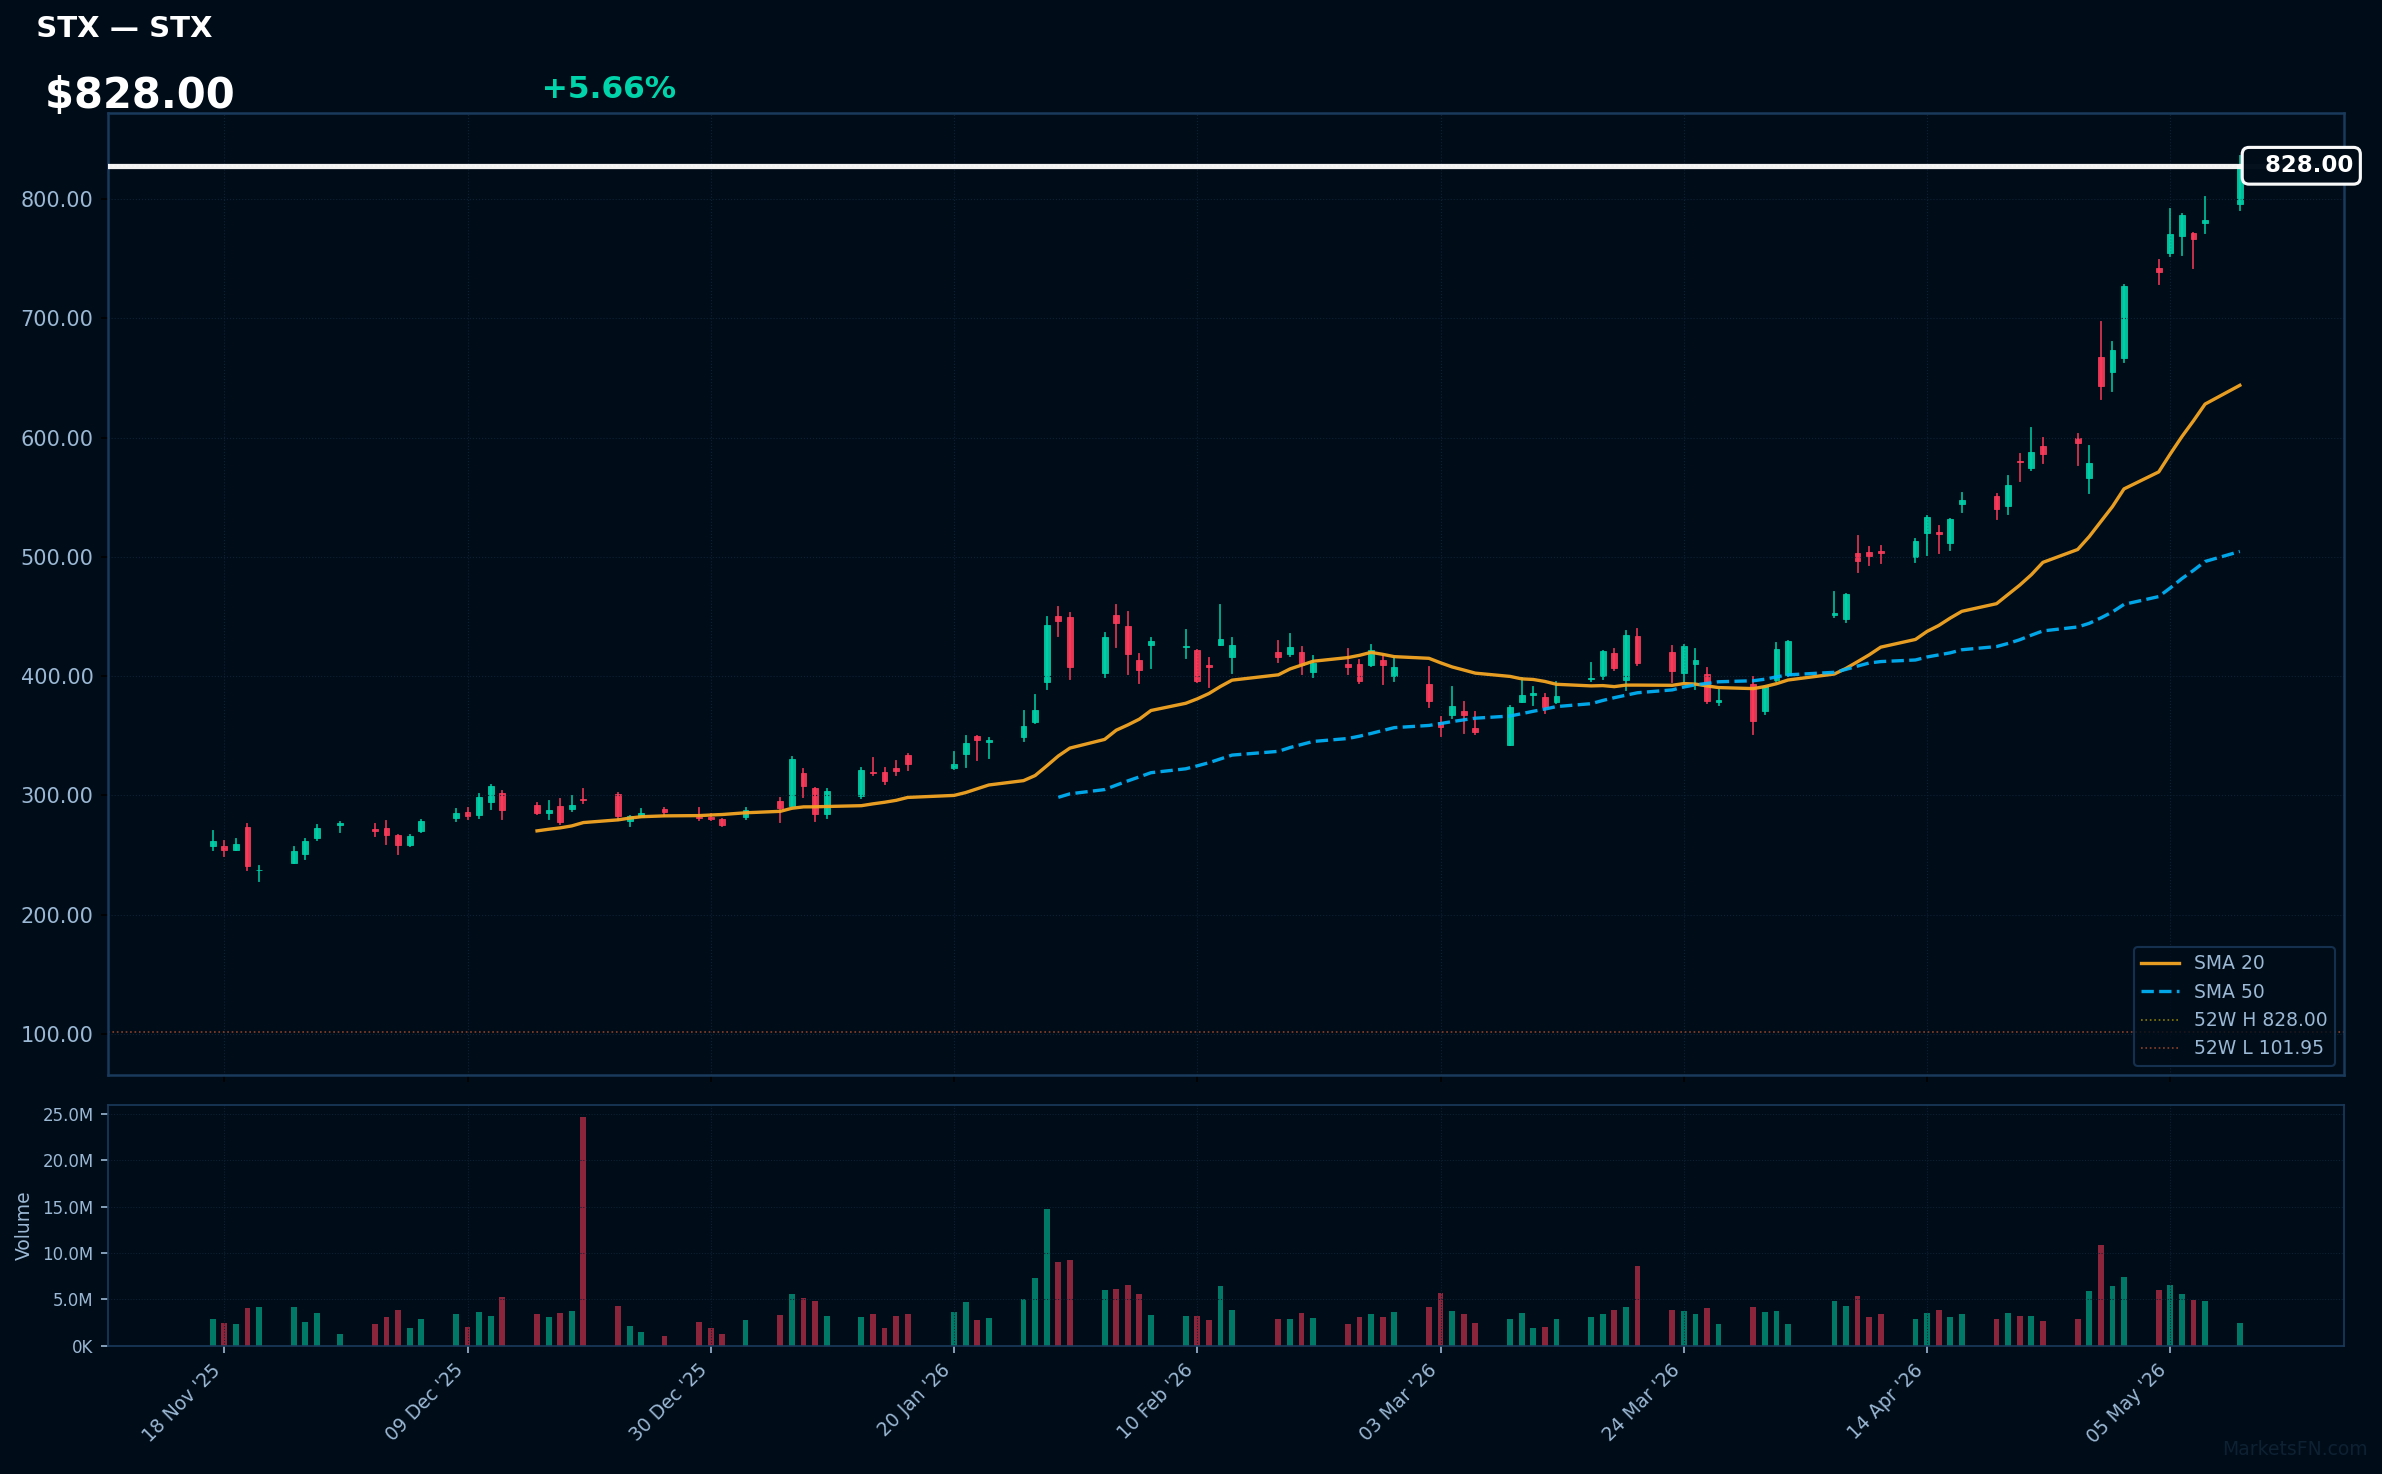
STX | Seagate Technology Holdings Plc | Technology | Price: $826.95 | Day: +5.66% | 1W: +12.11% | 1M: +64.57% | RSI: 84.7 | vs MA200: +154.6% | Trend: Above MA20, MA50, MA200
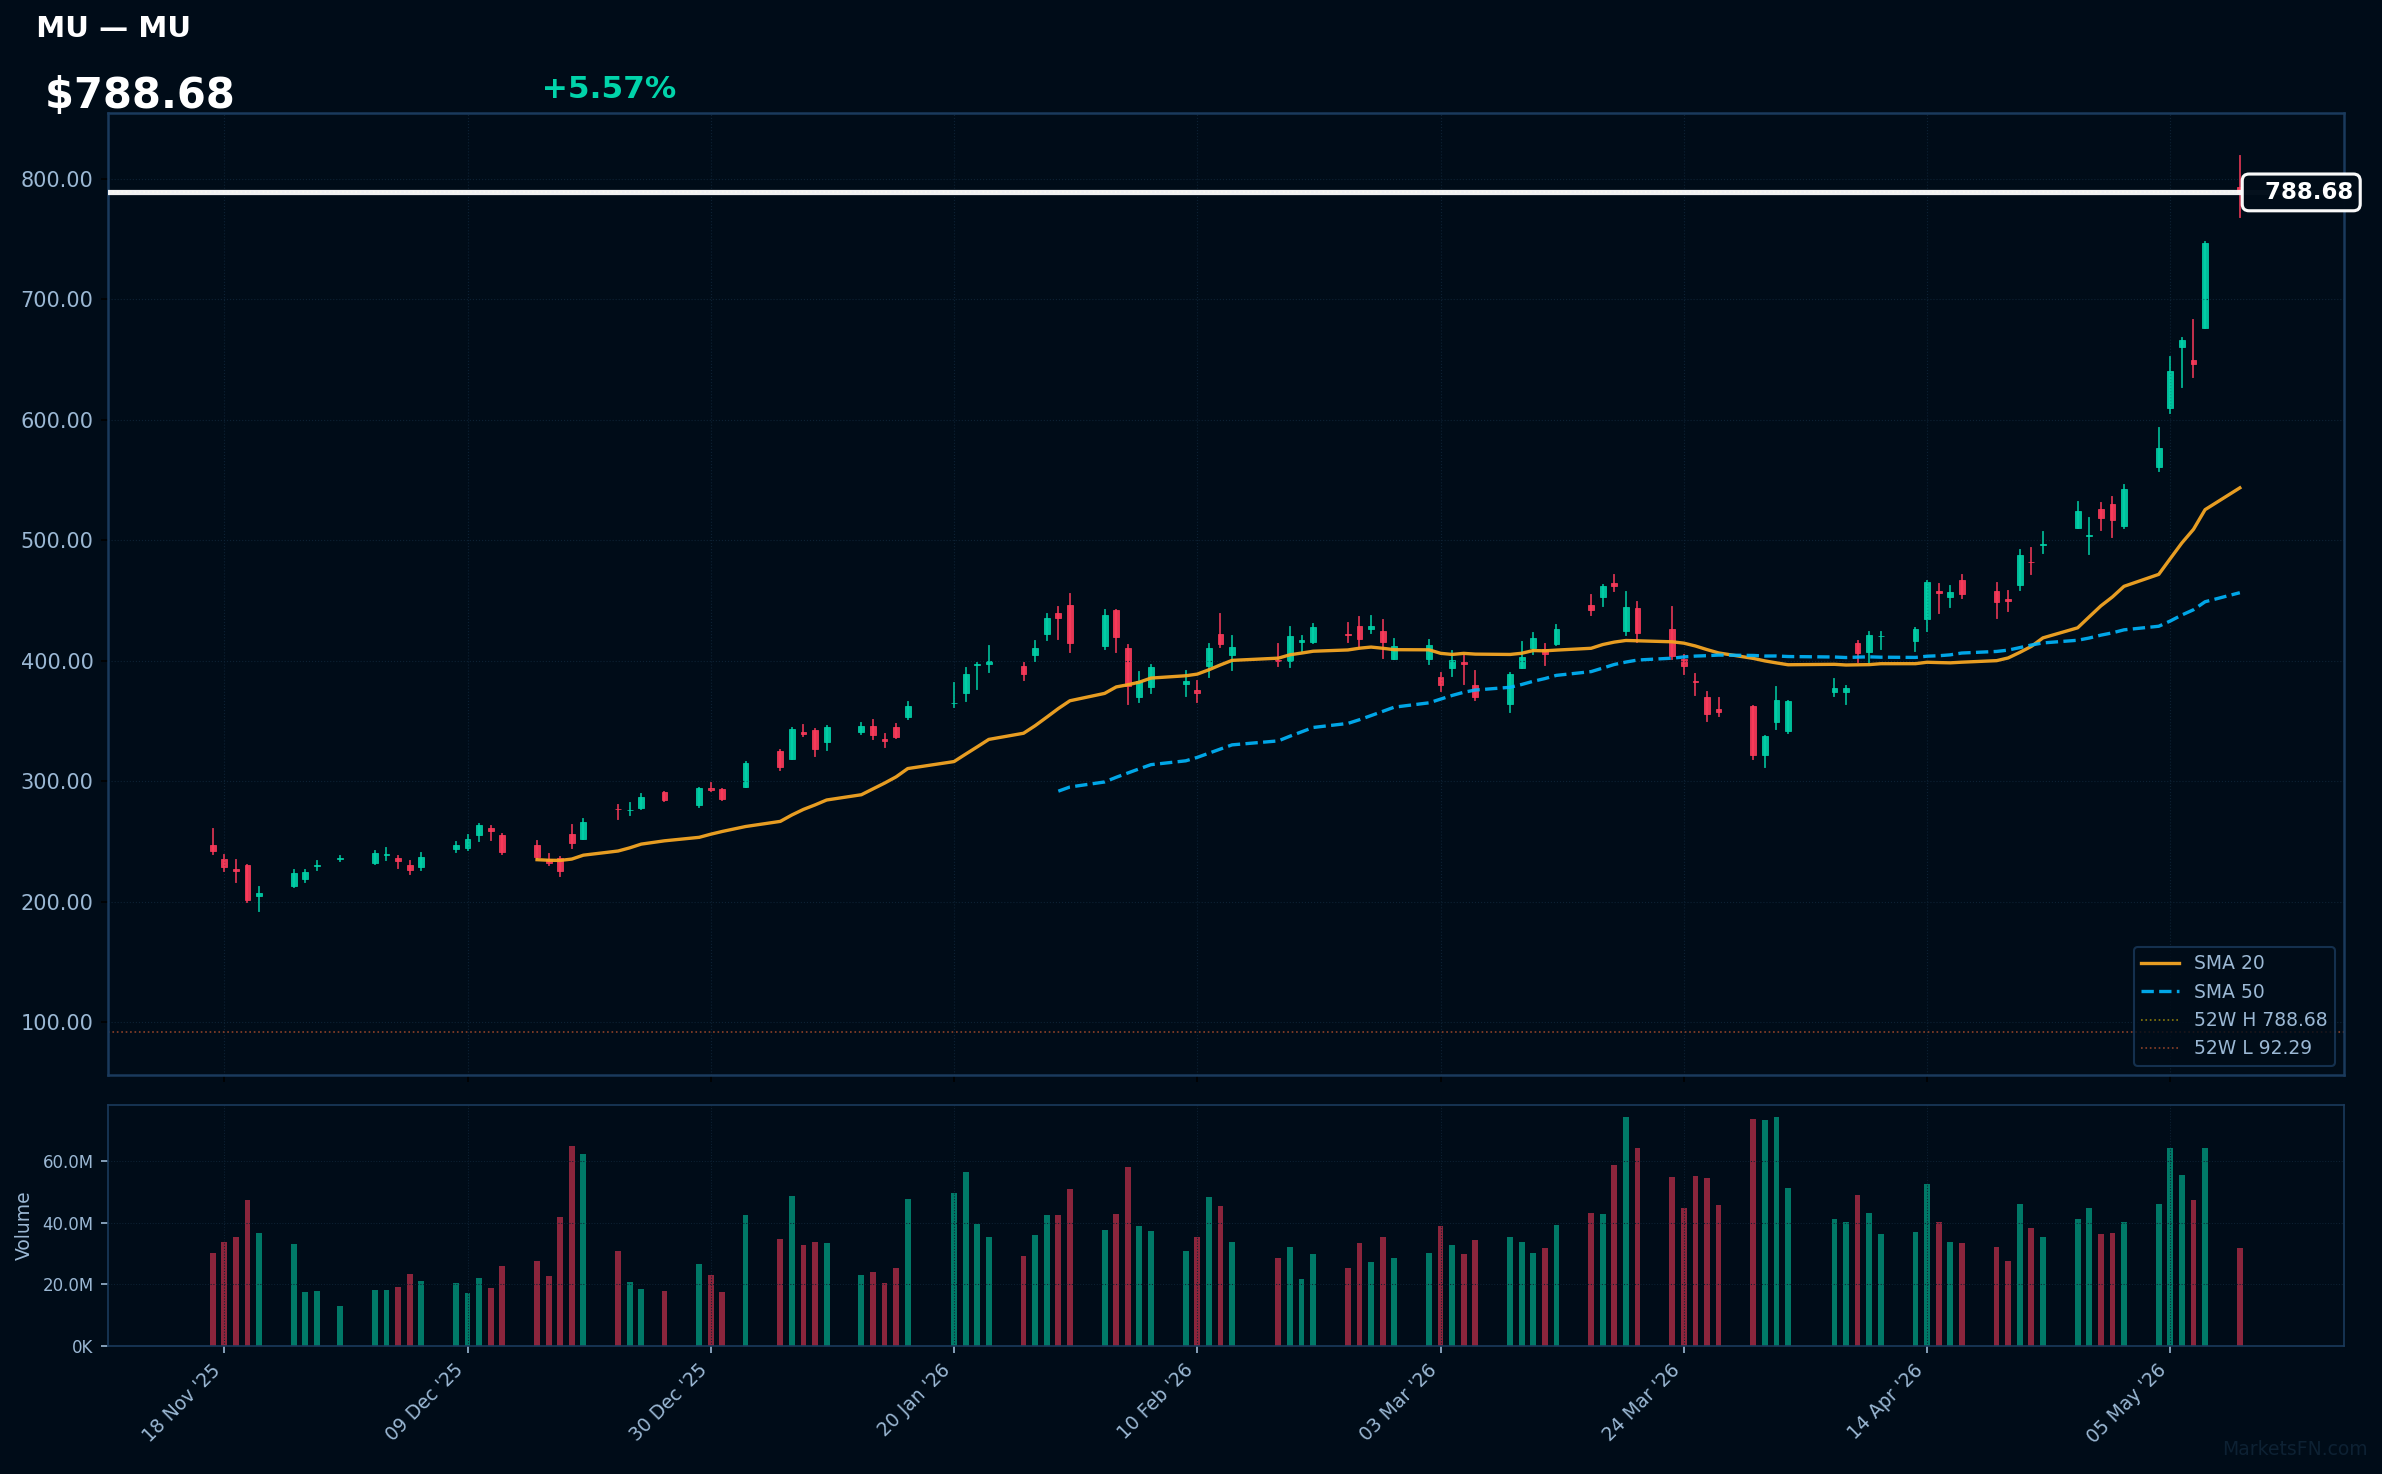
MU | Micron Technology Inc | Technology | Price: $788.43 | Day: +5.57% | 1W: +36.82% | 1M: +87.52% | RSI: 85.6 | vs MA200: +168.2% | Trend: Above MA20, MA50, MA200
Recent headlines (last 12h)
- Today Is All About Chip Stocks-Again
- Stocks to Watch: Moderna, Intel, Micron, Fox
- Micron (MU) Shares Climb on Samsung Strike Risks and Bullish Analyst Target
- Retail Is Flooding Into the Chipmaker Rally as Moves Get Extreme
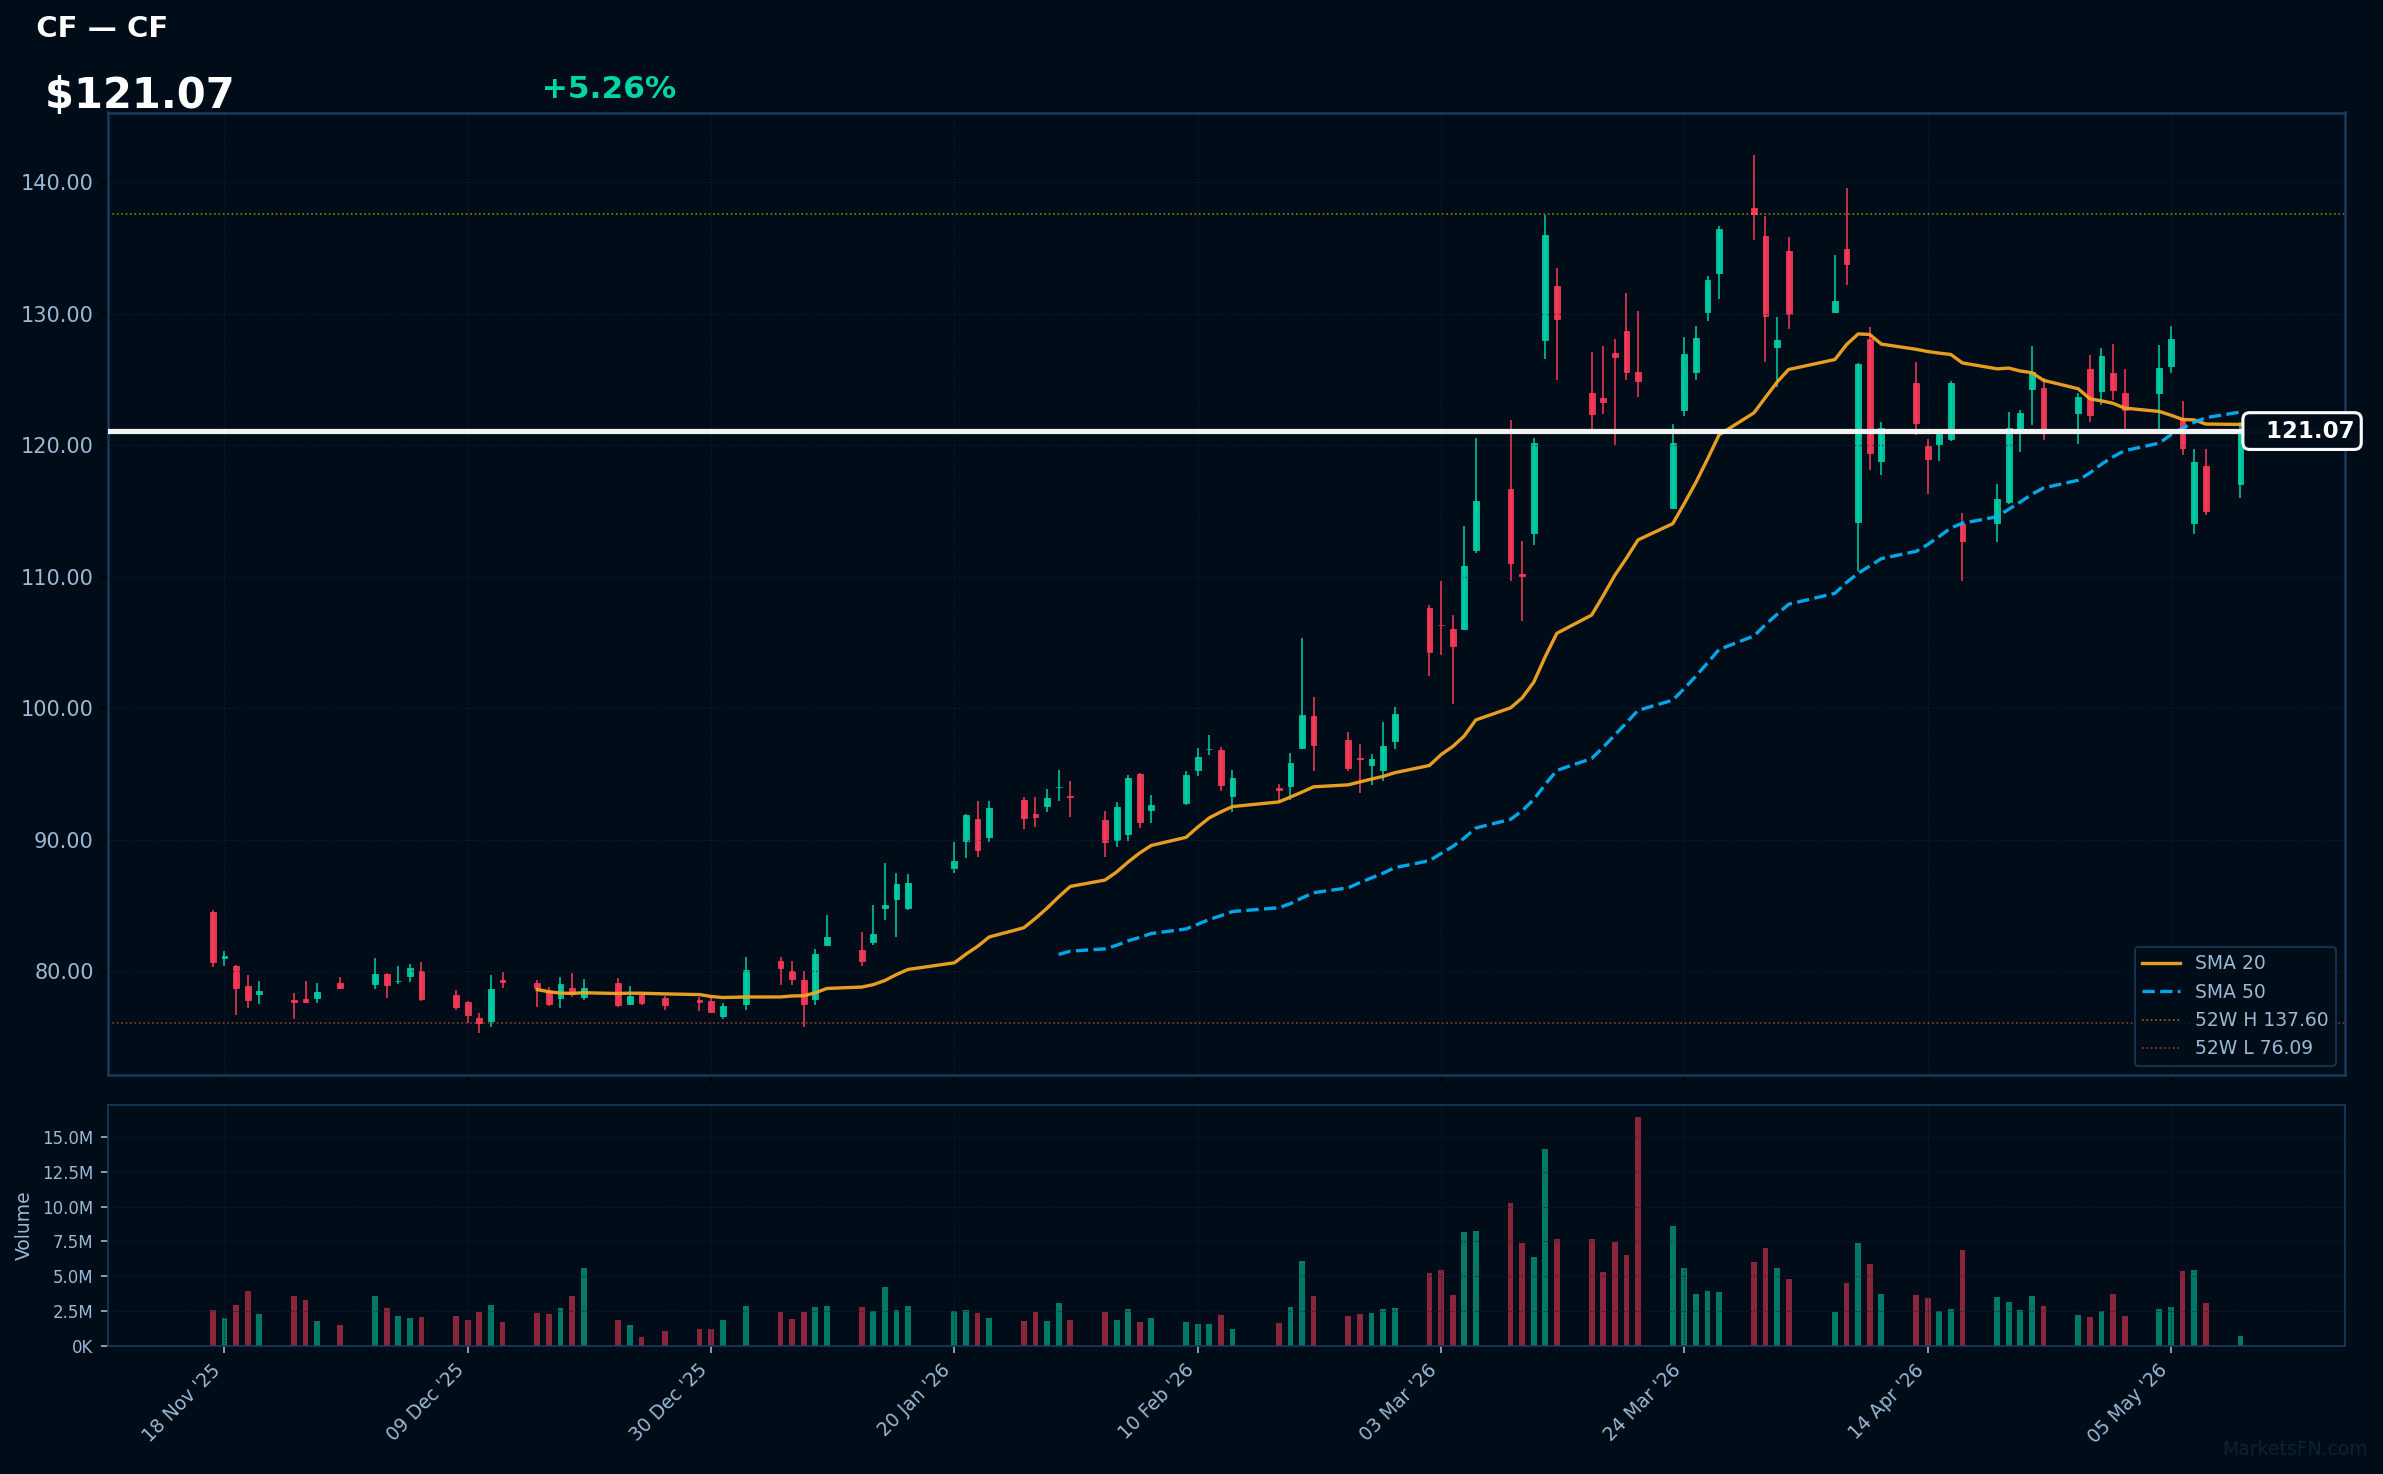
CF | CF Industries Holdings Inc | Basic Materials | Price: $121.07 | Day: +5.26% | 1W: -3.83% | 1M: -0.21% | RSI: 49.3 | vs MA200: +27.3% | Trend: Above MA200 · Below MA20, MA50
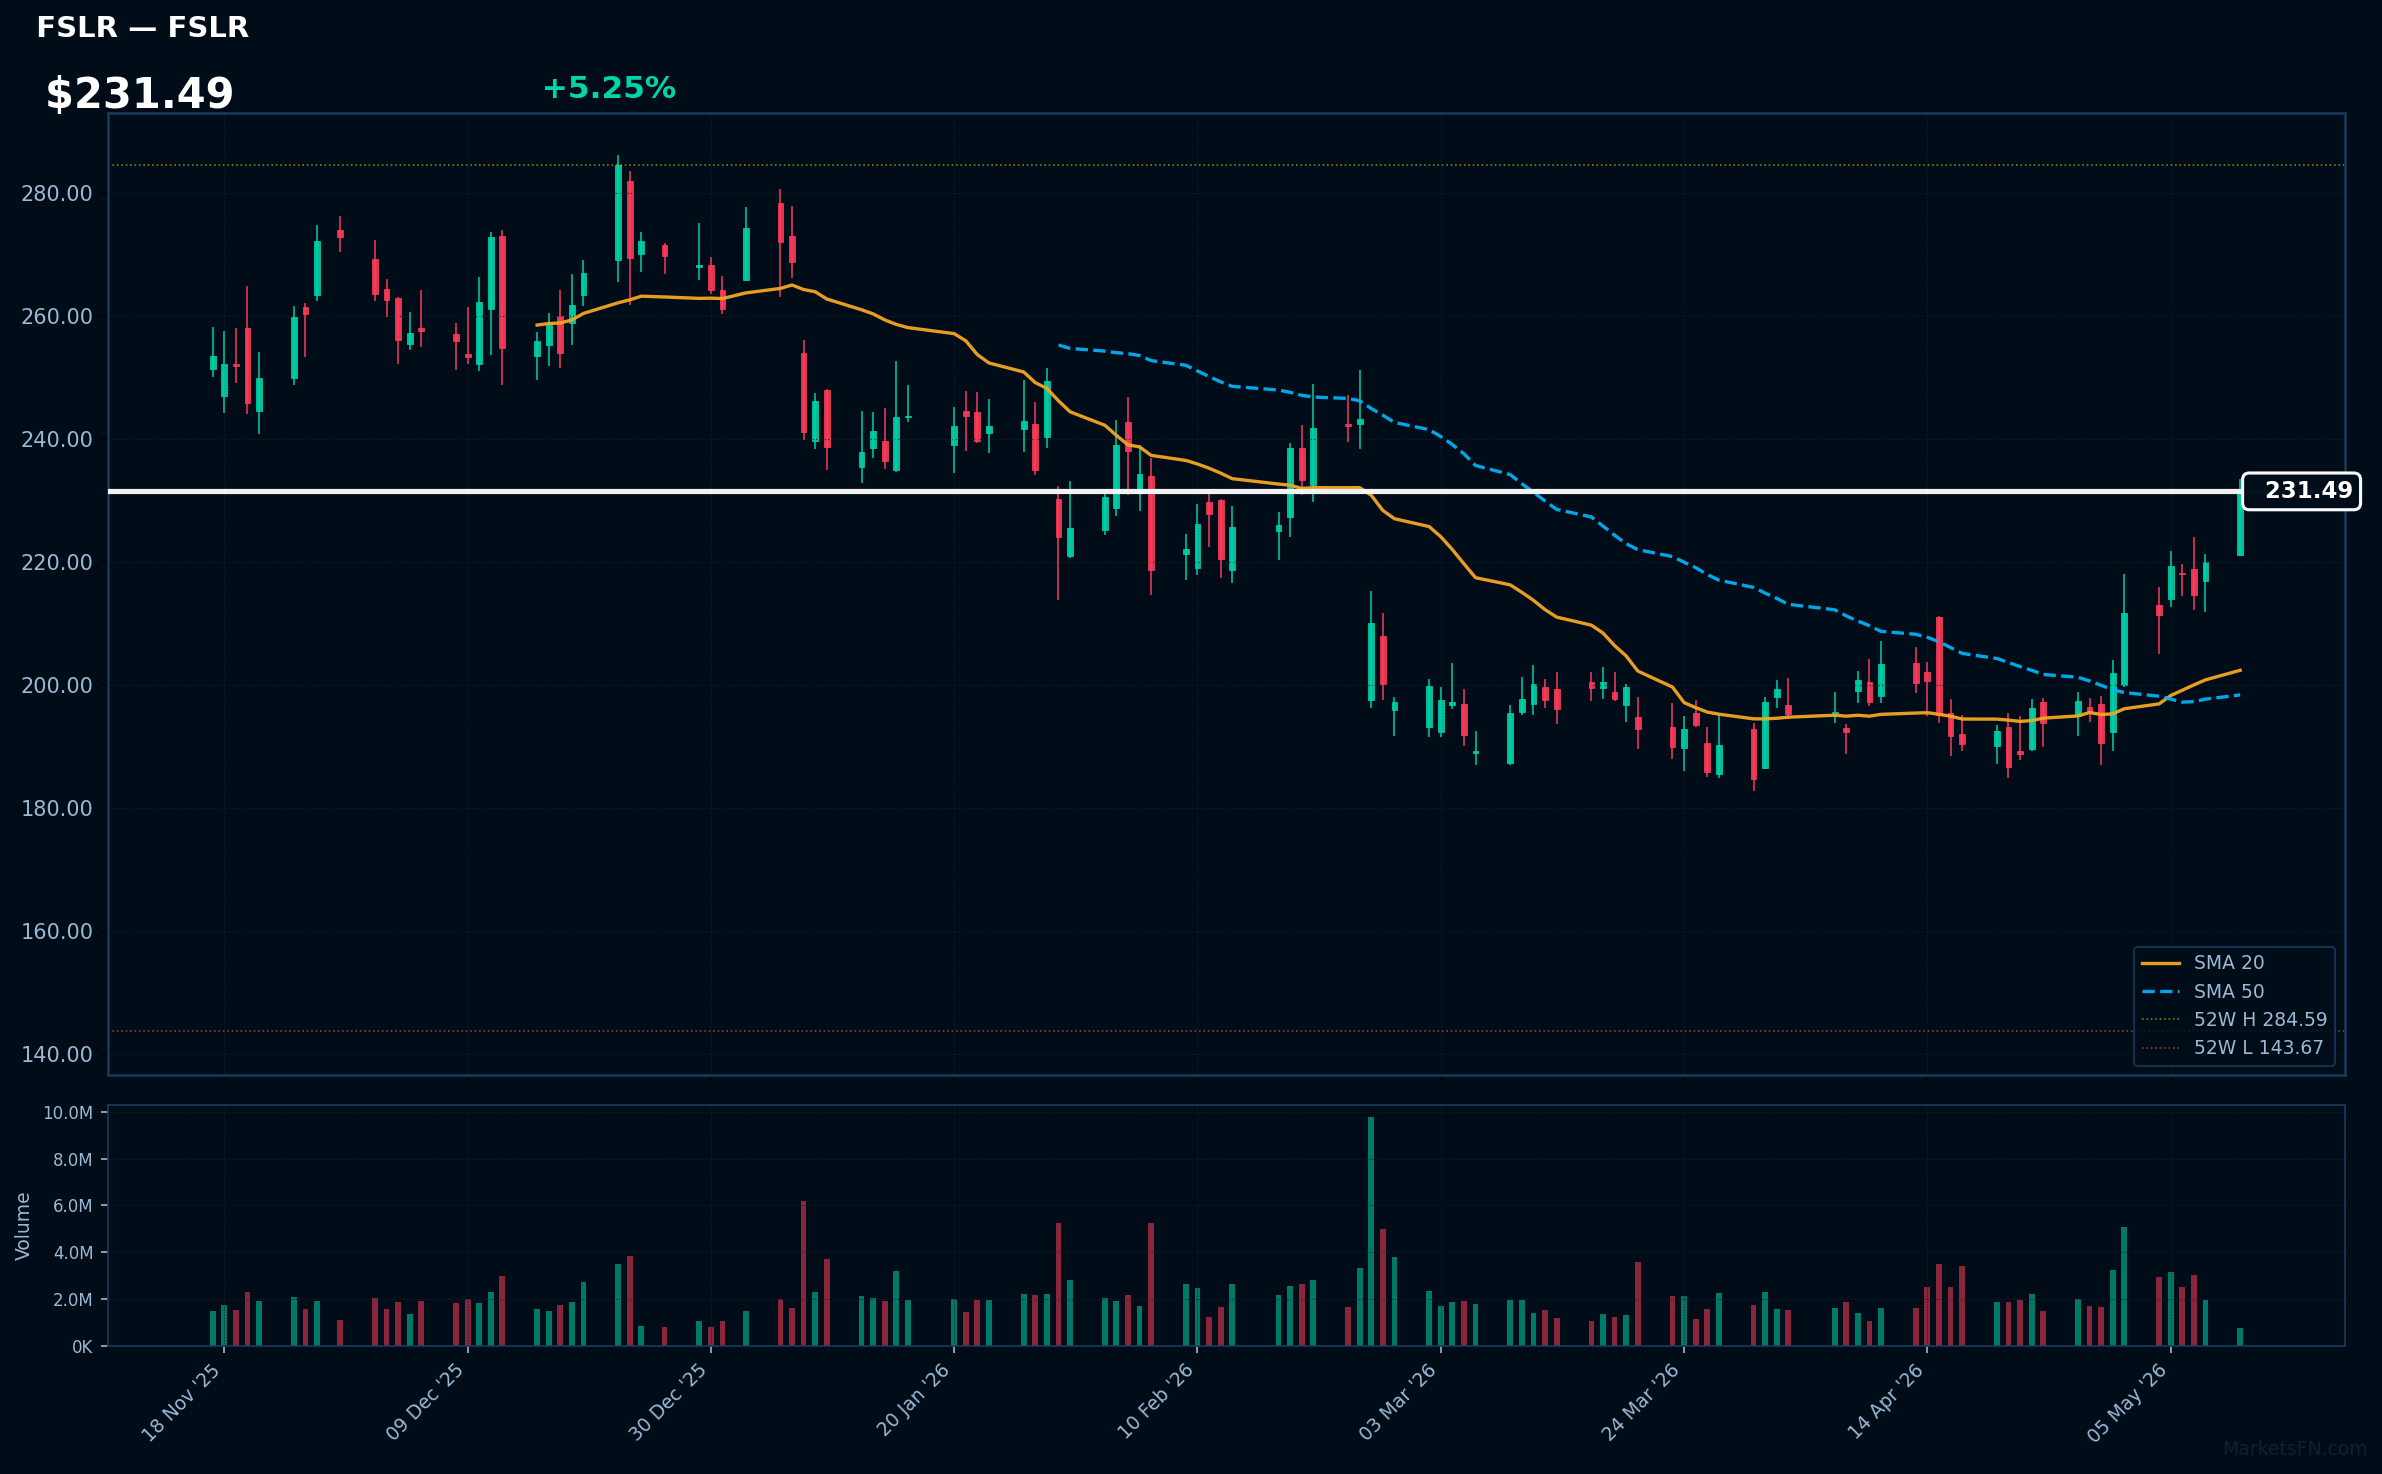
FSLR | First Solar Inc | Technology | Price: $231.49 | Day: +5.25% | 1W: +9.51% | 1M: +13.77% | RSI: 70.0 | vs MA200: +3.7% | Trend: Above MA20, MA50, MA200
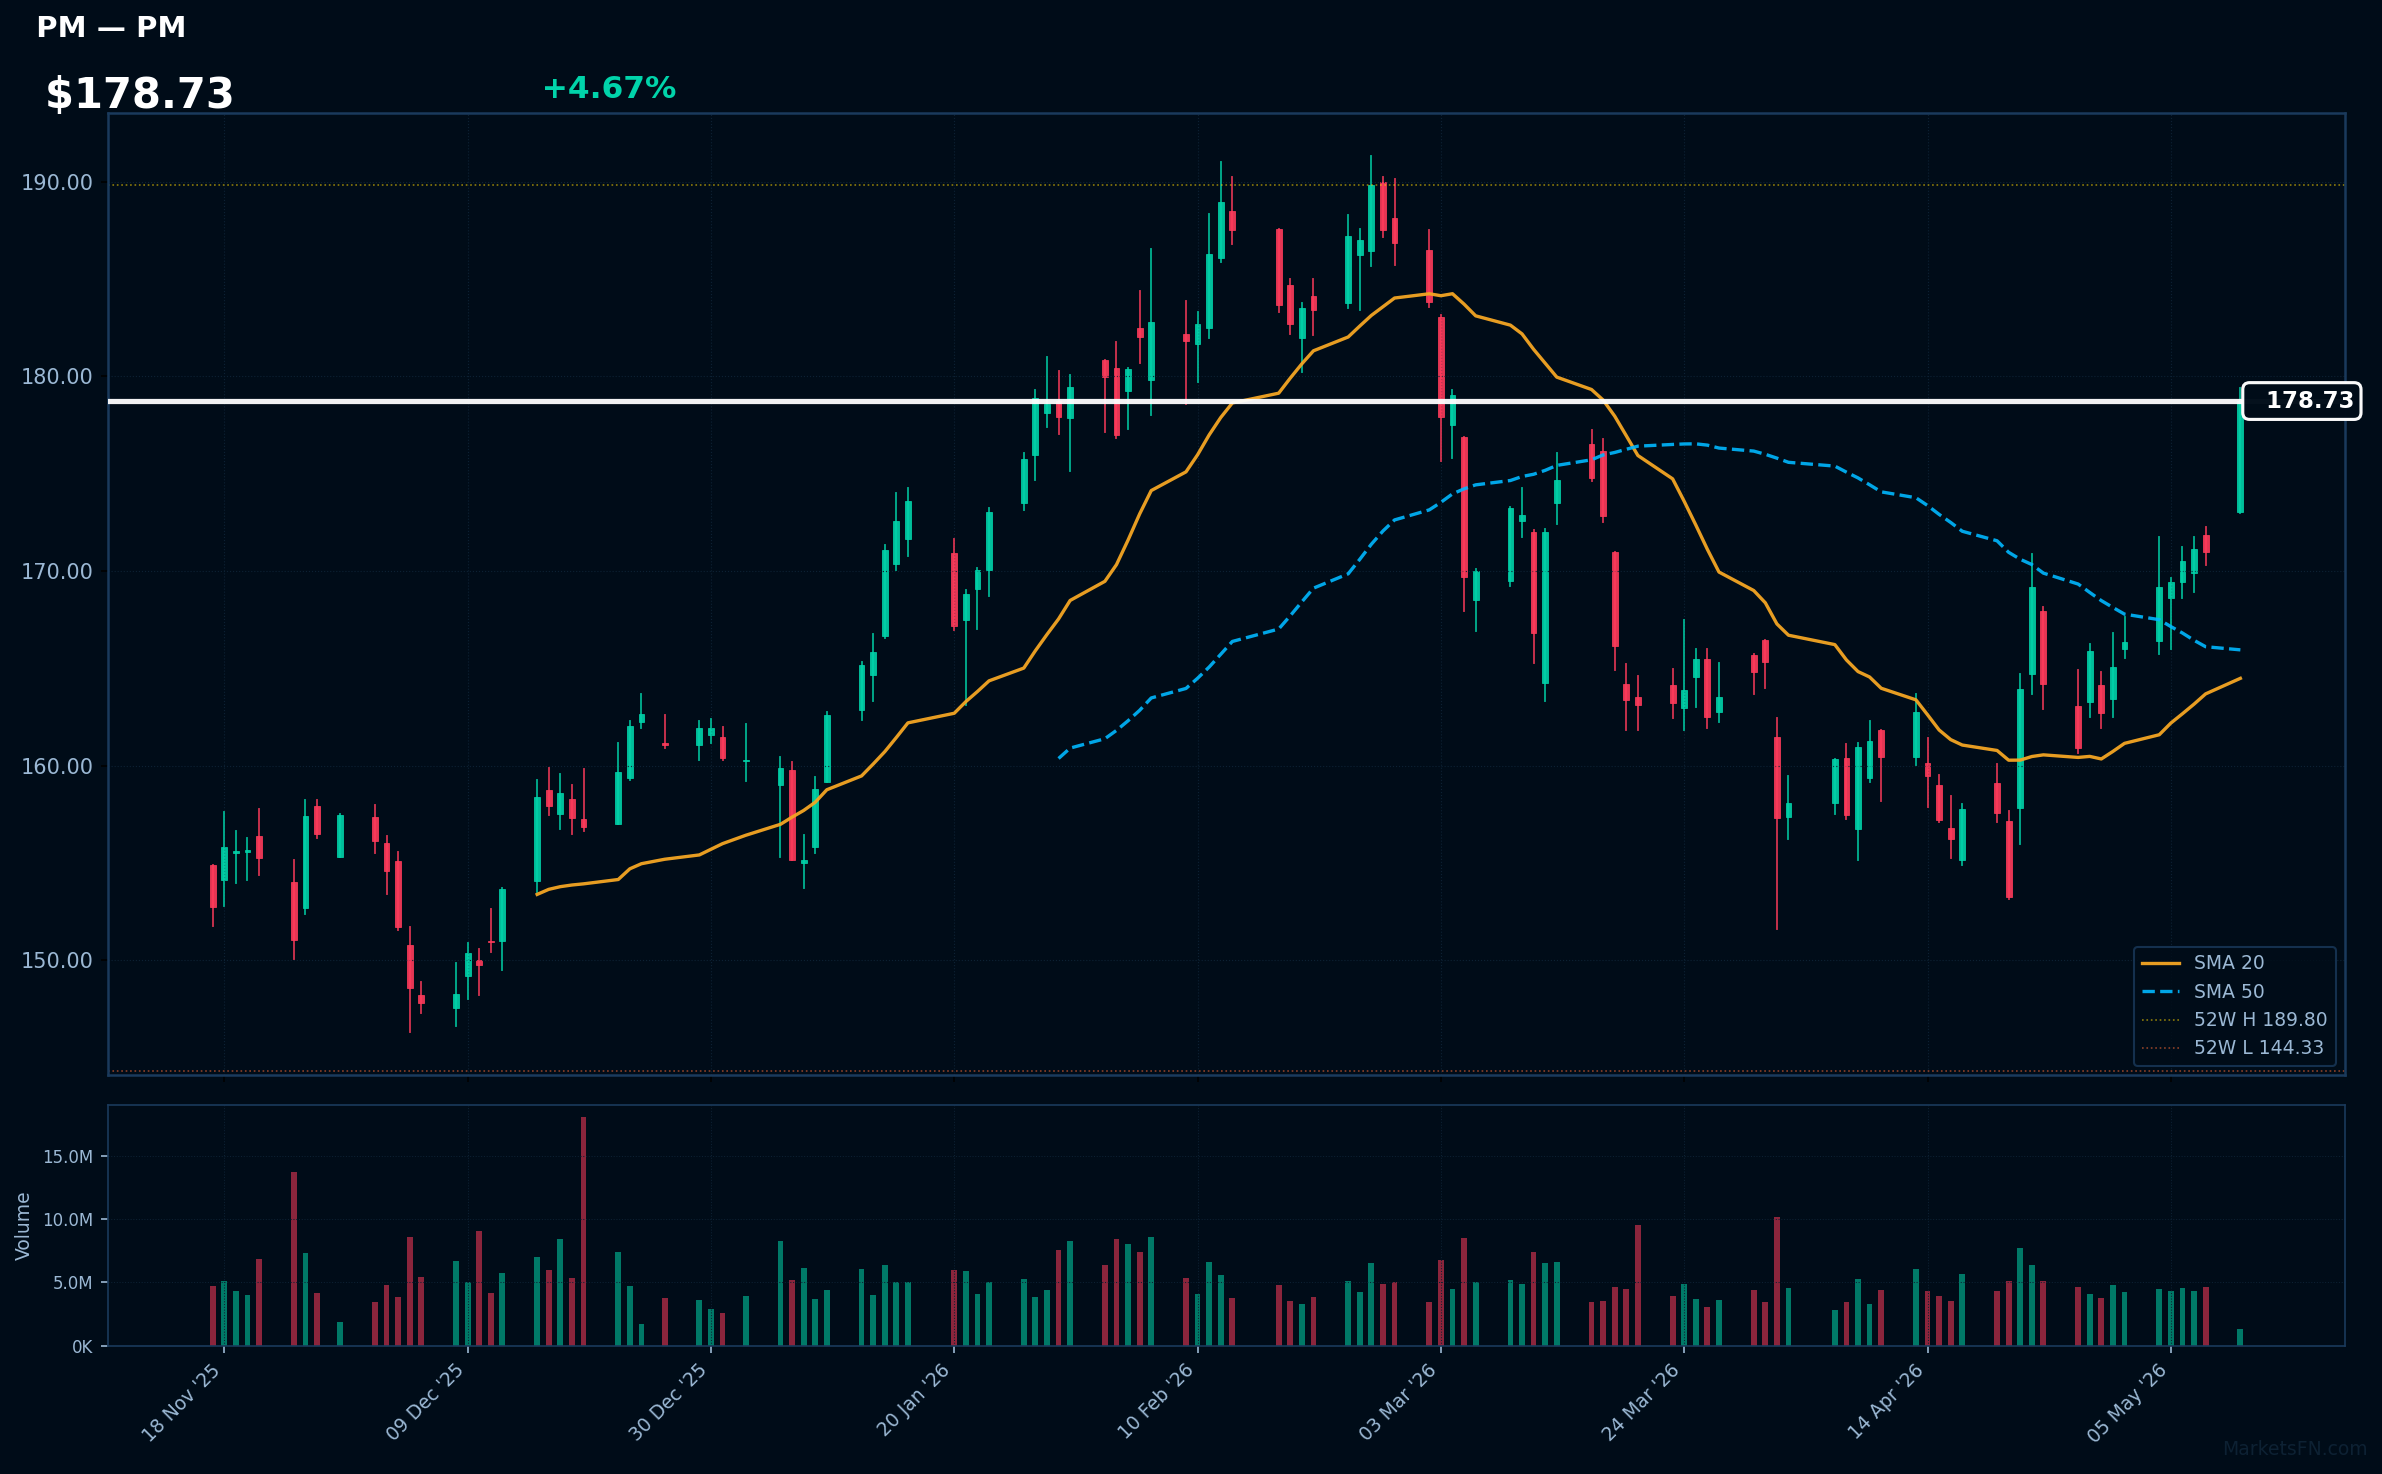
PM | Philip Morris International Inc | Consumer Defensive | Price: $178.97 | Day: +4.67% | 1W: +5.64% | 1M: +11.39% | RSI: 66.9 | vs MA200: +9.0% | Trend: Above MA20, MA50, MA200
Top 10 Losers
Today's weakest S&P 500 performers. Sector drag: Consumer Defensive (3), Technology (2), Consumer Cyclical (2), Basic Materials (1), Healthcare (1), Communication Services (1).
| Ticker | Company | Sector | Price | Day % | 1W % | 1M % | RSI | vs MA200 | Trend |
|---|---|---|---|---|---|---|---|---|---|
| TYL | Tyler Technologies, Inc | Technology | $311.39 | -4.06% | -4.85% | -1.86% | 37.7 | -29.9% | Below MA20, MA50, MA200 |
| EL | Estee Lauder Cos., Inc | Consumer Defensive | $82.58 | -4.20% | +1.43% | +13.51% | 54.8 | -12.2% | Above MA20, MA50 · Below MA200 |
| MOS | Mosaic Company | Basic Materials | $21.25 | -4.26% | -7.49% | -14.18% | 29.2 | -24.9% | Below MA20, MA50, MA200 |
| CCL | Carnival Corp | Consumer Cyclical | $25.20 | -4.45% | -1.87% | -9.97% | 42.4 | -12.4% | Below MA20, MA50, MA200 |
| RCL | Royal Caribbean Group | Consumer Cyclical | $262.95 | -4.47% | +1.32% | -5.07% | 45.7 | -11.6% | Below MA20, MA50, MA200 |
| ISRG | Intuitive Surgical Inc | Healthcare | $429.43 | -4.58% | -5.14% | -4.77% | 32.7 | -13.8% | Below MA20, MA50, MA200 |
| TGT | Target Corp | Consumer Defensive | $118.80 | -5.15% | -7.08% | -2.60% | 37.6 | +14.1% | Above MA200 · Below MA20, MA50 |
| DELL | Dell Technologies Inc | Technology | $245.30 | -5.82% | +15.76% | +37.80% | 67.5 | +69.2% | Above MA20, MA50, MA200 |
| DG | Dollar General Corp | Consumer Defensive | $106.62 | -5.89% | -6.85% | -7.85% | 28.2 | -12.2% | Below MA20, MA50, MA200 |
| TTD | Trade Desk Inc | Communication Services | $21.39 | -7.32% | -11.31% | +6.40% | 39.8 | -46.3% | Below MA20, MA50, MA200 |
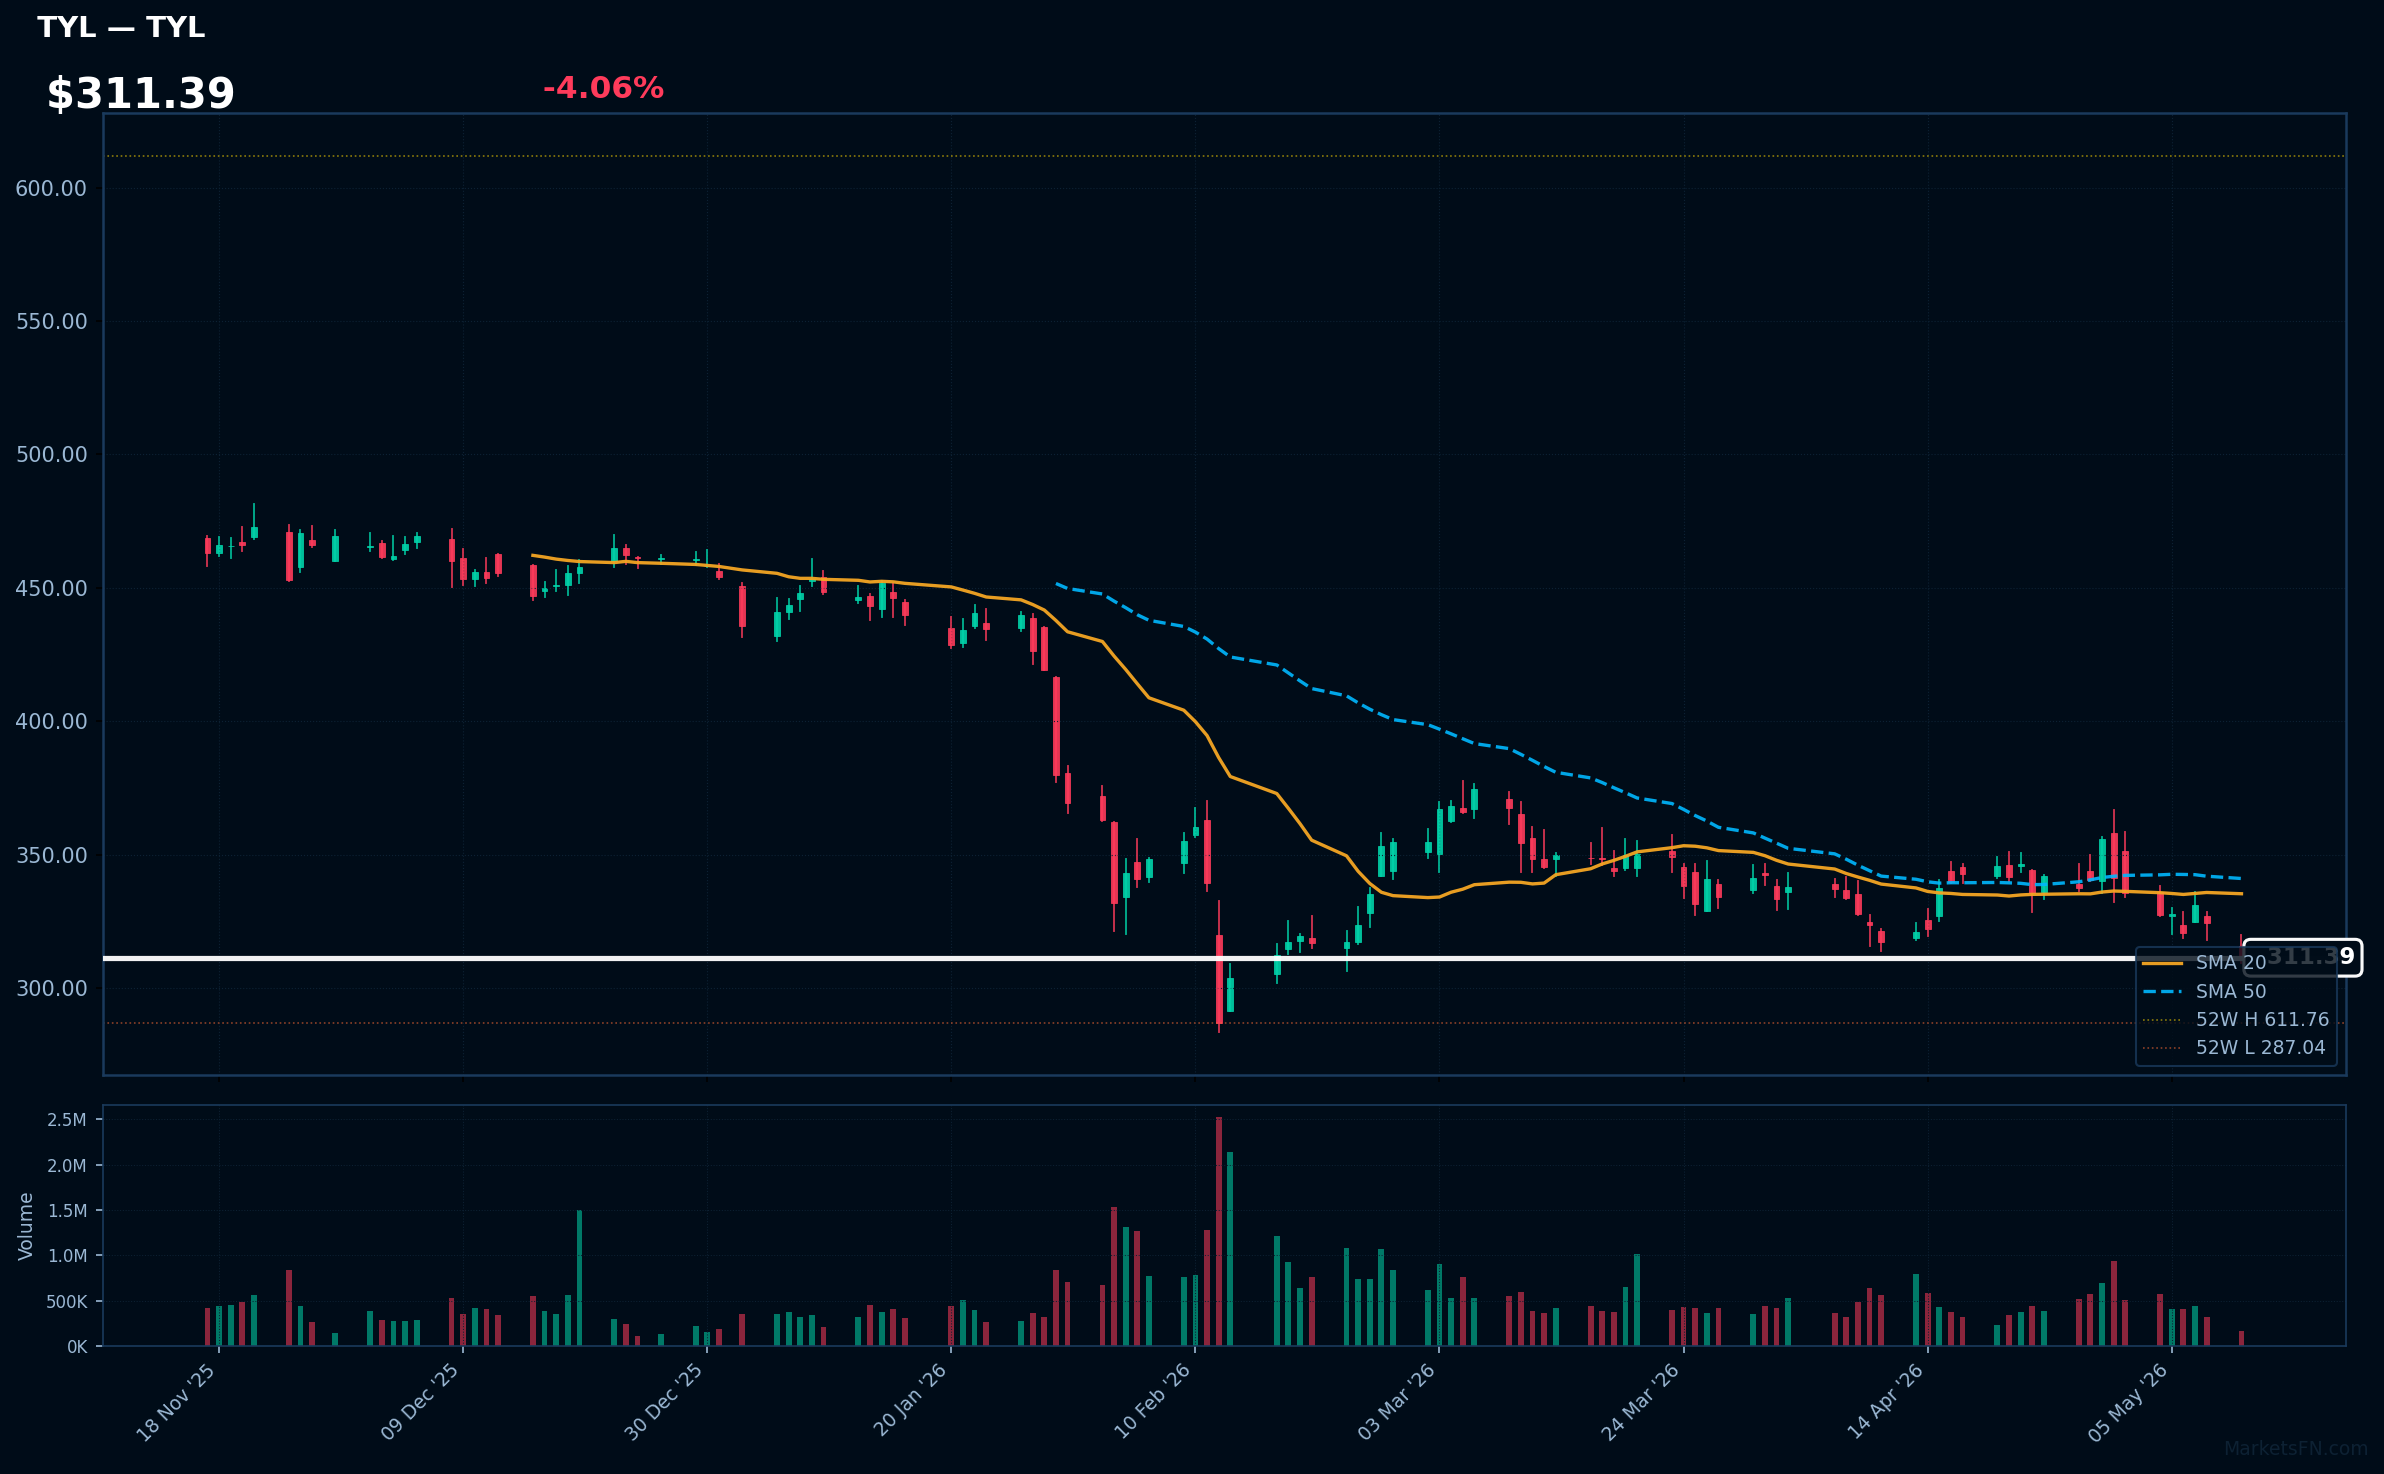
TYL | Tyler Technologies, Inc | Technology | Price: $311.39 | Day: -4.06% | 1W: -4.85% | 1M: -1.86% | RSI: 37.7 | vs MA200: -29.9% | Trend: Below MA20, MA50, MA200
Recent headlines (last 12h)
- Tyler Technologies, Inc. Announces Proposed Offering of Convertible Senior Notes Due 2031
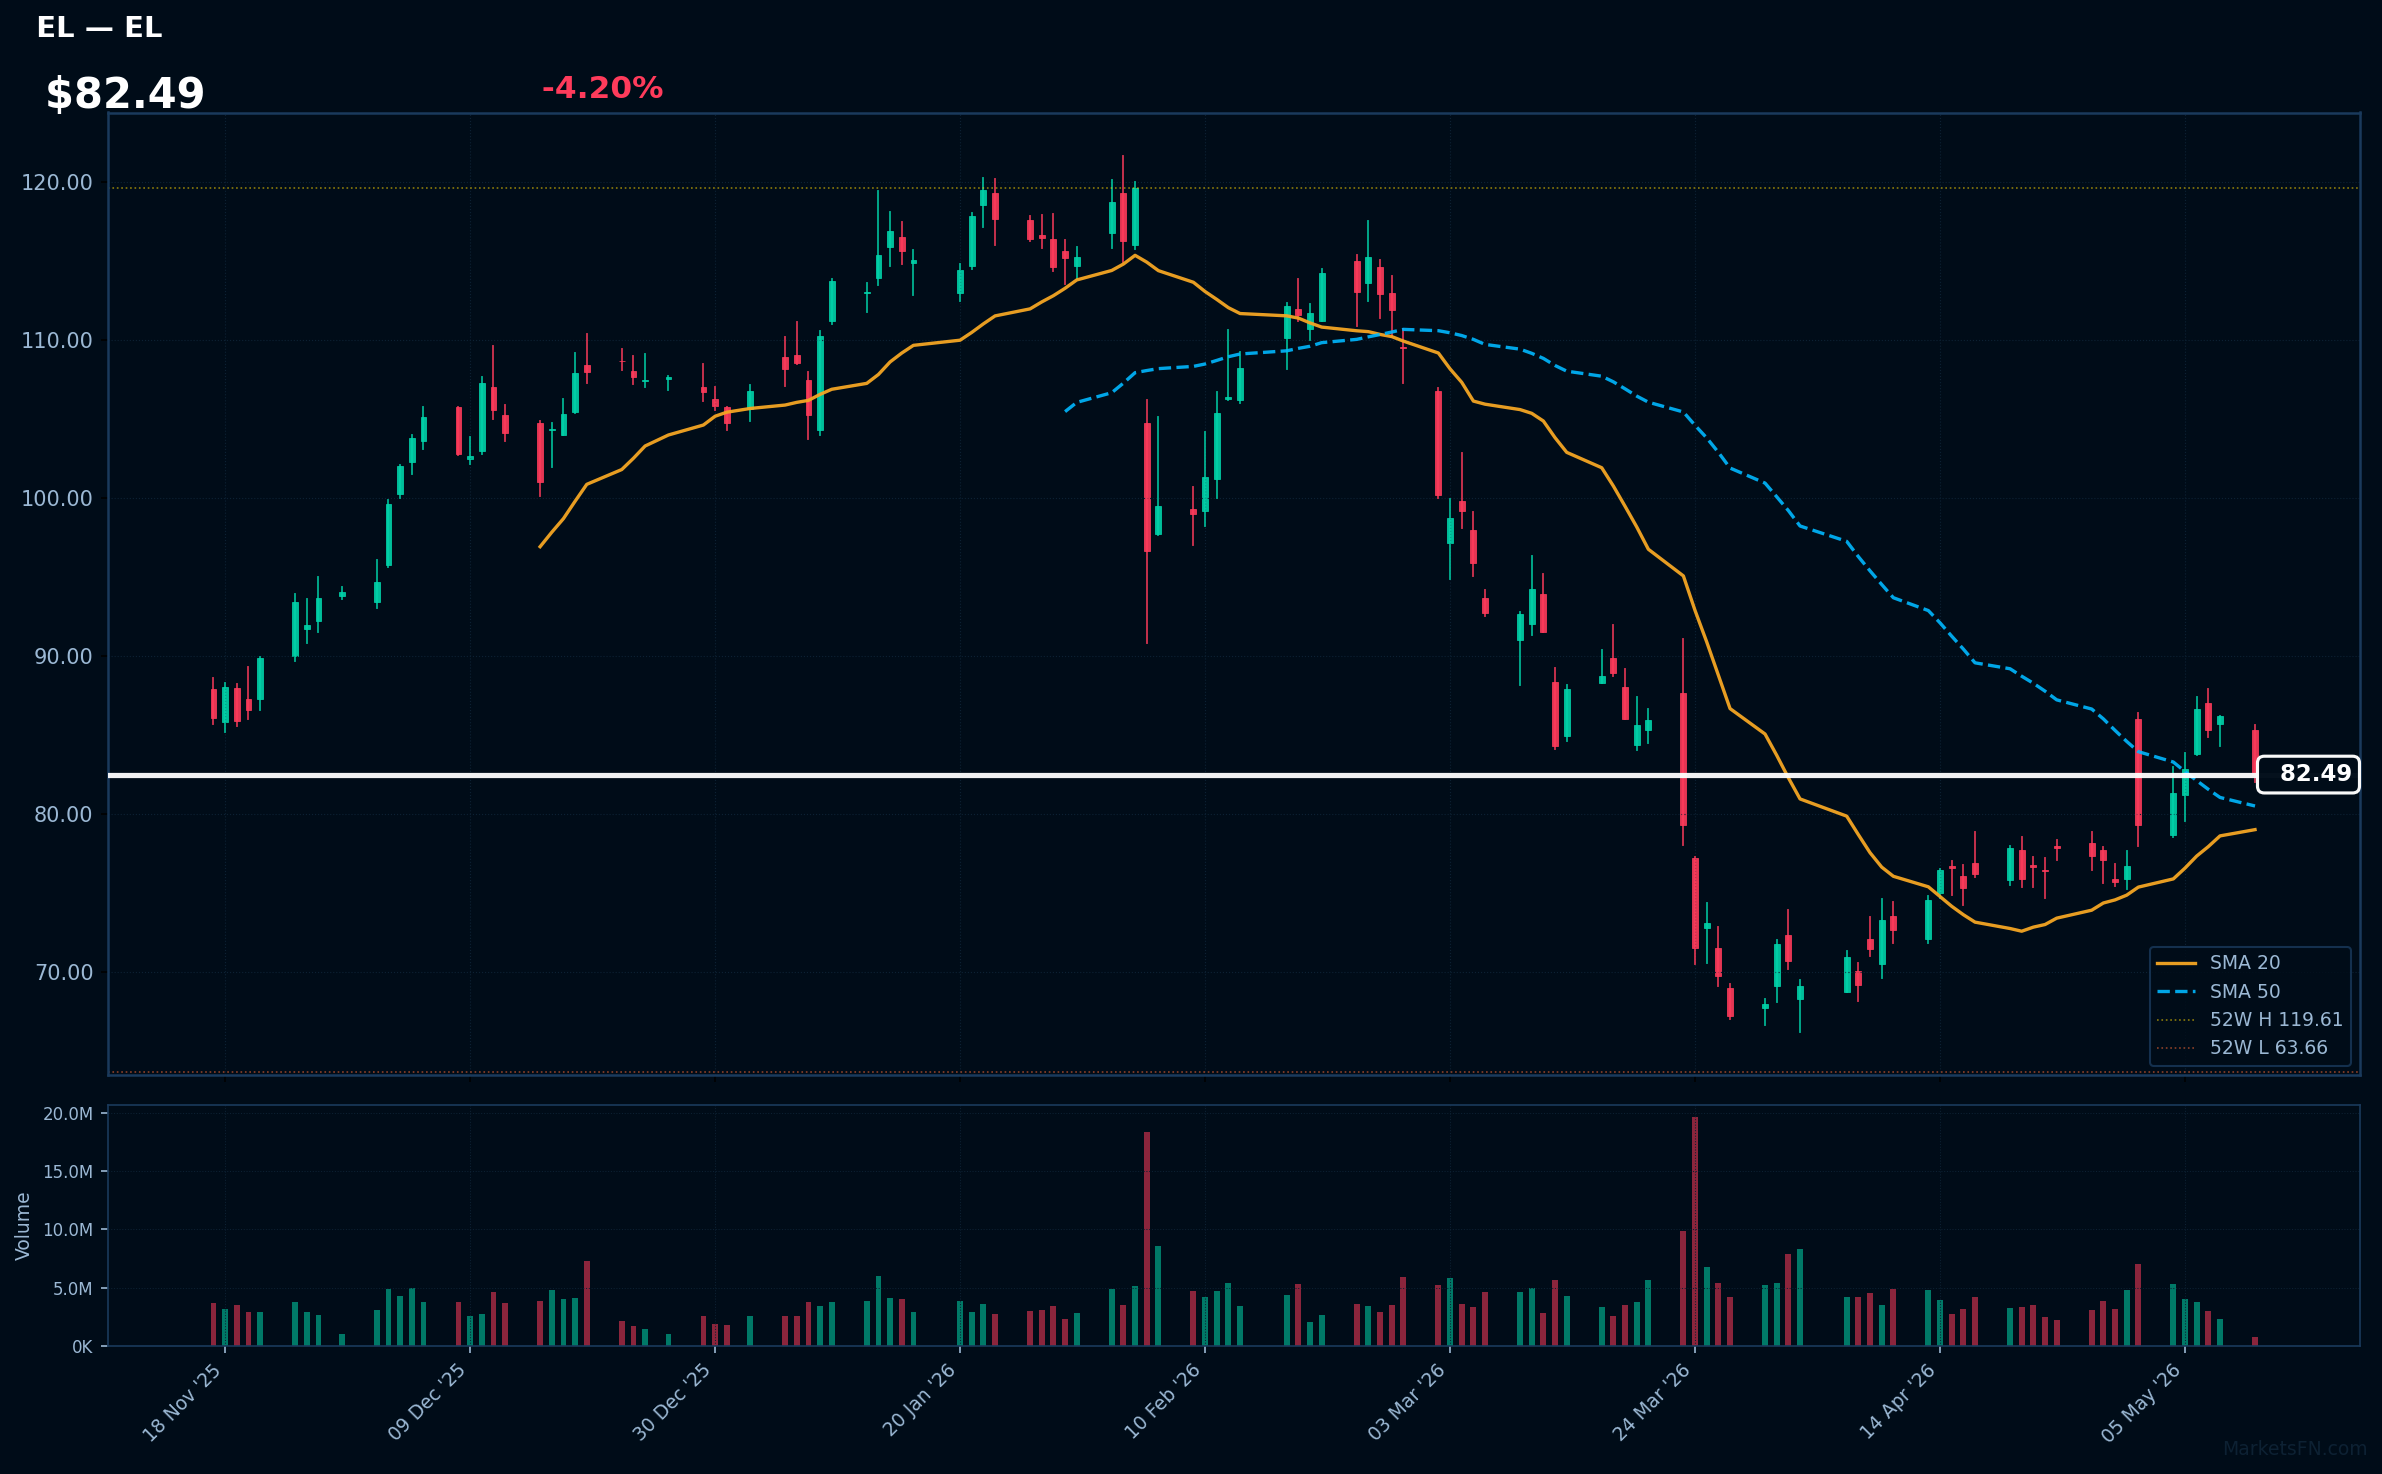
EL | Estee Lauder Cos., Inc | Consumer Defensive | Price: $82.58 | Day: -4.20% | 1W: +1.43% | 1M: +13.51% | RSI: 54.8 | vs MA200: -12.2% | Trend: Above MA20, MA50 · Below MA200
Recent headlines (last 12h)
- Zara owner denies Jo Malone trademark breach in UK court report
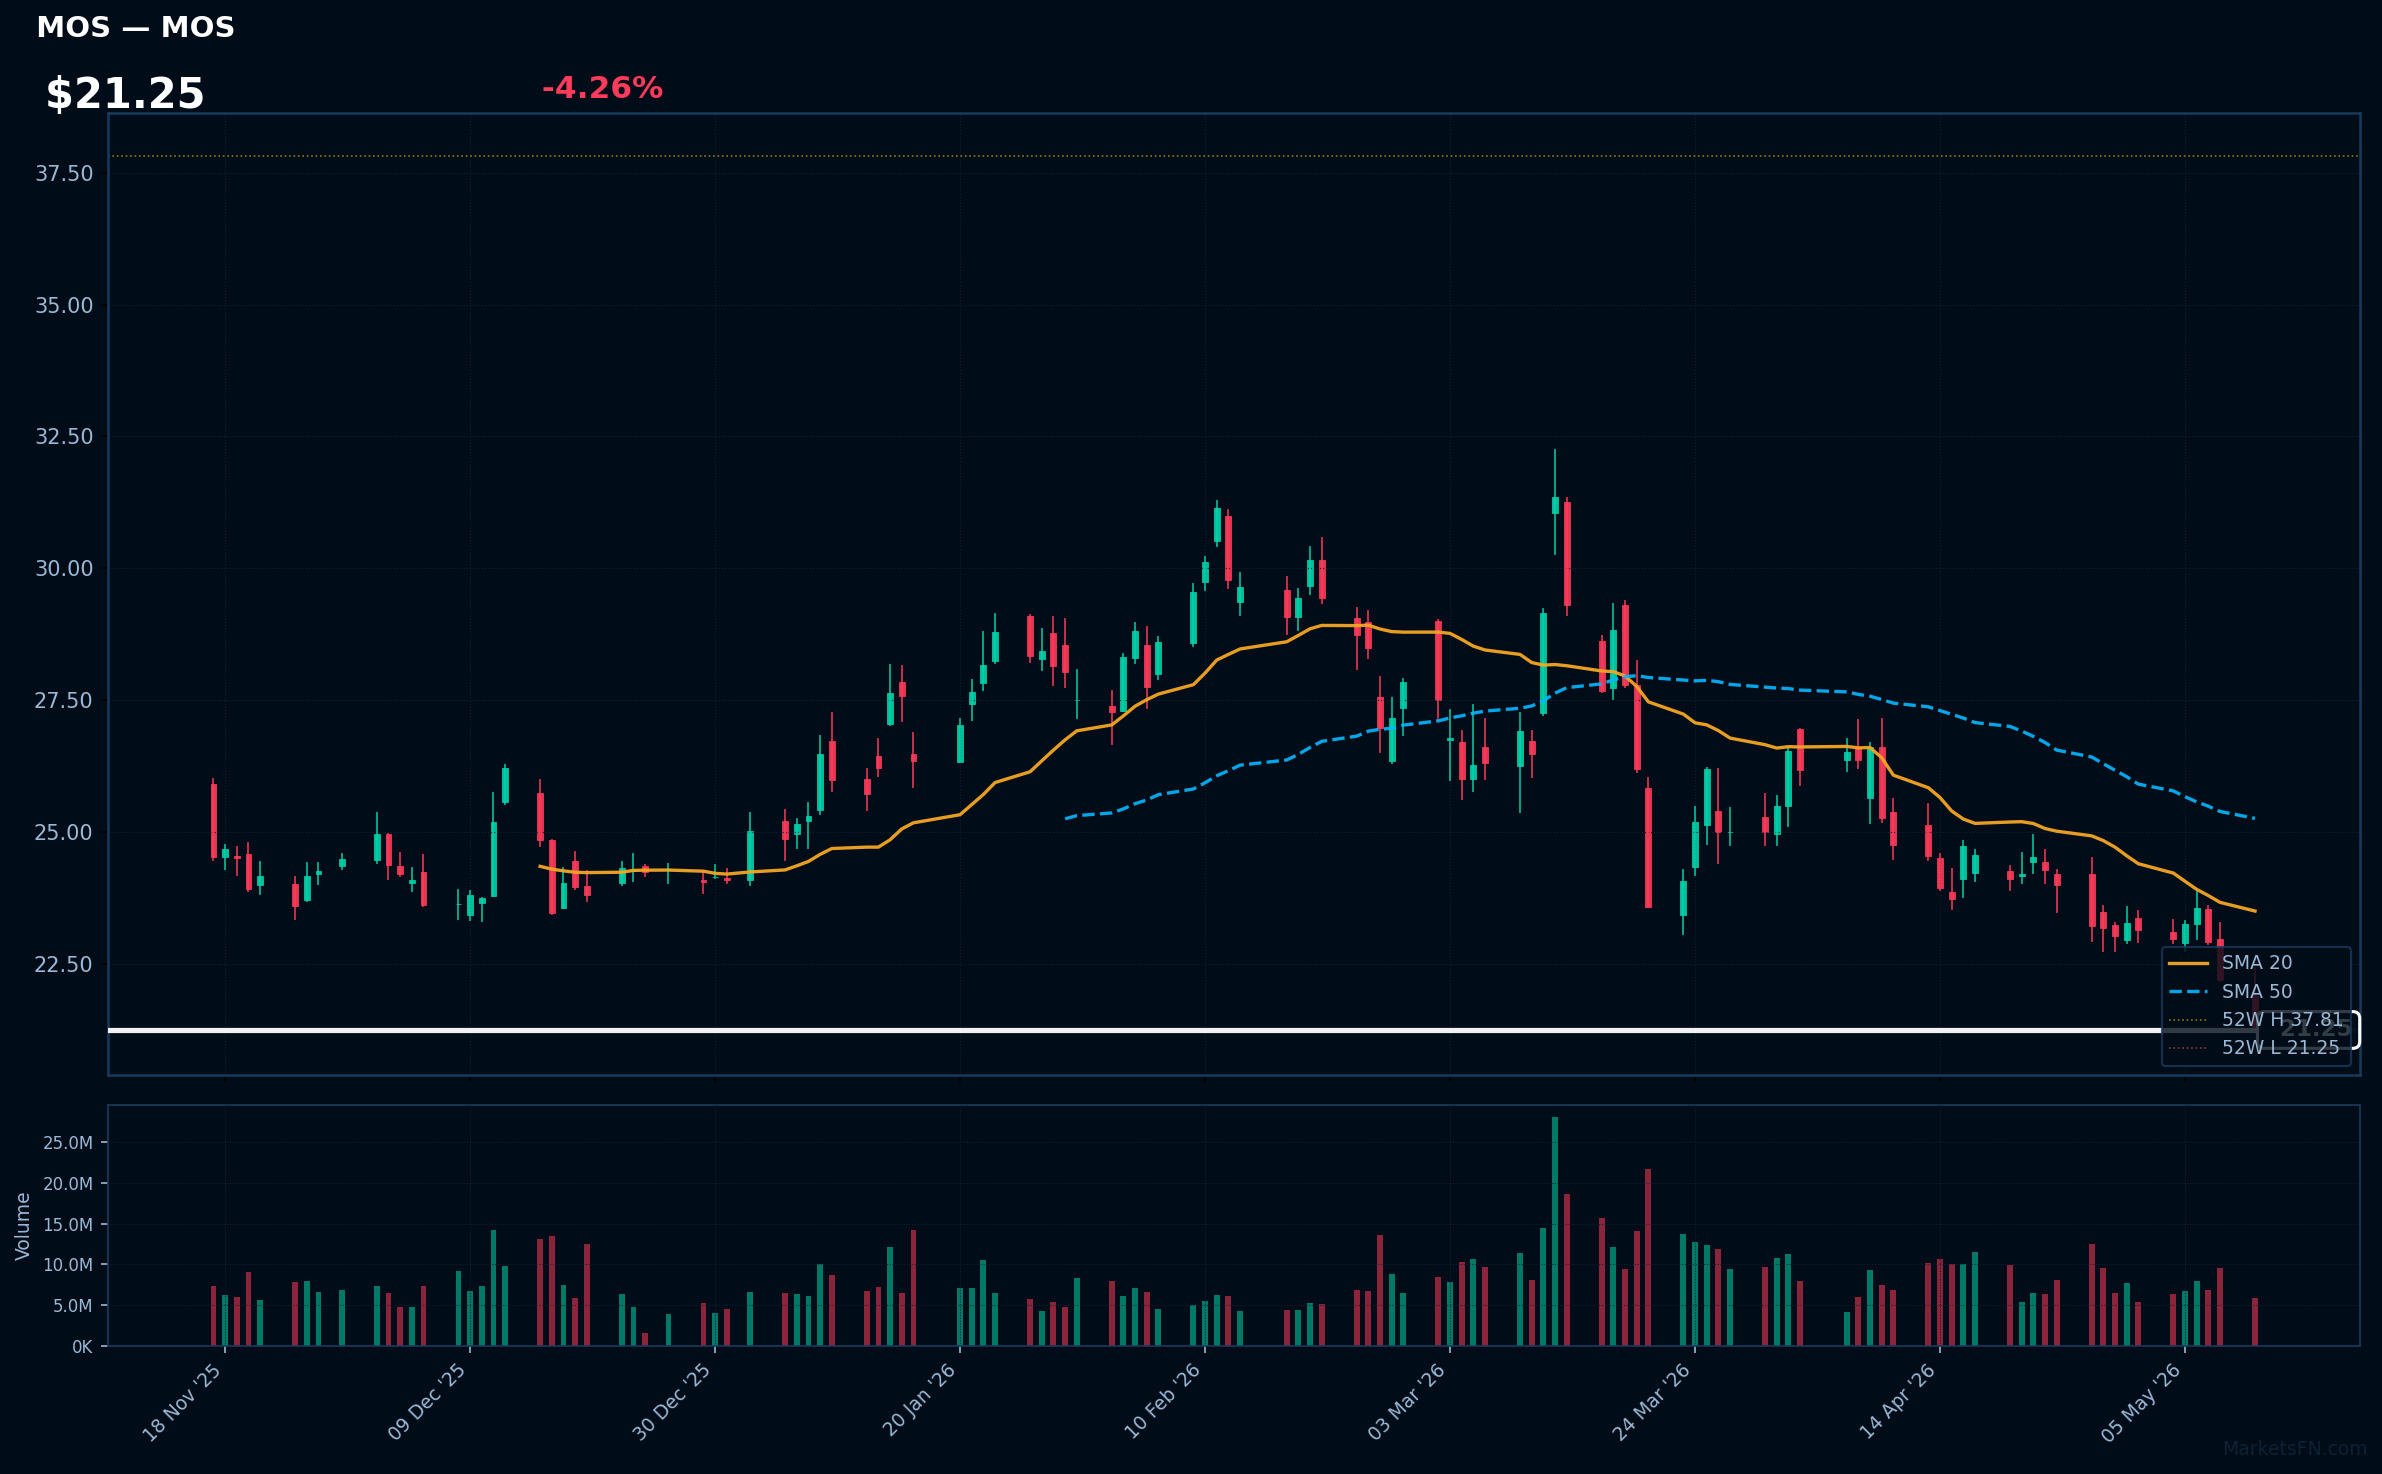
MOS | Mosaic Company | Basic Materials | Price: $21.25 | Day: -4.26% | 1W: -7.49% | 1M: -14.18% | RSI: 29.2 | vs MA200: -24.9% | Trend: Below MA20, MA50, MA200
Recent headlines (last 12h)
- Mosaic Posts Loss In Q1; Withdraws Phosphate Production Guidance For 2026
- Mosaic Stock Falls After Earnings. The Iran War Is a Double-Edged Sword.
- Mosaic: Q1 Earnings Snapshot
- Mosaic Announces First Quarter 2026 Results
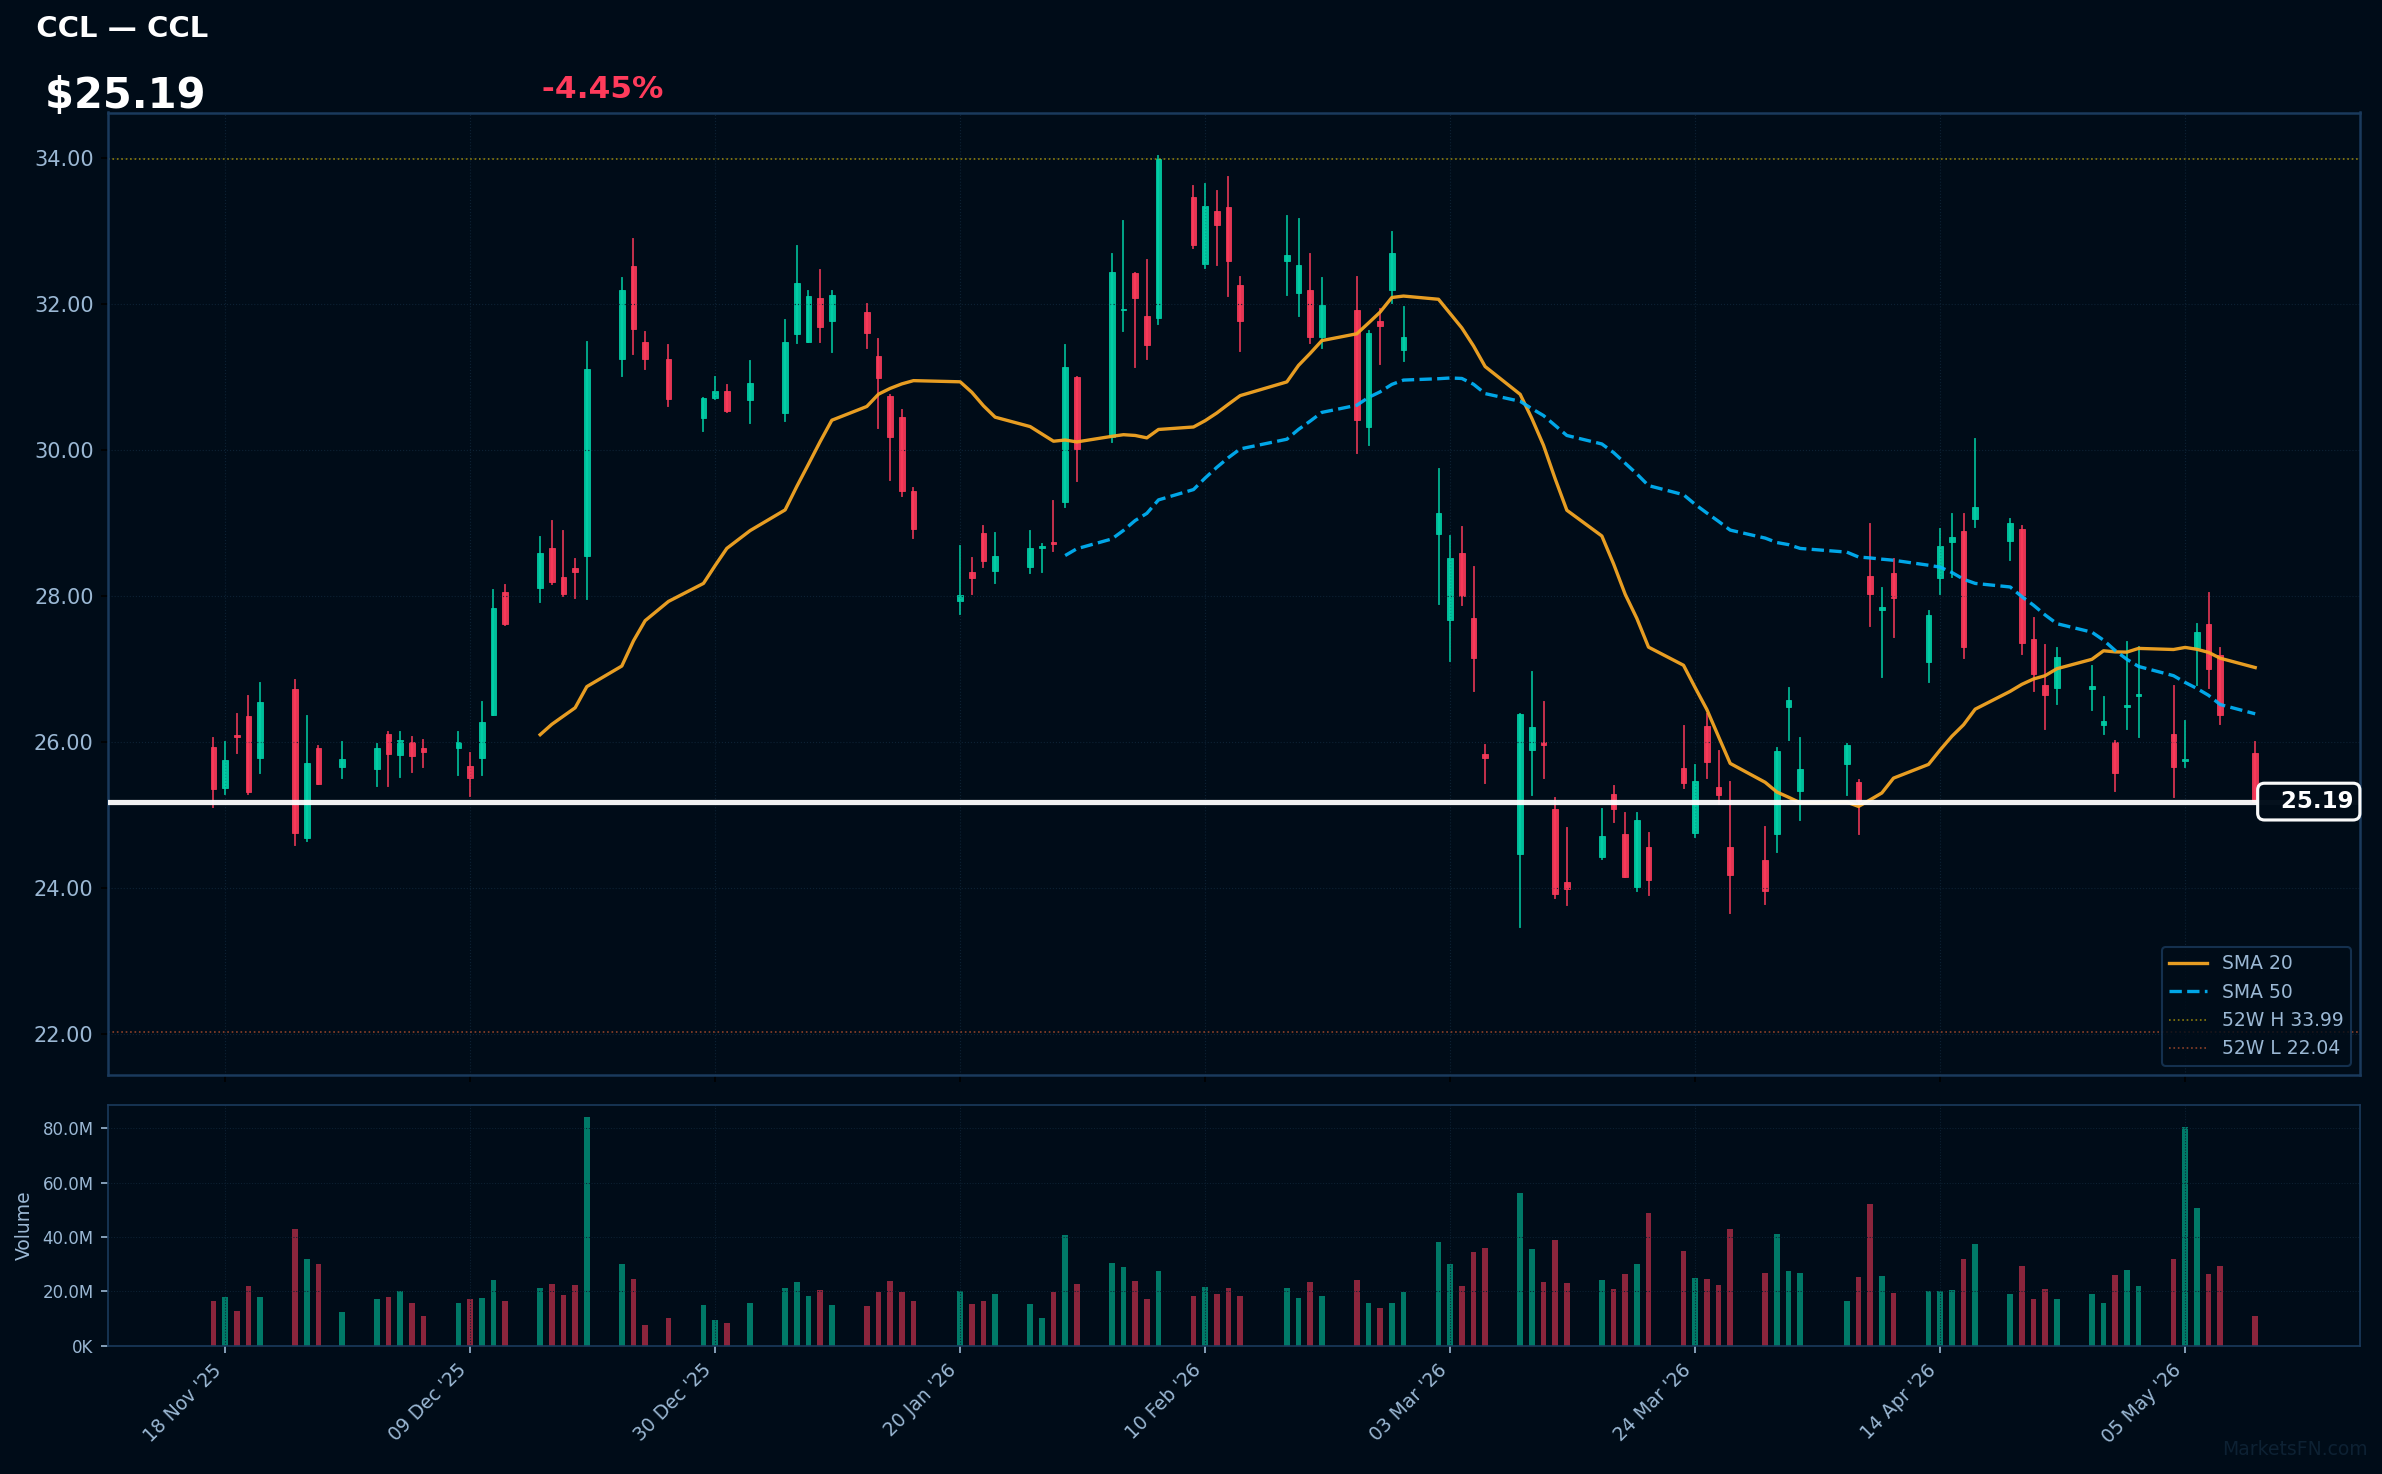
CCL | Carnival Corp | Consumer Cyclical | Price: $25.20 | Day: -4.45% | 1W: -1.87% | 1M: -9.97% | RSI: 42.4 | vs MA200: -12.4% | Trend: Below MA20, MA50, MA200
Recent headlines (last 12h)
- S&P 500 set for muted open as Trump brands Iran offer 'totally unacceptable'
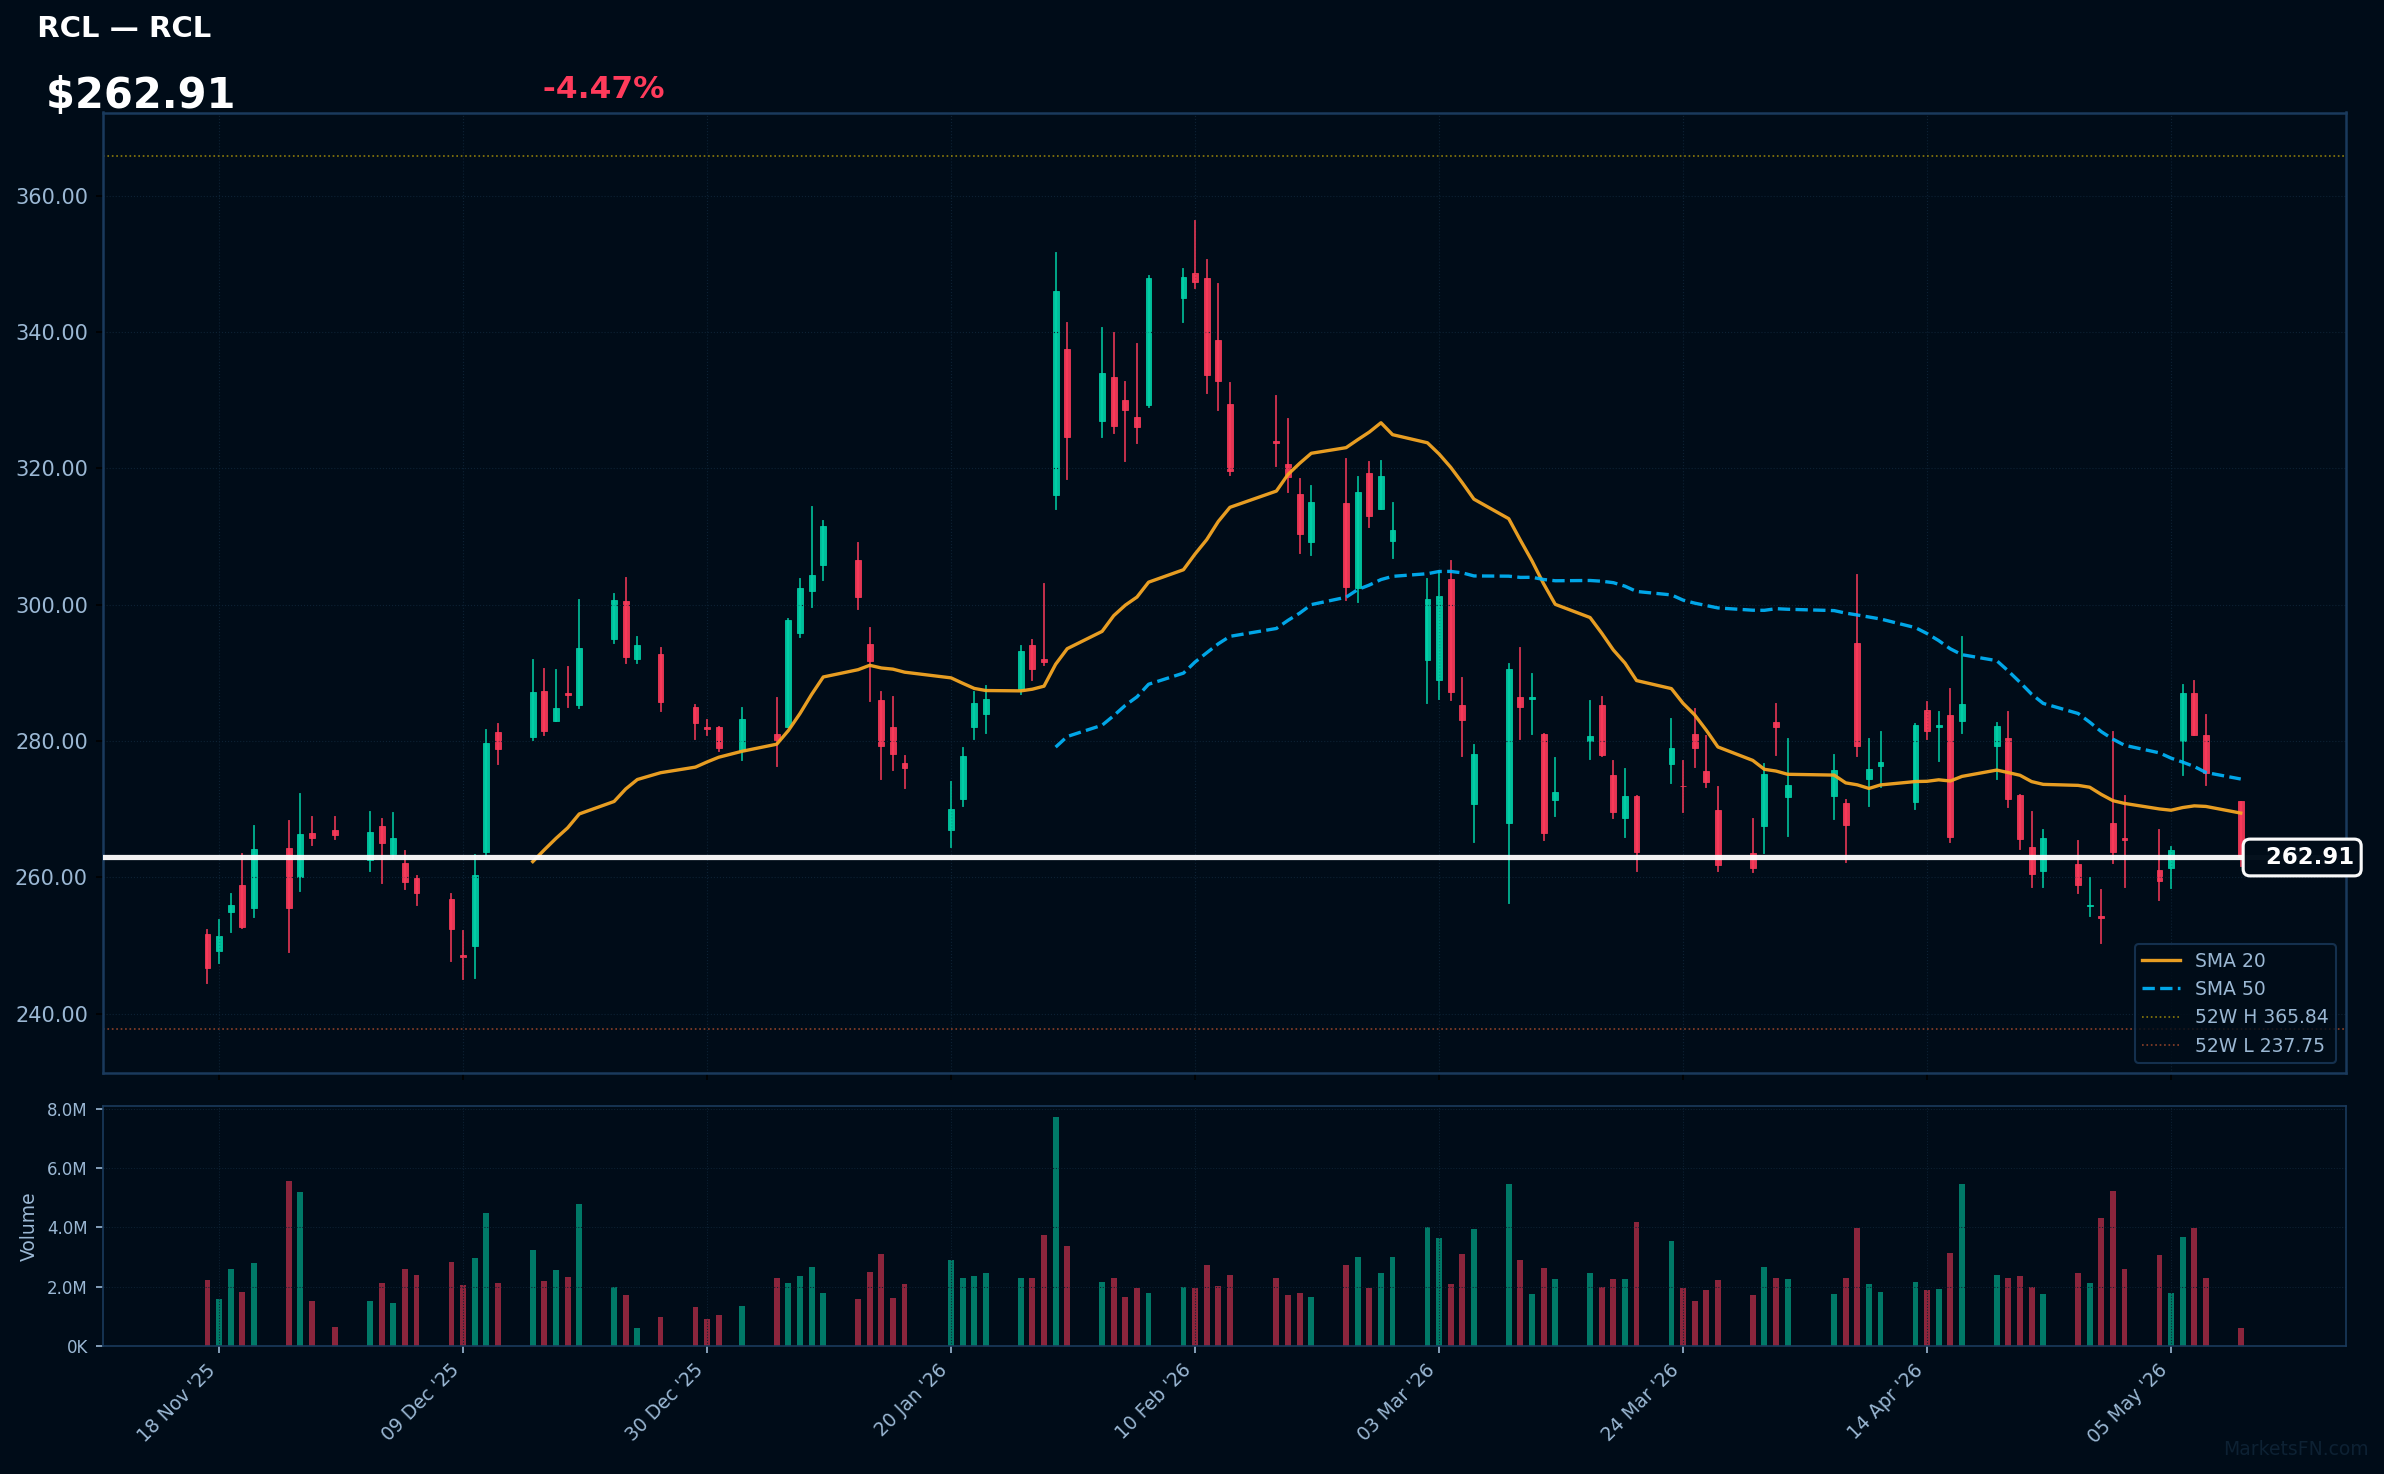
RCL | Royal Caribbean Group | Consumer Cyclical | Price: $262.95 | Day: -4.47% | 1W: +1.32% | 1M: -5.07% | RSI: 45.7 | vs MA200: -11.6% | Trend: Below MA20, MA50, MA200
Recent headlines (last 12h)
- S&P 500 set for muted open as Trump brands Iran offer 'totally unacceptable'
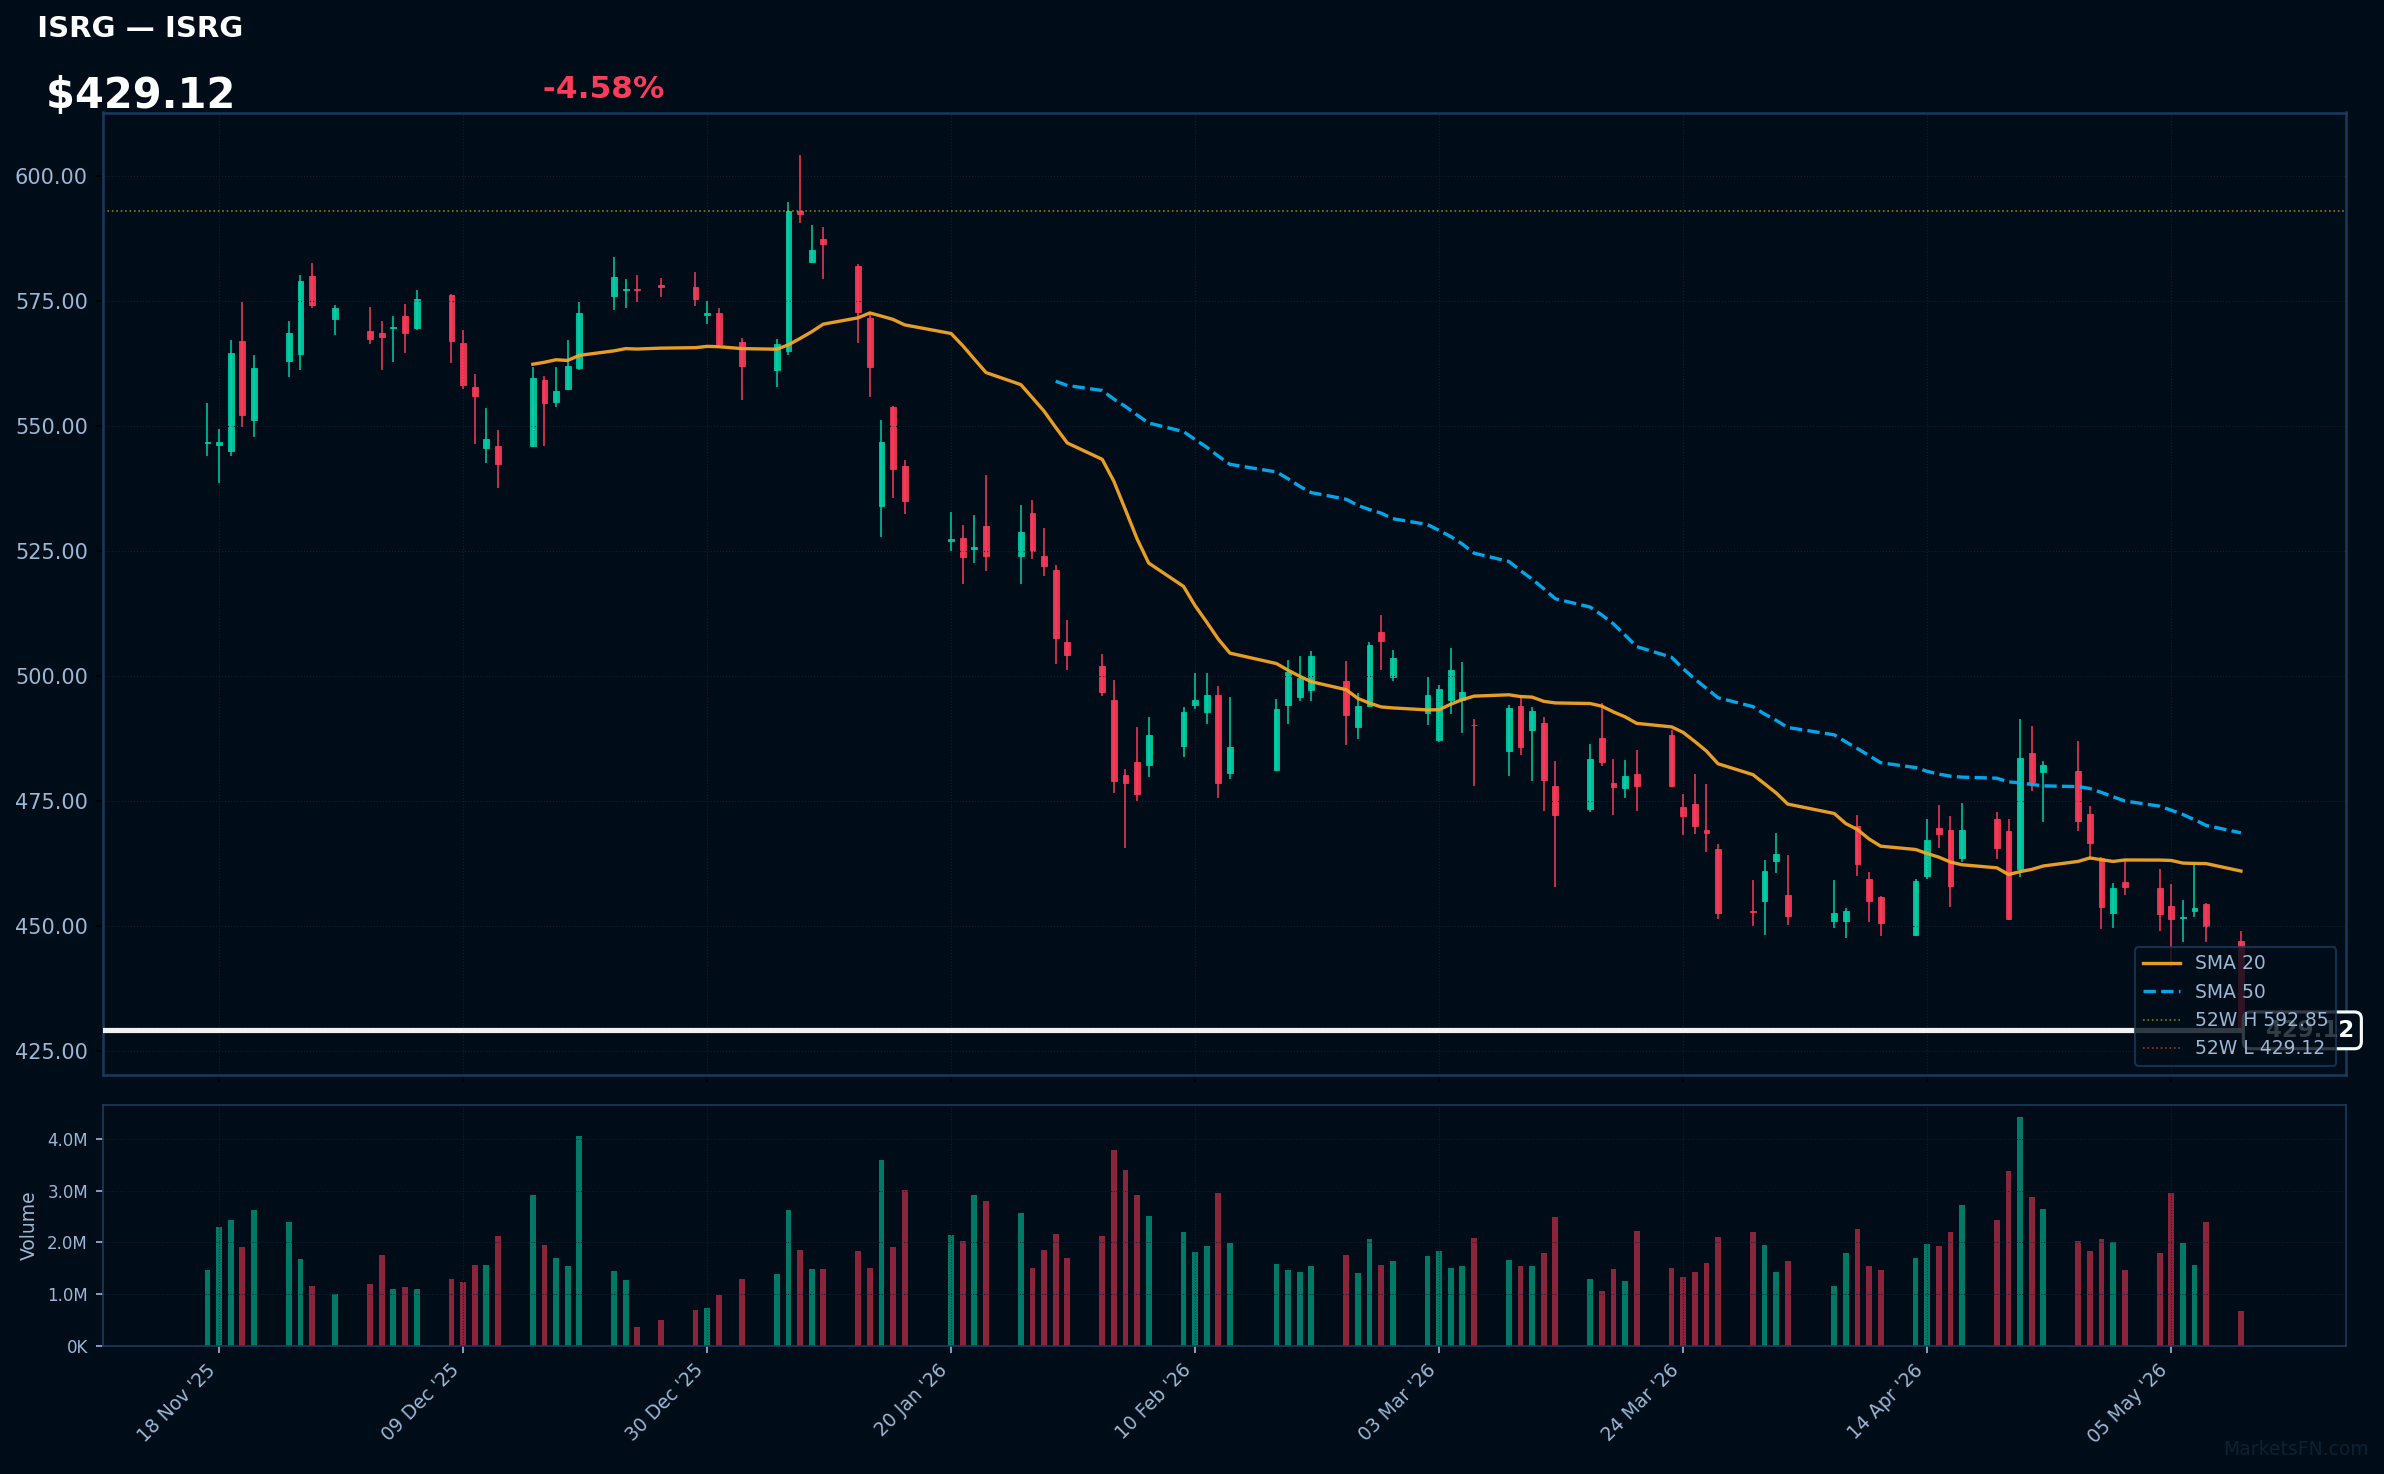
ISRG | Intuitive Surgical Inc | Healthcare | Price: $429.43 | Day: -4.58% | 1W: -5.14% | 1M: -4.77% | RSI: 32.7 | vs MA200: -13.8% | Trend: Below MA20, MA50, MA200
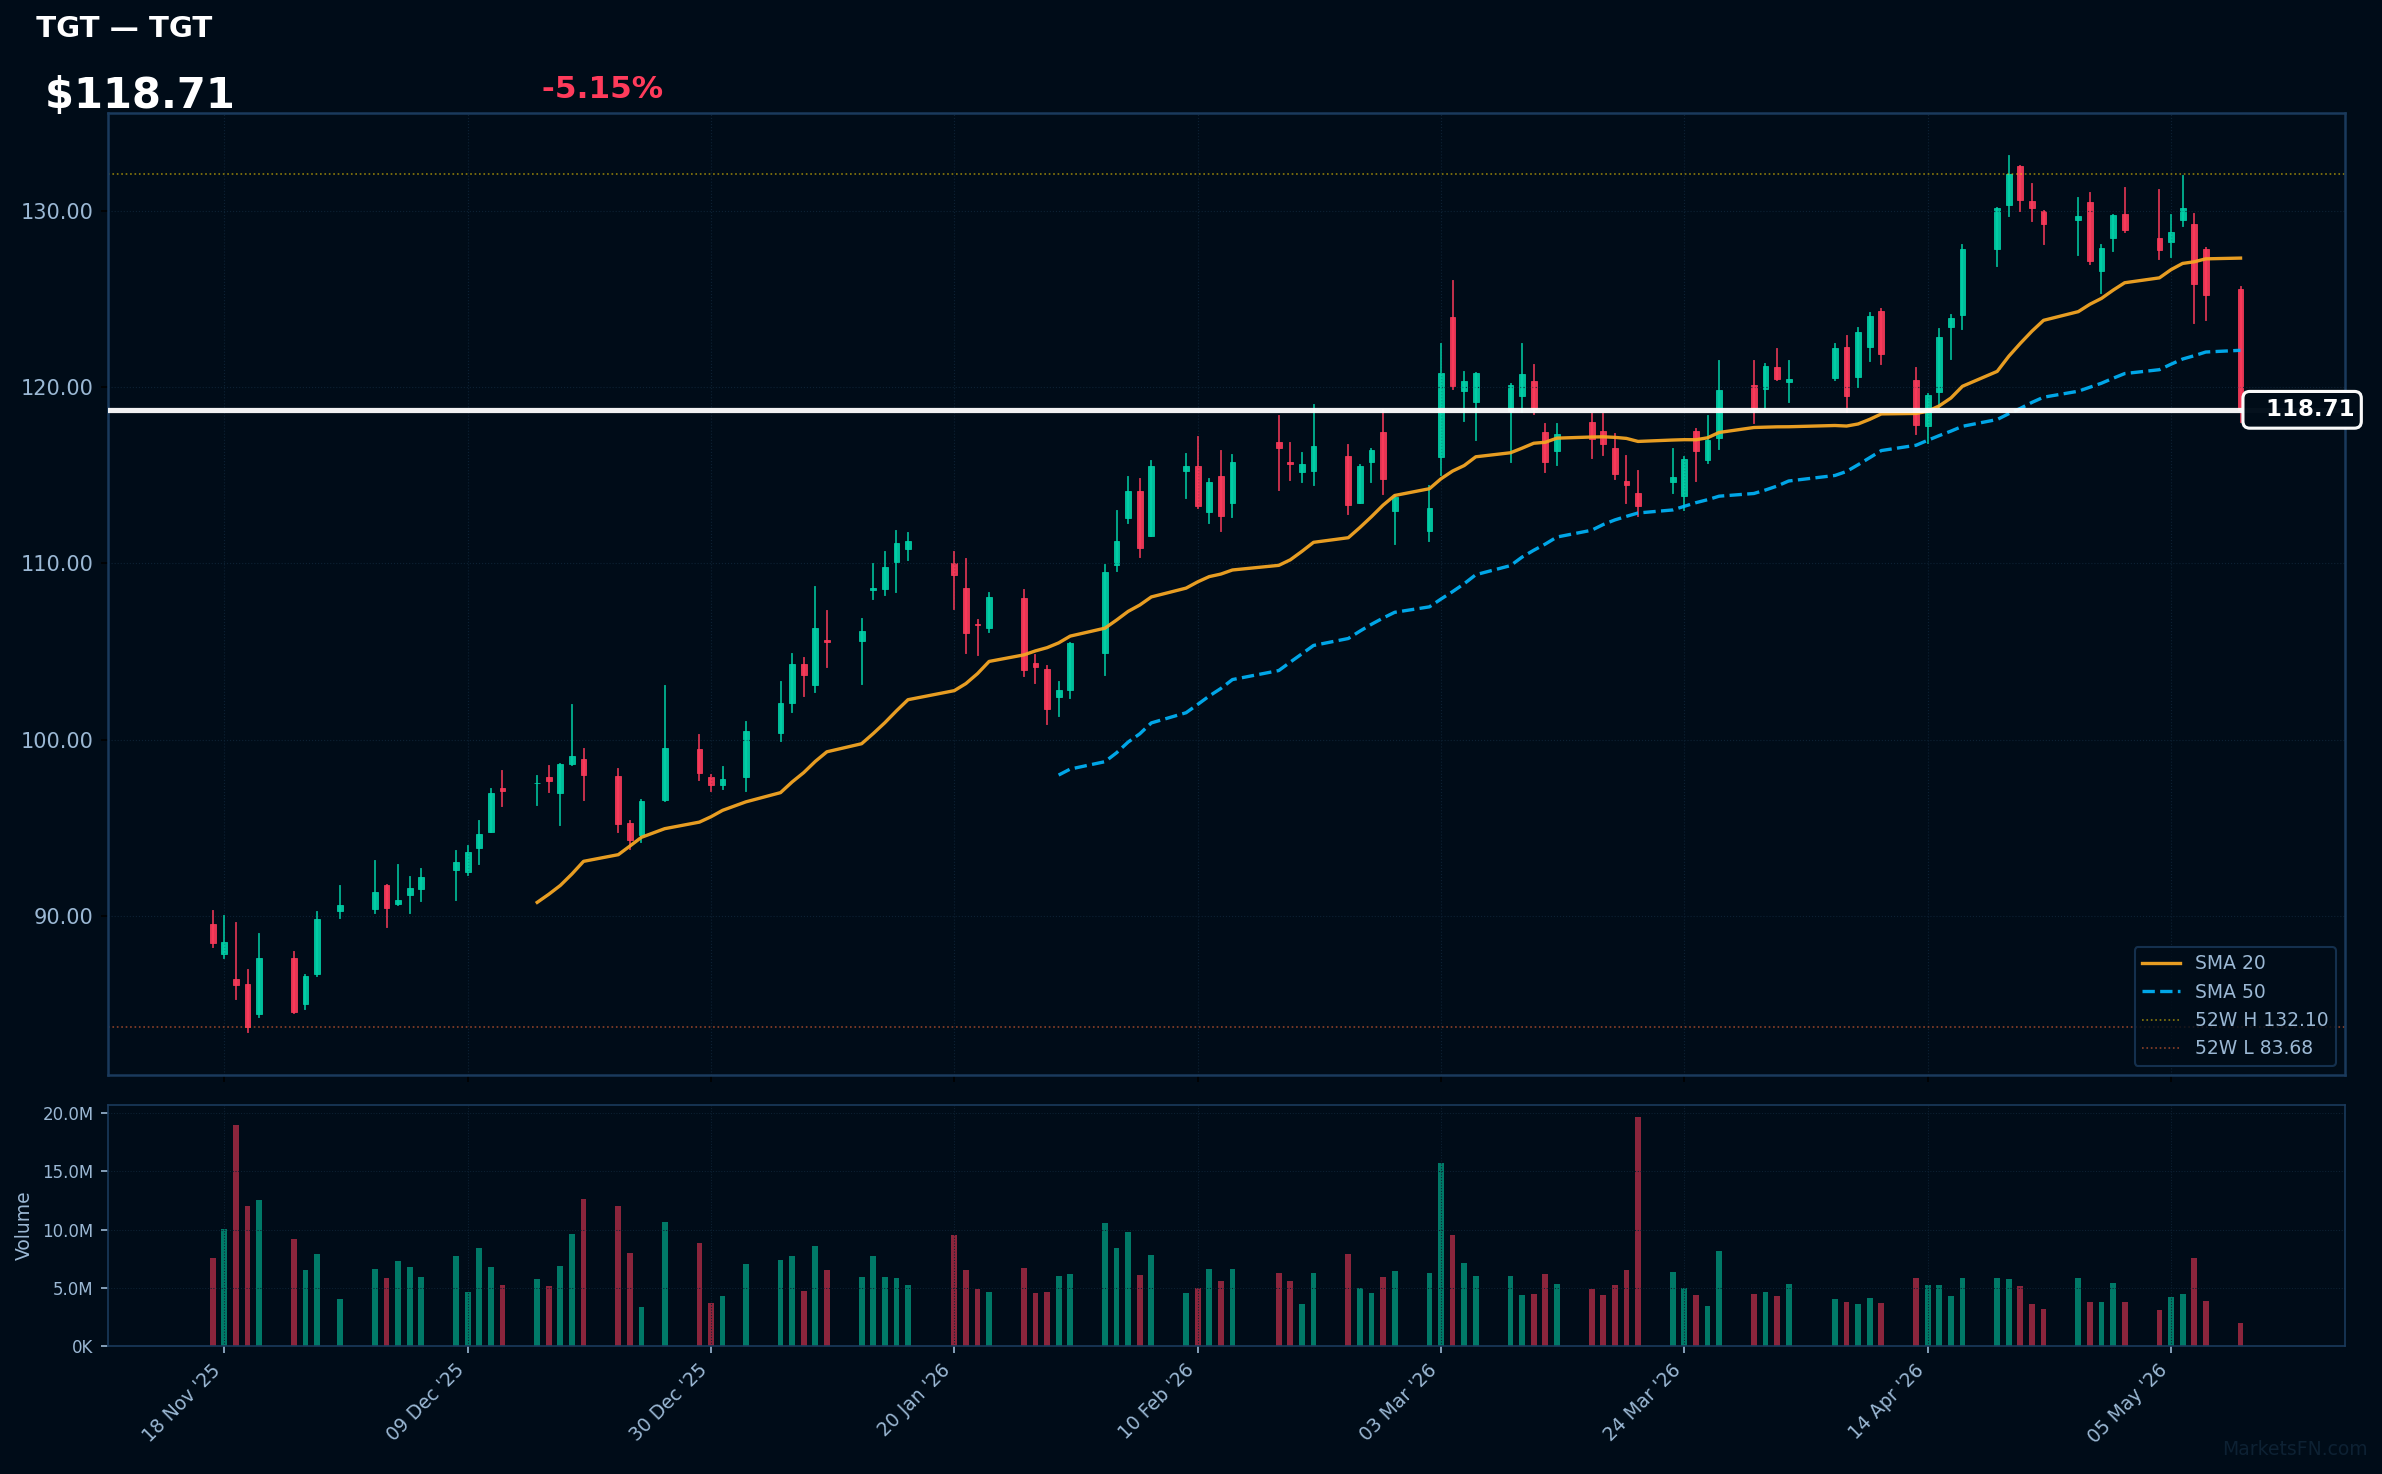
TGT | Target Corp | Consumer Defensive | Price: $118.80 | Day: -5.15% | 1W: -7.08% | 1M: -2.60% | RSI: 37.6 | vs MA200: +14.1% | Trend: Above MA200 · Below MA20, MA50
Recent headlines (last 12h)
- S&P 500 set for muted open as Trump brands Iran offer 'totally unacceptable'
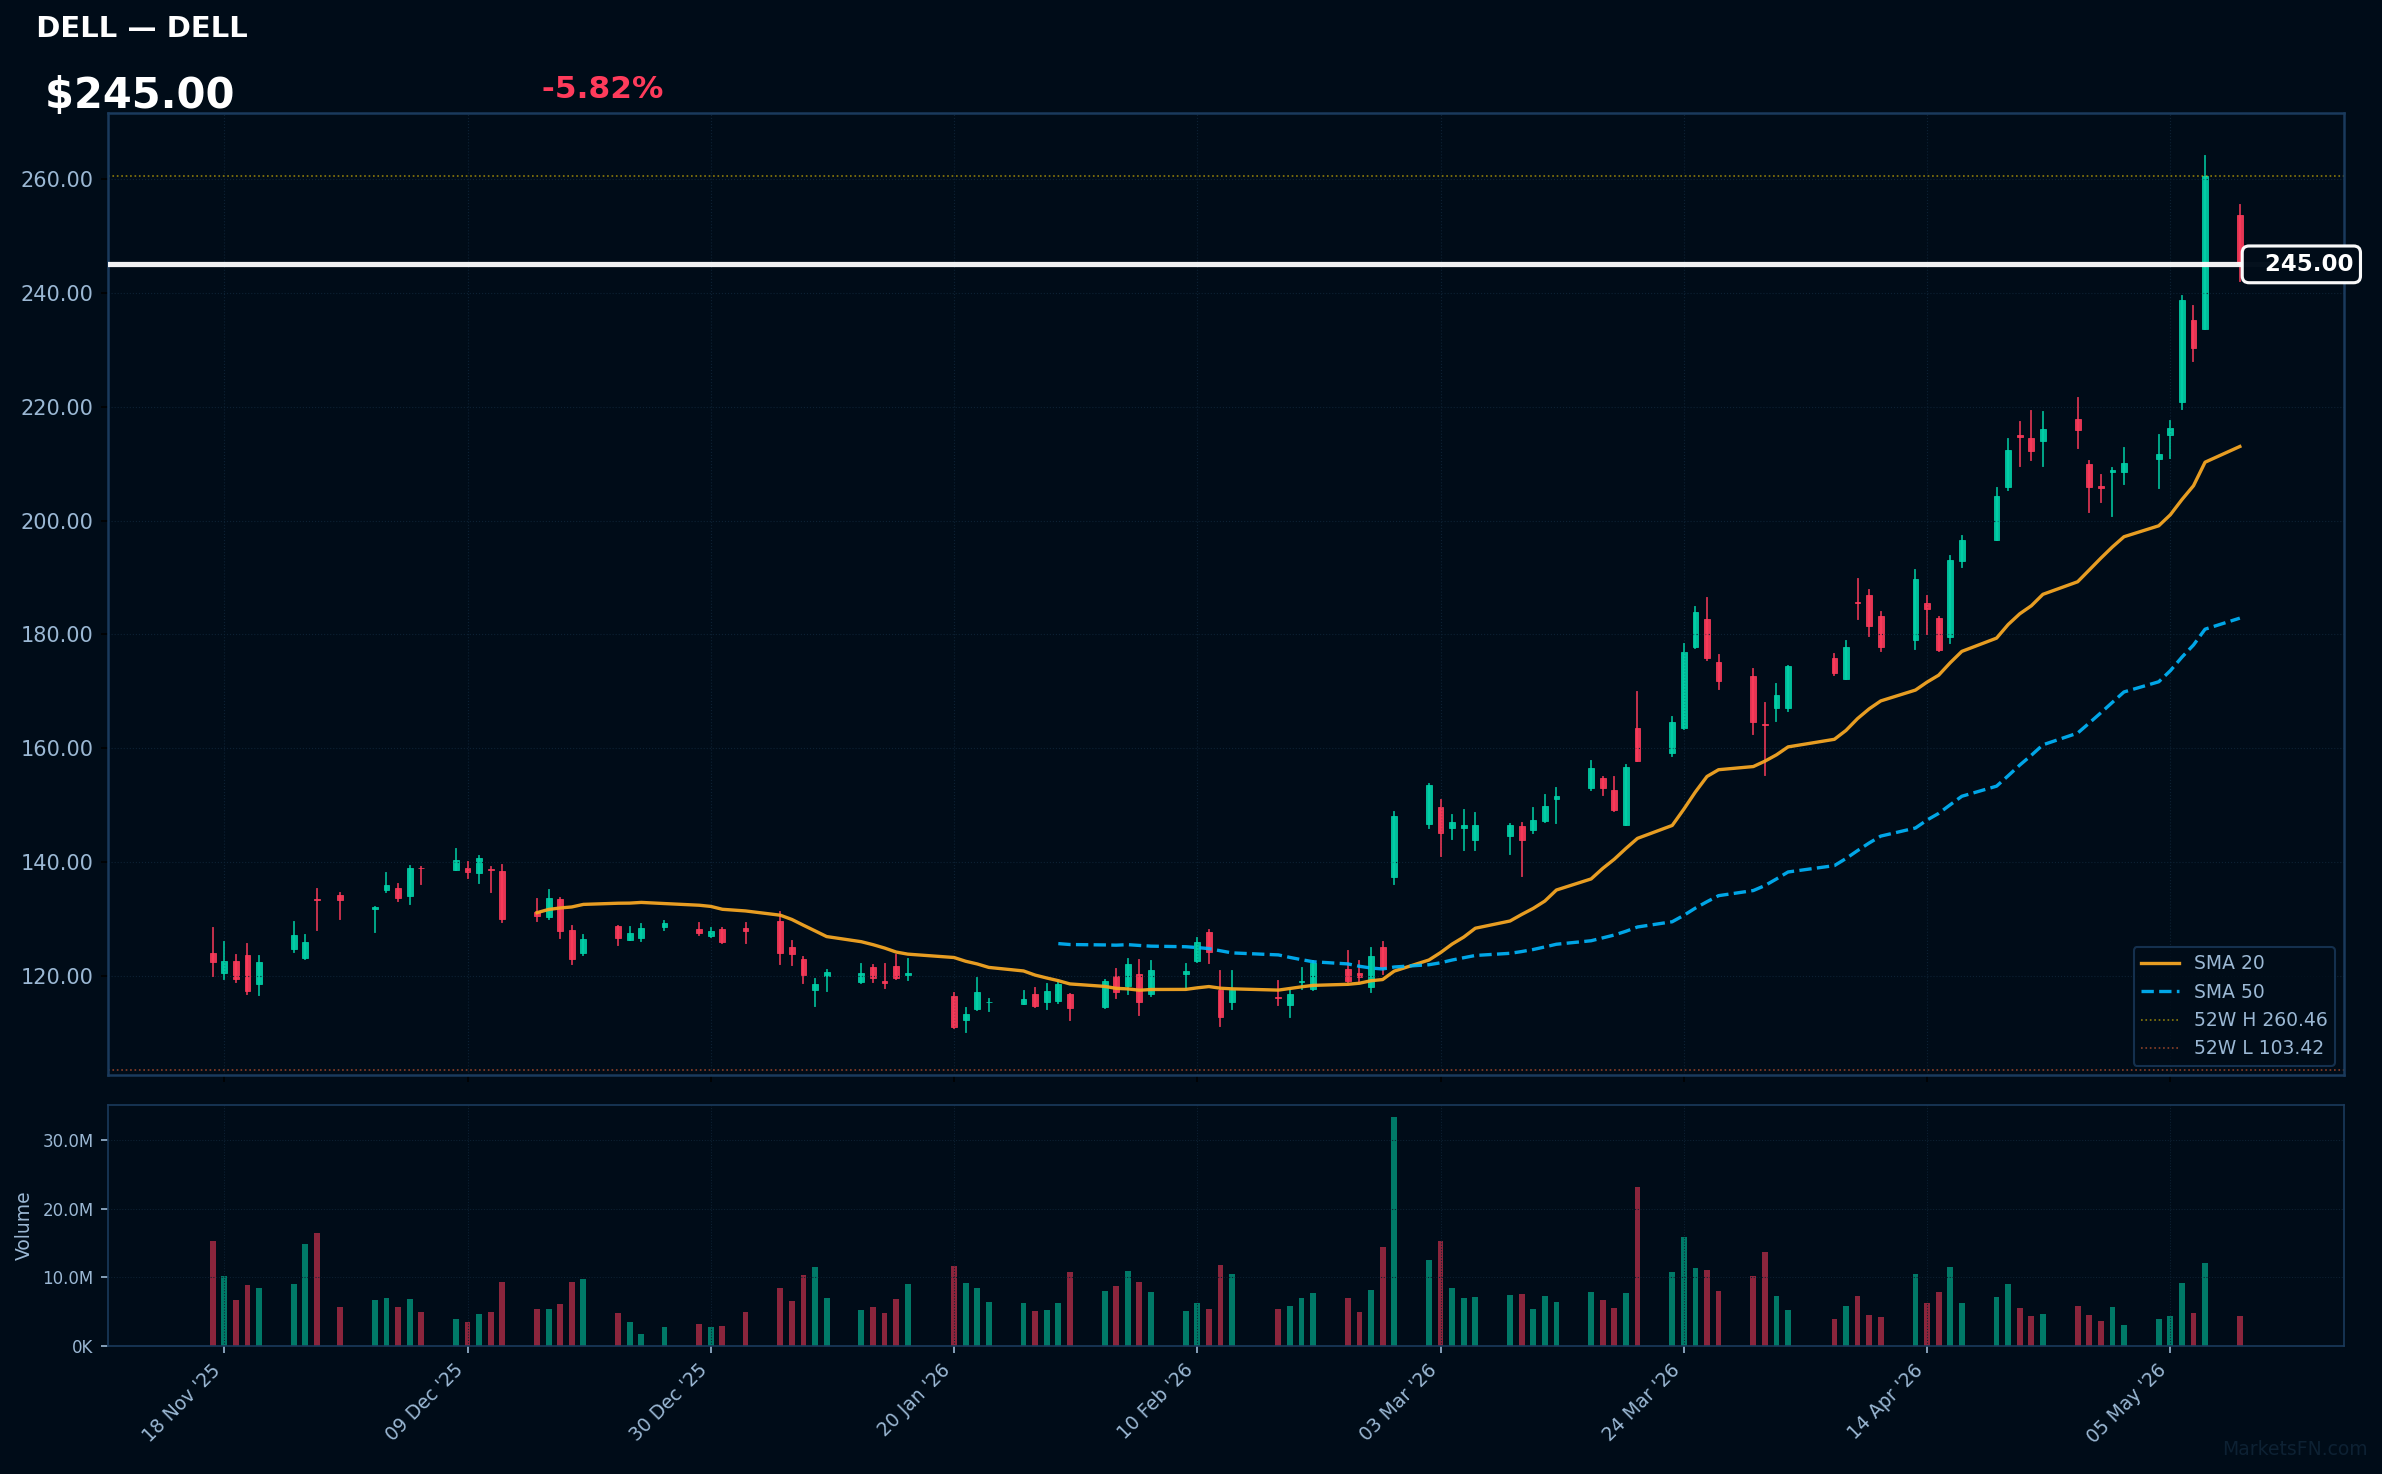
DELL | Dell Technologies Inc | Technology | Price: $245.30 | Day: -5.82% | 1W: +15.76% | 1M: +37.80% | RSI: 67.5 | vs MA200: +69.2% | Trend: Above MA20, MA50, MA200
Recent headlines (last 12h)
- Dell downgraded, Uber upgraded: Wall Street's top analyst calls
- After a 170% surge, UBS says Dells AI story is fully priced in
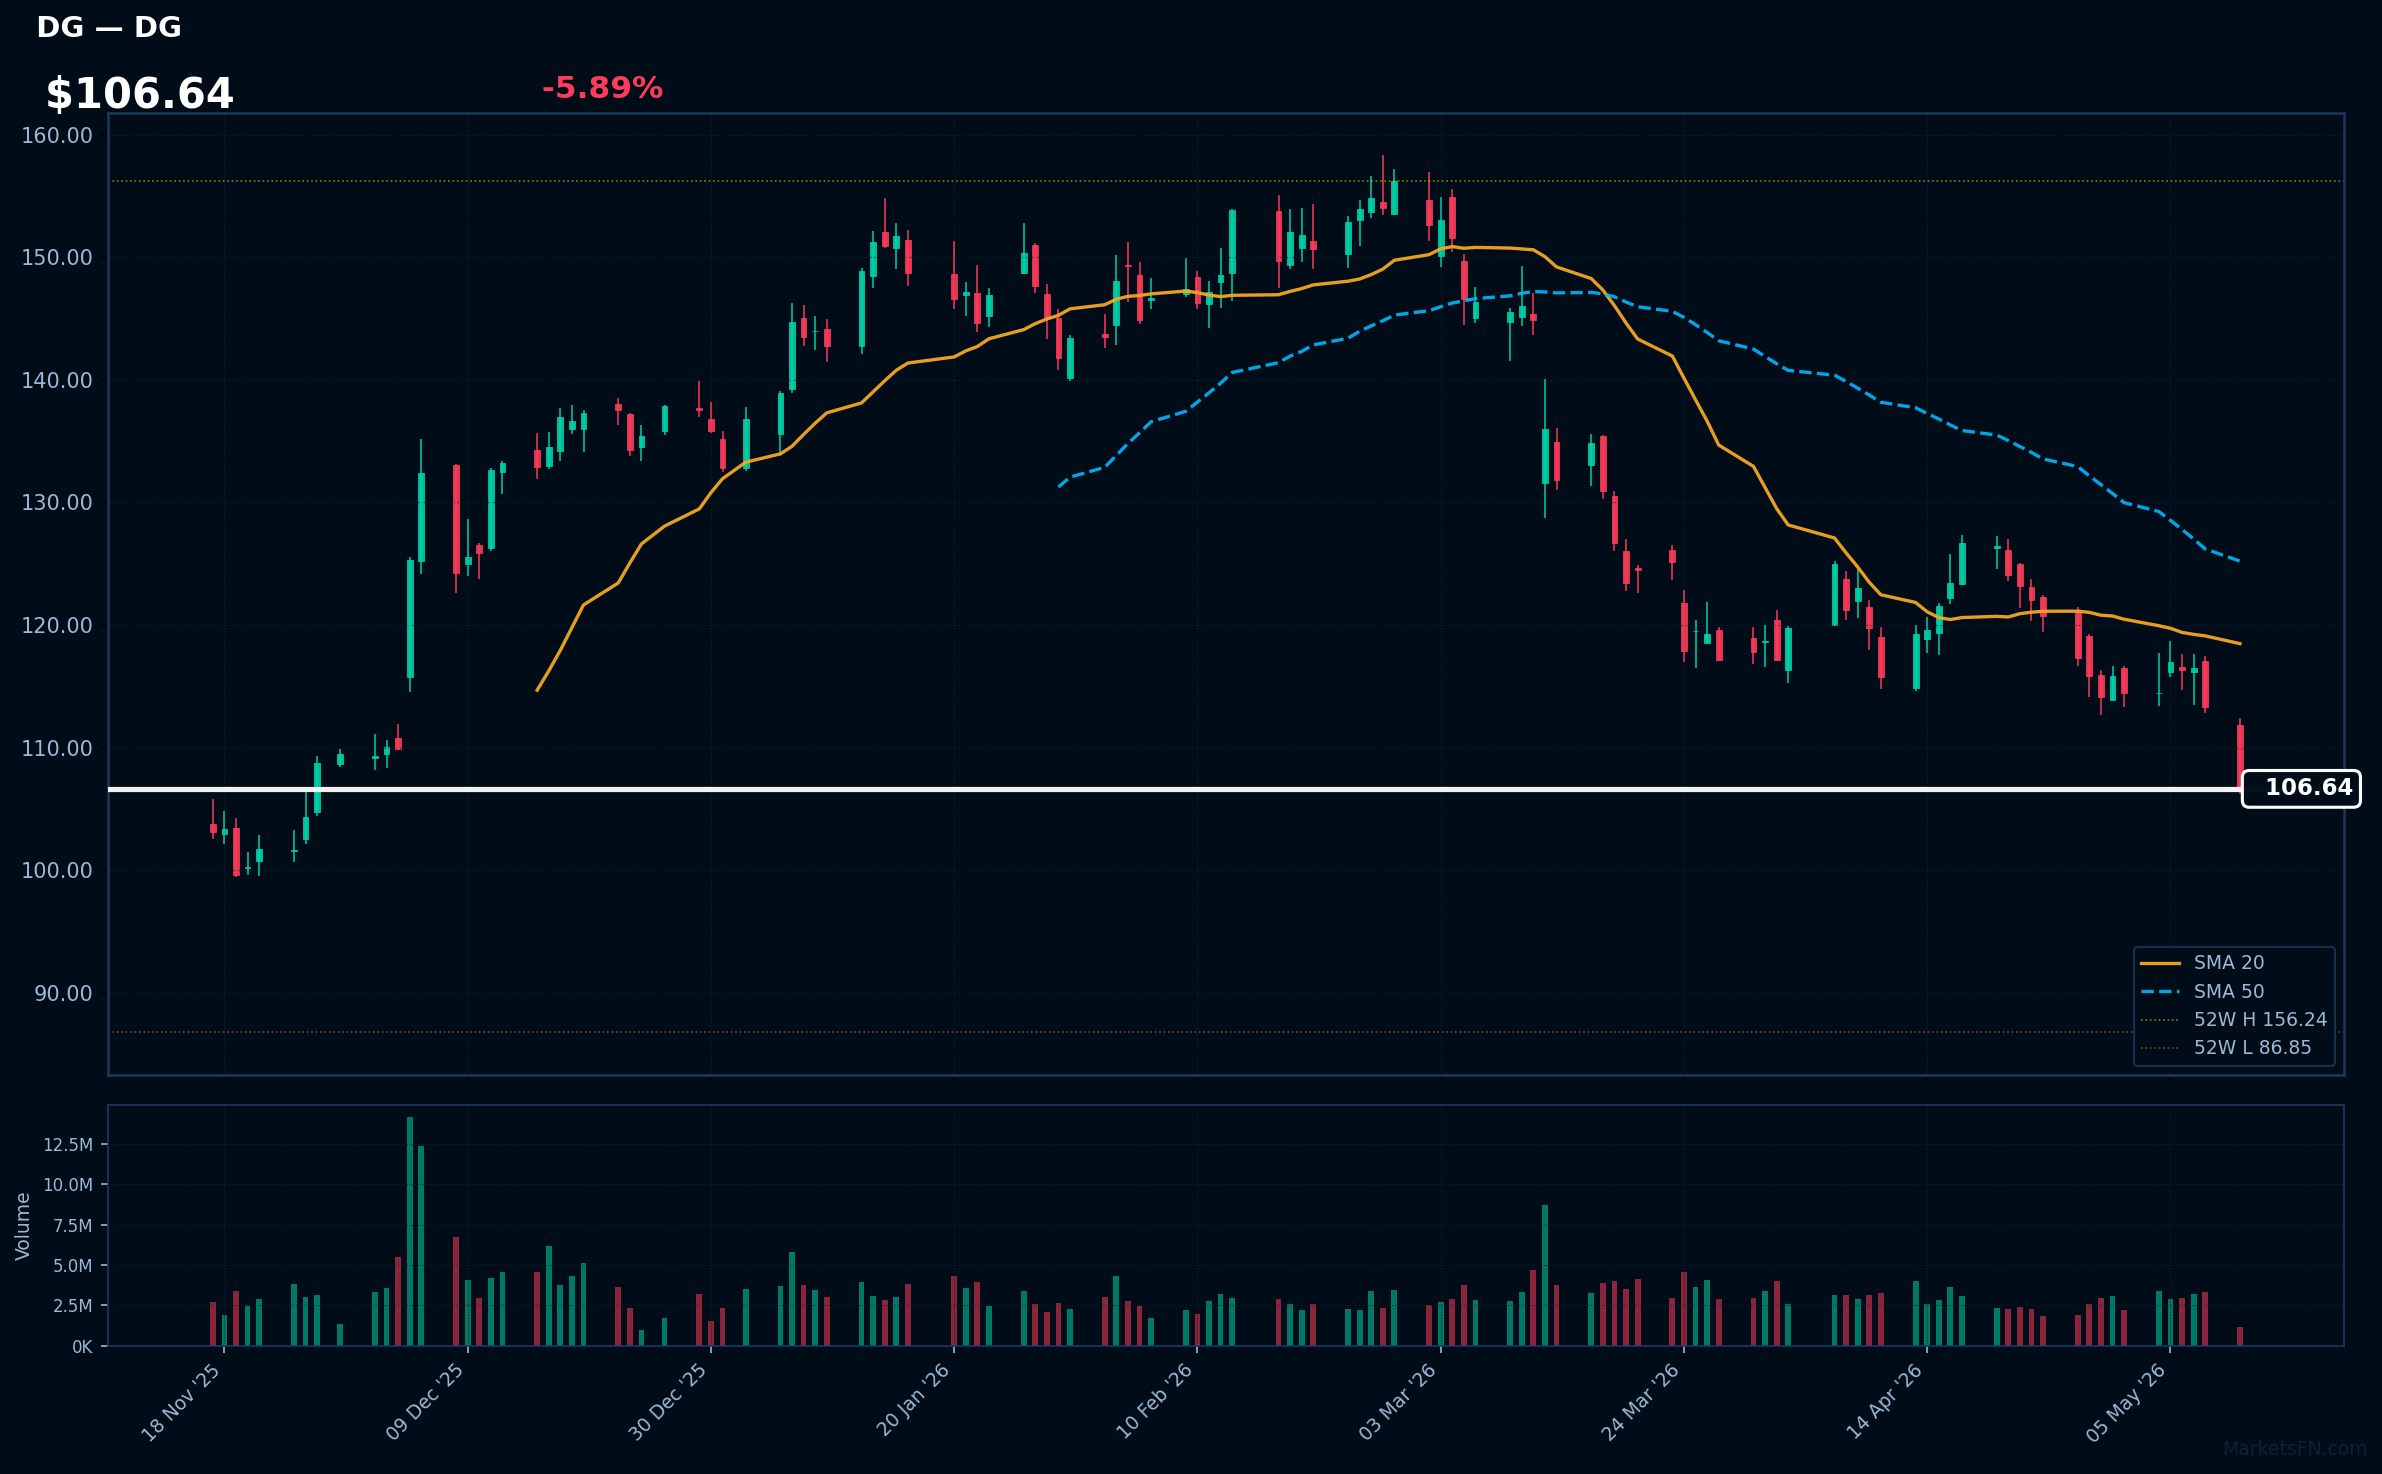
DG | Dollar General Corp | Consumer Defensive | Price: $106.62 | Day: -5.89% | 1W: -6.85% | 1M: -7.85% | RSI: 28.2 | vs MA200: -12.2% | Trend: Below MA20, MA50, MA200
Recent headlines (last 12h)
- S&P 500 set for muted open as Trump brands Iran offer 'totally unacceptable'
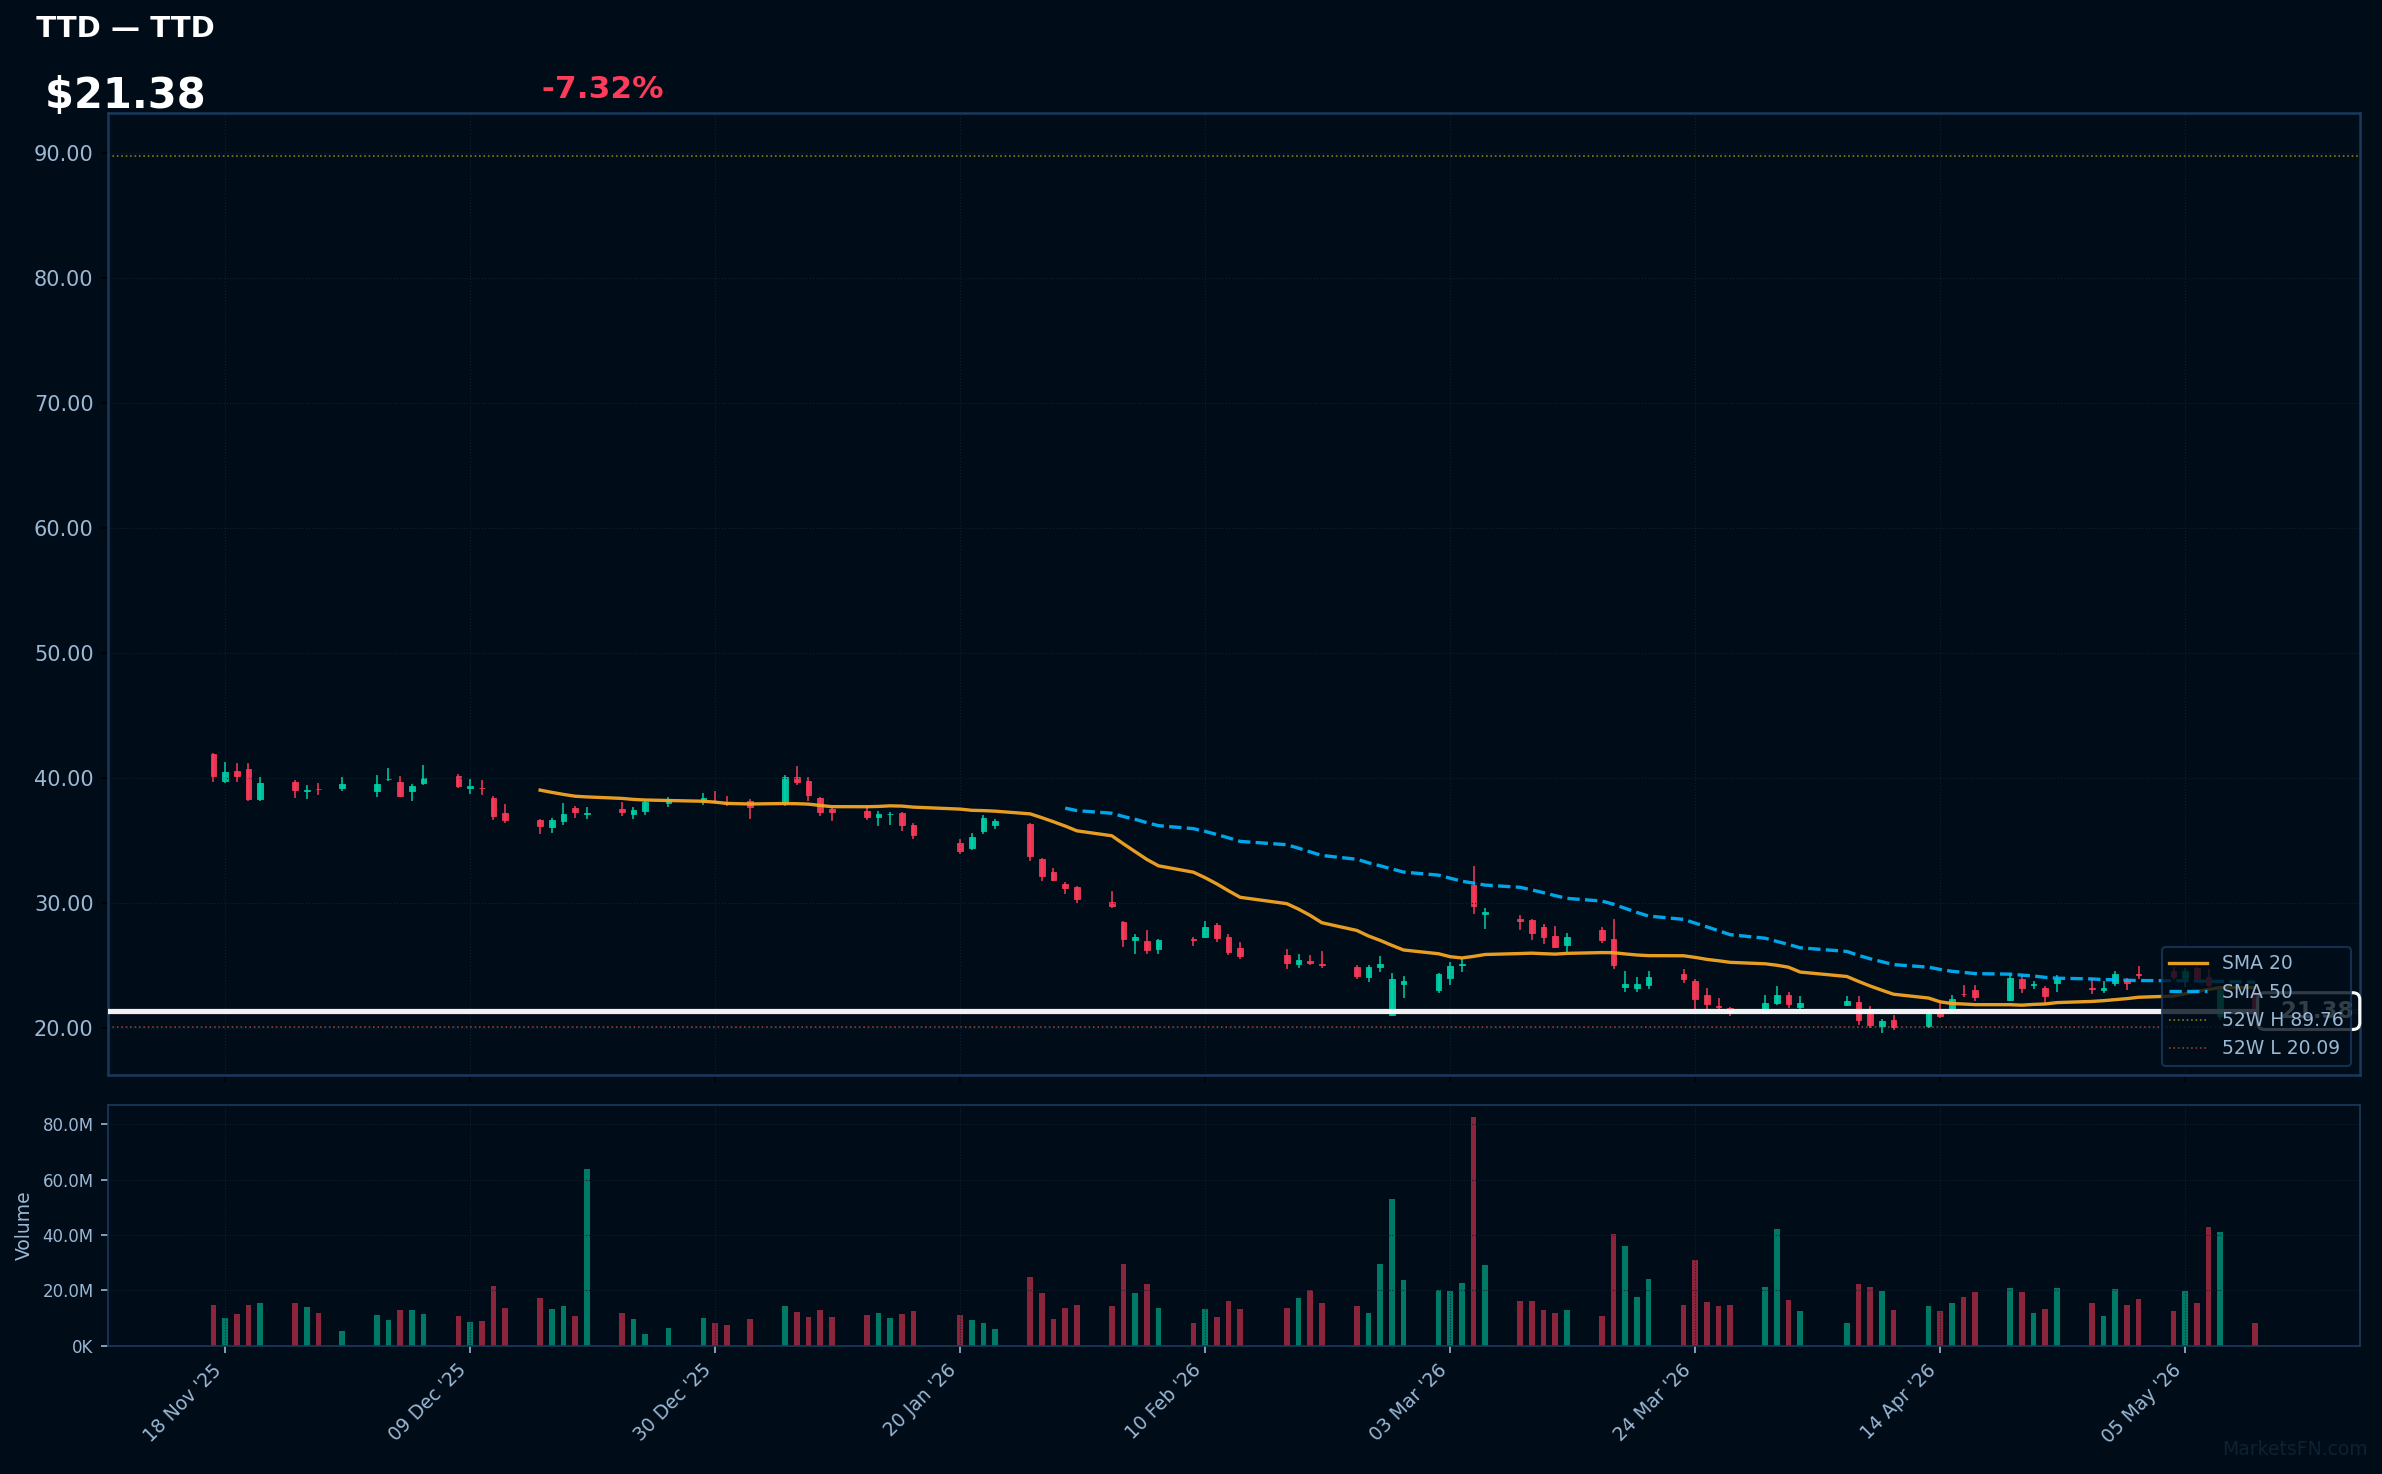
TTD | Trade Desk Inc | Communication Services | Price: $21.39 | Day: -7.32% | 1W: -11.31% | 1M: +6.40% | RSI: 39.8 | vs MA200: -46.3% | Trend: Below MA20, MA50, MA200
Recent headlines (last 12h)
- Dell downgraded, Uber upgraded: Wall Street's top analyst calls
Market Commentary
On May 11, 2026, the S&P 500 exhibited mixed performance, with 213 stocks advancing and 282 declining, yielding an average daily change of 0.28%. Top gainers included technology heavyweights like QCOM, WDC, and GLW, alongside healthcare's MRNA and basic materials' ALB and CF. Consumer defensive stocks such as PM and FSLR also rallied, signaling potential sector rotation towards defensive and growth-oriented areas amid economic uncertainty. Conversely, losers were led by basic materials' MOS, consumer defensive's EL and DG, and technology's DELL, with consumer cyclical names like CCL and RCL, as well as communication services' TTD, posting sharp declines.
This rotation underscores a shift from cyclical sectors to more resilient ones, as investors seek stability in technology and healthcare amid inflationary pressures. Notable RSI signals emerged, with gainers like MU showing overbought conditions above 70, suggesting potential pullbacks, while losers such as TYL and ISRG dipped below 30, indicating oversold opportunities. Sector dynamics highlight a cautious market, with basic materials and consumer cyclical stocks facing headwinds from global supply chain issues.
Key risk levels for the S&P 500 include support at 5,000 and resistance near 5,200, where a break could trigger broader volatility. Investors should monitor these thresholds closely, as ongoing sector rotation may amplify risks in an uneven economic recovery.
Methodology
Daily ranking uses the latest session close versus the prior close. RSI (14-day EWM), MA20, MA50, and MA200 are computed from 12 months of daily OHLCV data sourced from Yahoo Finance. Charts show the last 120 trading sessions with SMA 20/50, 52-week H/L markers, and volume. Recent news (last 12 h) is sourced from FinViz. Updated every trading day.
Disclaimer
The content on MarketsFN.com is provided for educational and informational purposes only. It does not constitute financial advice, investment recommendations, or trading guidance. All investments involve risks, and past performance does not guarantee future results. You are solely responsible for your investment decisions and should conduct independent research and consult a qualified financial advisor before acting. MarketsFN.com and its authors are not liable for any losses or damages arising from your use of this information.