S&P/NZX 50 Rises 1.66% Amid Mixed Asian Market Sentiment
· Market News · MarketsFN Team
S&P/NZX 50 Rises 1.66% Amid Mixed Asian Market Sentiment
Note: This analysis covers the Asian trading session close for May 19, 2026. All times are in US Eastern Time (ET).
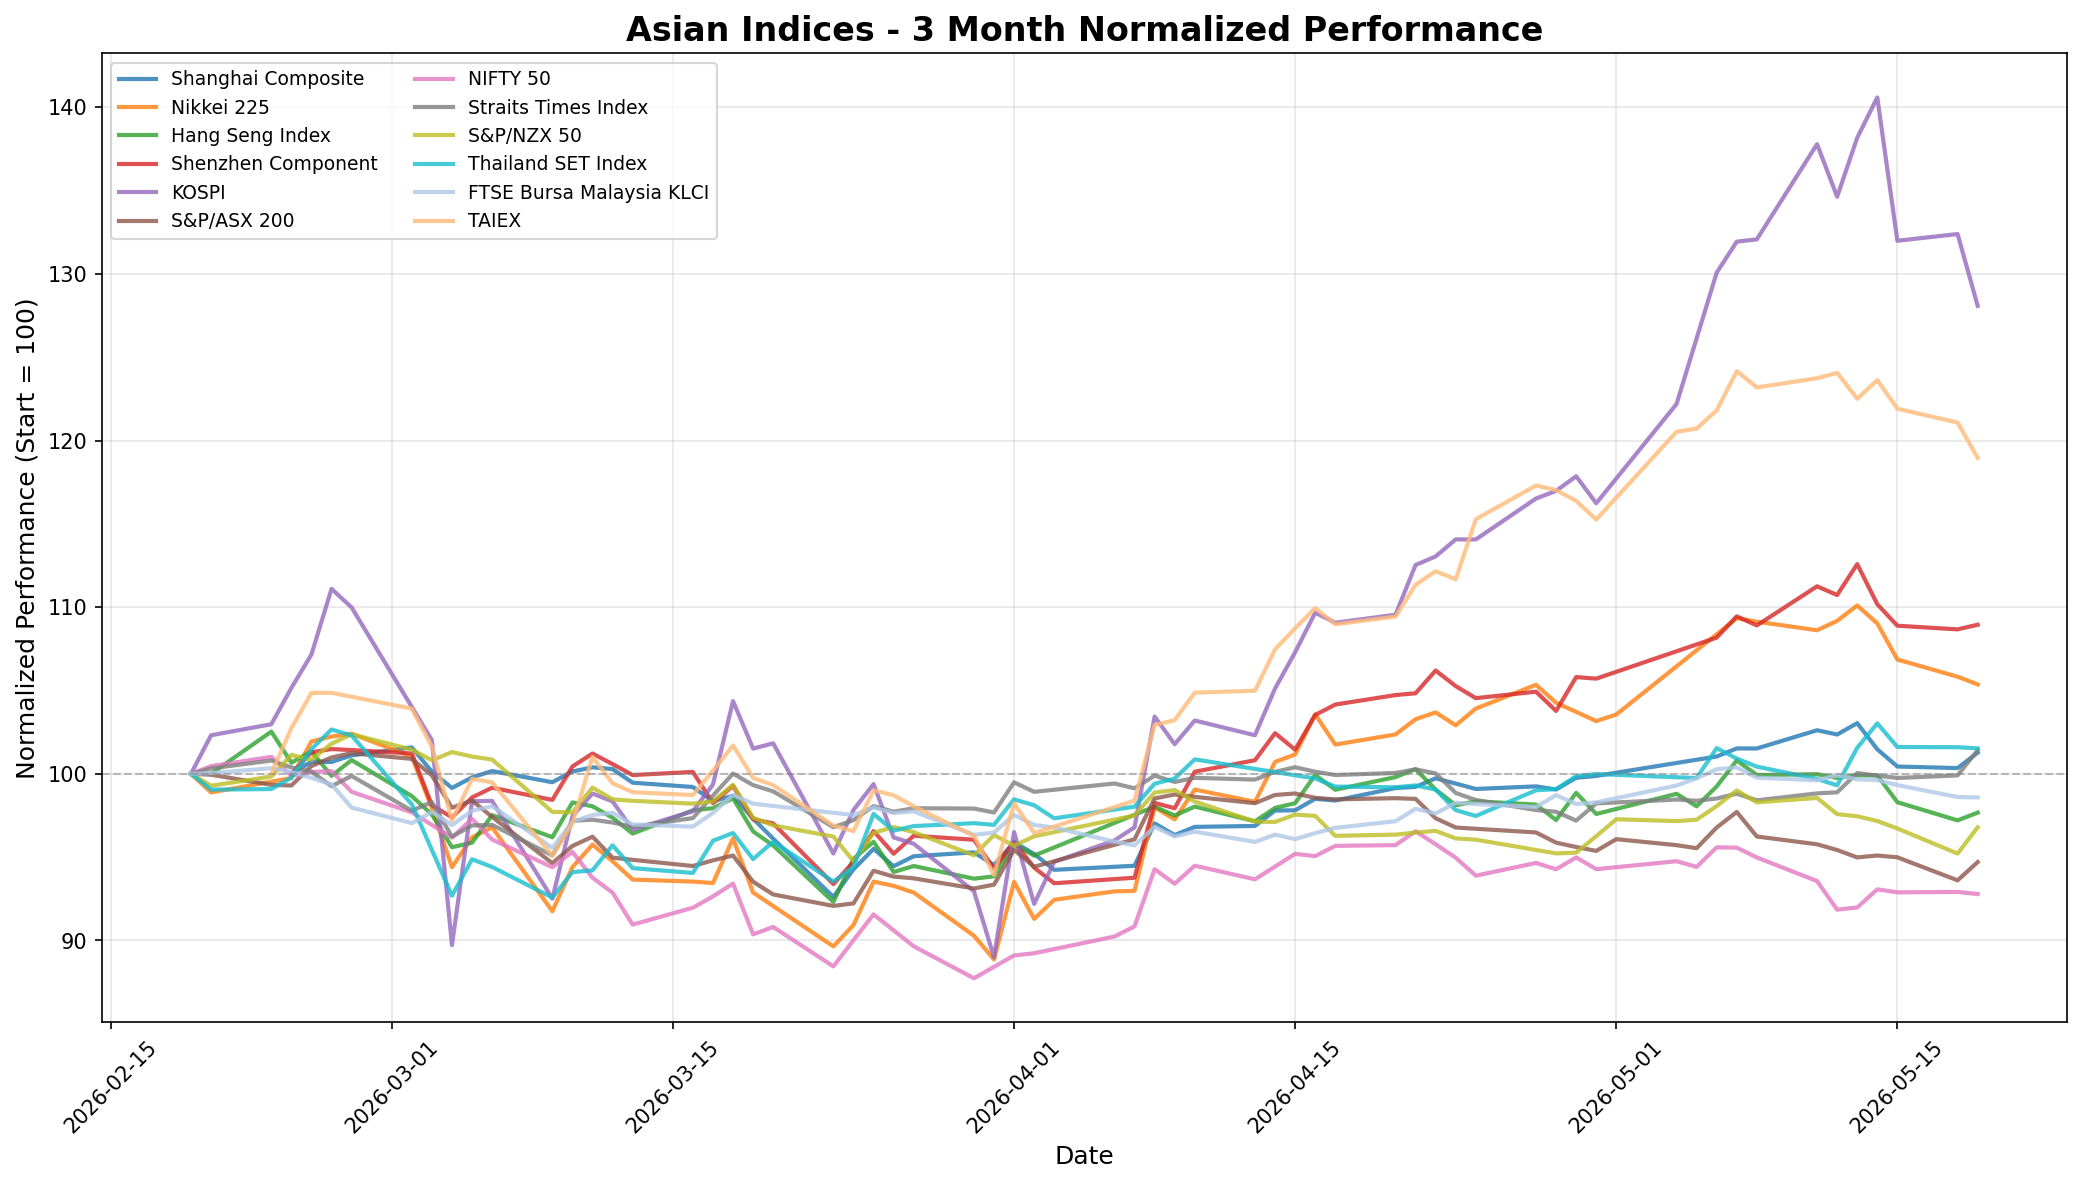
📊 Asian Indices Performance
| Index | Price | Daily Change (%) |
|---|---|---|
| Shanghai Composite | 4,169.54 | +0.92% |
| Nikkei 225 | 60,550.59 | -0.44% |
| Hang Seng Index | 25,797.85 | +0.48% |
| Shenzhen Component | 15,569.91 | +0.26% |
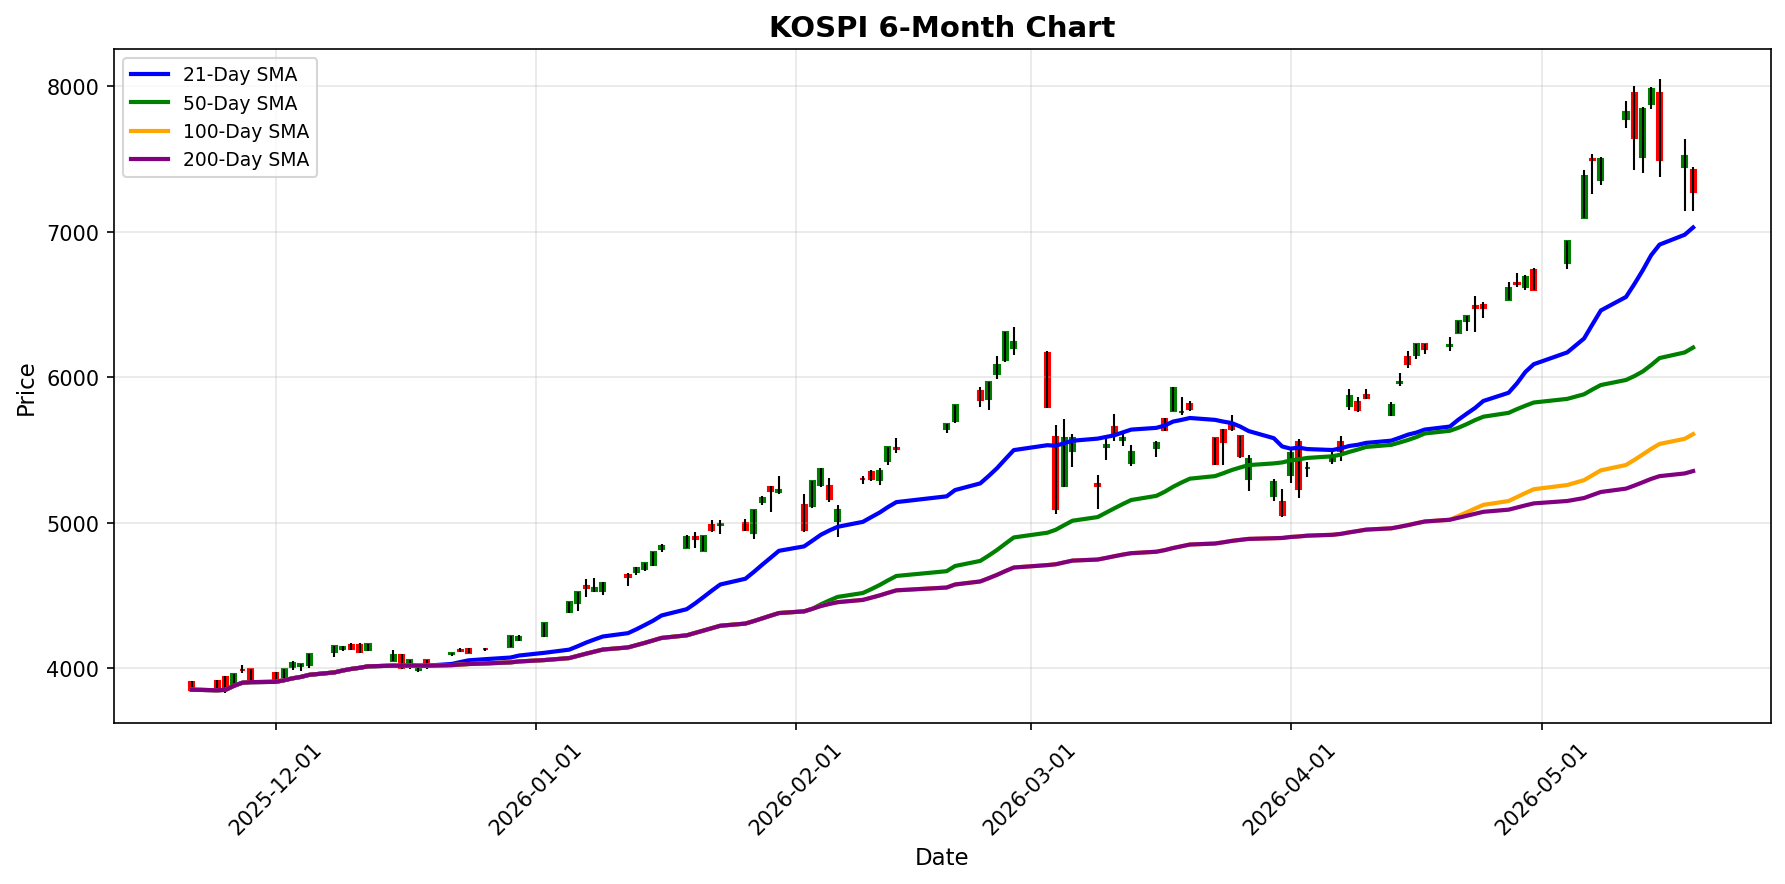
| KOSPI | 7,271.66 | -3.25% |
| S&P/ASX 200 | 8,604.70 | +1.17% |
| NIFTY 50 | 23,618.00 | -0.14% |
| Straits Times Index | 5,072.34 | +1.51% |
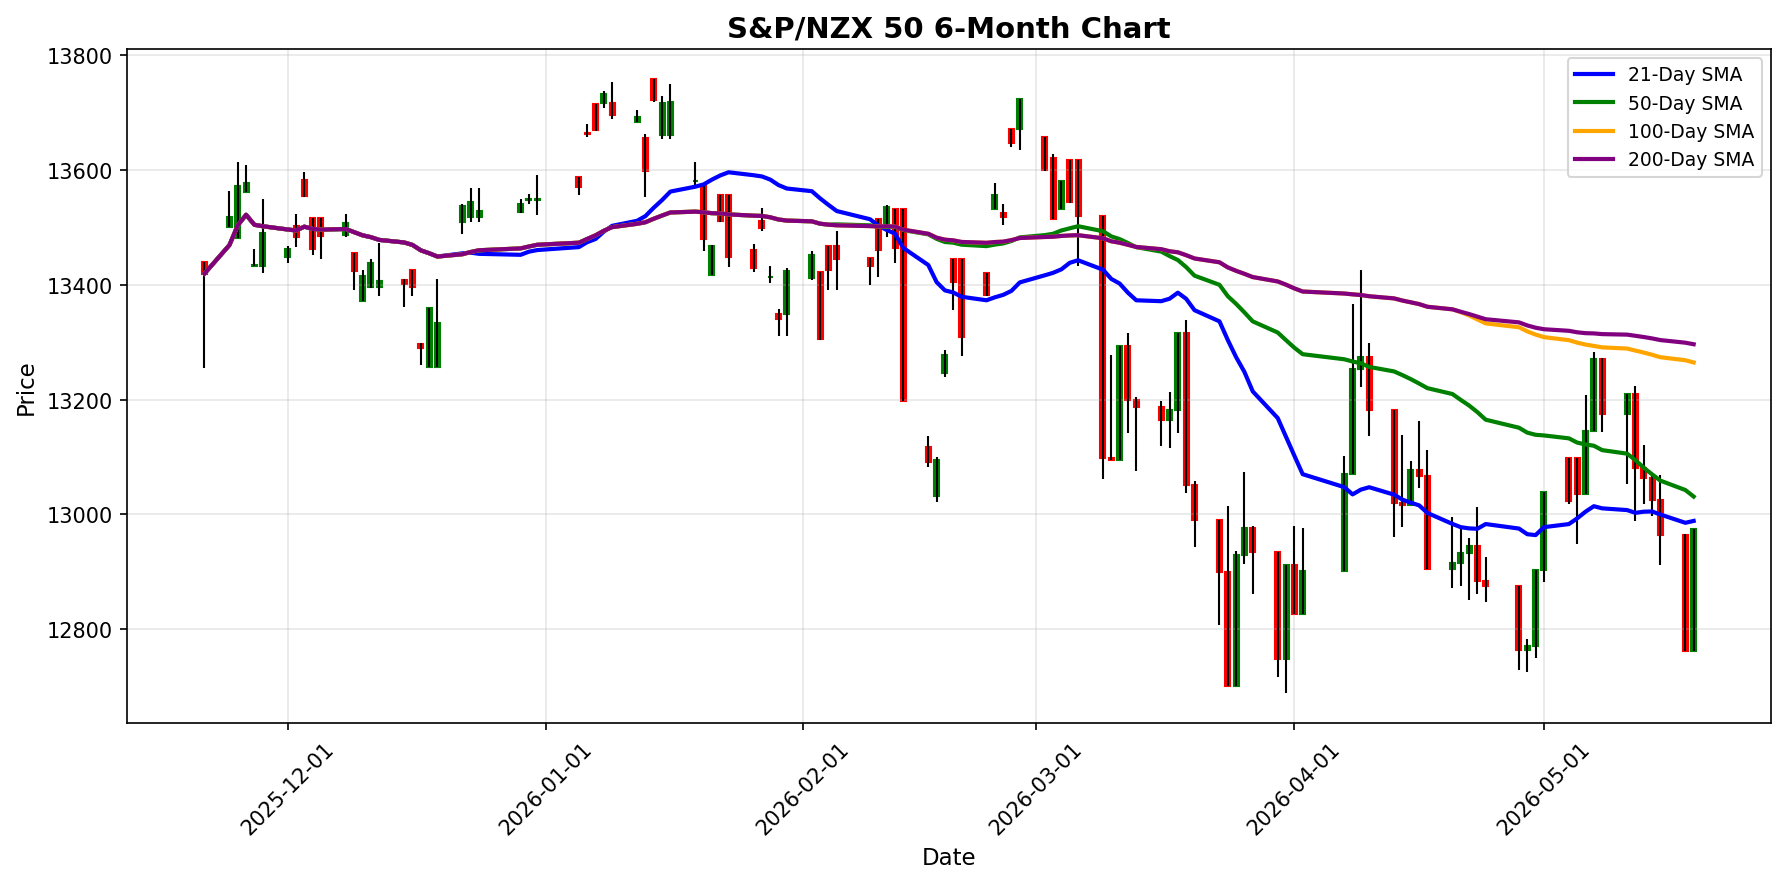
| S&P/NZX 50 | 12,974.32 | +1.66% |
| Thailand SET Index | 1,516.69 | -0.07% |
| FTSE Bursa Malaysia KLCI | 1,727.27 | -0.03% |
| TAIEX | 40,175.56 | -1.75% |
📰 Market Commentary
On May 19, 2026, Asian markets exhibited mixed performance influenced by various regional developments and global economic factors. **Key Events Impacting Asian Indices:** 1. **Japan's Economic Growth:** Japan's economy reported an annualized growth rate of 2.1% for the first quarter, surpassing analysts' expectations of 1.7%. This positive economic data provided some support to the Nikkei 225, although it ultimately closed down by 0.44% as heavy technology shares faced selling pressure. 2. **US-China Relations:** Despite recent pledges from the US and China to improve trade relations during a summit in Beijing, skepticism remains about the potential for substantial progress. This uncertainty continues to weigh on market sentiment, particularly affecting investor confidence in sectors reliant on trade. 3. **Russia-China Relations:** Ahead of President Putin's visit to China, he emphasized the unprecedented level of ties between Russia and China, which may influence geopolitical dynamics and trade partnerships in the region. 4. **Hong Kong's Housing Market Initiatives:** The Hong Kong government announced the lifting of resale restrictions for flat owners displaced by a recent fire, which is expected to stimulate the local housing market. This move contributed to a positive sentiment in the real estate sector. **Market Sentiment and Price Movements:** - **Mixed Performance:** The Shanghai Composite rose by 0.92%, reflecting optimism from domestic investors, while the KOSPI fell sharply by 3.25%, indicating bearish sentiment among foreign investors. The Hang Seng Index and the Straits Times Index posted gains of 0.48% and 1.51%, respectively, driven by local market dynamics. - **Technology Sector Weakness:** The Nikkei 225's decline was largely attributed to losses in technology stocks, which have been under pressure amid rising global bond yields and concerns over inflation. - **Indian Market Resilience:** The Indian stock market showed resilience, with domestic investors playing a crucial role in preventing a significant downturn amid bearish foreign investor sentiment. **Regional Economic Developments:** - **Hong Kong's Luxury Property Market:** There has been a notable recovery in Hong Kong's luxury property sector, with high-profile sales indicating renewed investor interest. This trend is supported by a broader economic recovery in the region. - **Cybersecurity Concerns in AI Adoption:** A survey highlighted that businesses in Singapore and Hong Kong are optimistic about the impact of artificial intelligence, yet they face increasing cybersecurity risks, particularly from supply chain vulnerabilities. - **Bond Market Dynamics:** The ongoing sell-off in US Treasurys has raised concerns among investors in Asia, as rising yields could lead to further volatility in equity markets. In summary, the Asian markets on May 19, 2026, reflected a complex interplay of local and global economic factors, with mixed indices performance driven by regional growth data, geopolitical tensions, and sector-specific developments.
📅 Economic Calendar - Asian Session
All times are in US Eastern Time (ET)
| Date | Time | Cur | Imp | Event | Actual | Forecast |
|---|---|---|---|---|---|---|
| 2026-05-19 | 00:30 | 🇯🇵 | Medium | Industrial Production (MoM) (Mar) | -0.4% | -0.5% |
| 2026-05-19 | 21:00 | 🇨🇳 | Medium | China Loan Prime Rate 5Y (May) | 3.50% | |
| 2026-05-19 | 21:15 | 🇨🇳 | Medium | PBoC Loan Prime Rate | 3.00% |
On May 19, 2026, several key economic events from Asia have implications for traders, particularly concerning the Japanese yen (JPY) and the Chinese yuan (CNY). **Japan: Industrial Production (MoM) - March** - **Actual:** -0.4% - **Forecast:** -0.5% The industrial production data from Japan showed a smaller-than-expected decline, with a rate of -0.4% compared to the forecasted -0.5%. This slight outperformance may indicate a marginally more resilient manufacturing sector than anticipated, potentially providing support for the JPY. Traders might interpret this as a positive signal for Japanese equities, particularly in manufacturing-heavy indices, which could see a mild uptick in response to the better-than-expected data. **China: Loan Prime Rate (5Y) - May** - **Actual:** Not yet released - **Forecast:** 3.50% **China: PBoC Loan Prime Rate** - **Actual:** Not yet released - **Forecast:** 3.00% Both the 5-year Loan Prime Rate and the PBoC Loan Prime Rate are critical indicators for the Chinese economy. While the actual figures are not yet available, the forecasts suggest a stable monetary policy stance. If the actual rates align with forecasts, it may indicate that the People's Bank of China is maintaining its accommodative policy to support economic growth. This could have mixed implications for the CNY, depending on market expectations regarding future economic conditions. Traders should monitor these releases closely, as any deviation from forecasts could lead to significant volatility in Chinese markets and impact broader Asian indices. **Market Implications:** - The better-than-expected industrial production data from Japan could bolster confidence in the Japanese stock market, potentially leading to gains in indices such as the Nikkei 225. - Conversely, the upcoming Loan Prime Rate announcements from China could create uncertainty. If actual rates differ from expectations, it could lead to fluctuations in the
📈 Index Performance Charts
Best Performer: S&P/NZX 50
Worst Performer: KOSPI
💱 FX, Commodities & Crypto
### FX Market Overview **Key Price Movements:** - **USD/JPY**: The pair is trading at 159.1530, reflecting a daily increase of 0.26%. - **USD/CNY**: Slightly up by 0.09%, currently priced at 6.8059. - **AUD/USD**: Notably down by 0.92%, now at 0.7106. - **NZD/USD**: Also decreased by 0.78%, trading at 0.5830. **Market Drivers:** The performance of the USD against other currencies is influenced by ongoing economic data releases and monetary policy expectations. The strength of the USD is supported by robust economic indicators, while the declines in AUD and NZD can be attributed to weaker commodity prices and concerns about economic growth in their respective regions. ### Commodities Overview **Key Price Movements:** - **Gold**: Priced at $4,528.10, down 0.54%. - **Silver**: Trading at $76.04, with a decline of 1.34%. - **Crude Oil (WTI)**: Significant drop of 4.69%, currently at $103.56. **Market Drivers:** The commodities market is experiencing downward pressure primarily due to fears of reduced demand amid global economic uncertainties. The sharp decline in crude oil prices is particularly noteworthy, driven by concerns over potential oversupply and weakening demand forecasts. Precious metals like gold and silver are also facing headwinds as investors shift towards riskier assets amidst fluctuating market sentiments. ### Cryptocurrency Overview **Key Price Movements:** - **Bitcoin**: Currently at $76,636, down 0
Currency Pairs
| Pair | Price | Daily Change (%) |
|---|---|---|
| USD/JPY | 159.15 | +0.26% |
| USD/CNY | 6.81 | +0.09% |
| AUD/USD | 0.71 | -0.92% |
| NZD/USD | 0.58 | -0.78% |
Commodities
| Commodity | Price | Daily Change (%) |
|---|---|---|
| Gold | $4528.10 | -0.54% |
| Silver | $76.04 | -1.34% |
| Crude Oil (WTI) | $103.56 | -4.69% |
Cryptocurrencies
| Asset | Price | Daily Change (%) |
|---|---|---|
| Bitcoin | $76,636 | -0.41% |
| Ethereum | $2,109 | -0.93% |
Disclaimer
The content on MarketsFN.com is provided for educational and informational purposes only. It does not constitute financial advice, investment recommendations, or trading guidance. All investments involve risks, and past performance does not guarantee future results. You are solely responsible for your investment decisions and should conduct independent research and consult a qualified financial advisor before acting. MarketsFN.com and its authors are not liable for any losses or damages arising from your use of this information.