Straits Times Index Surges 1.43% Amid Mixed Asian Market Sentiment
MarketsFN Team
Straits Times Index Surges 1.43% Amid Mixed Asian Market Sentiment
Note: This analysis covers the Asian trading session close for July 07, 2026. All times are in US Eastern Time (ET).
📊 Asian Indices Performance
| Index | Price | Daily Change (%) |
|---|---|---|
| Shanghai Composite | 3,990.24 | -1.26% |
| Nikkei 225 | 68,256.96 | -2.12% |
| Hang Seng Index | 23,496.89 | -0.51% |
| Shenzhen Component | 15,225.11 | -1.24% |
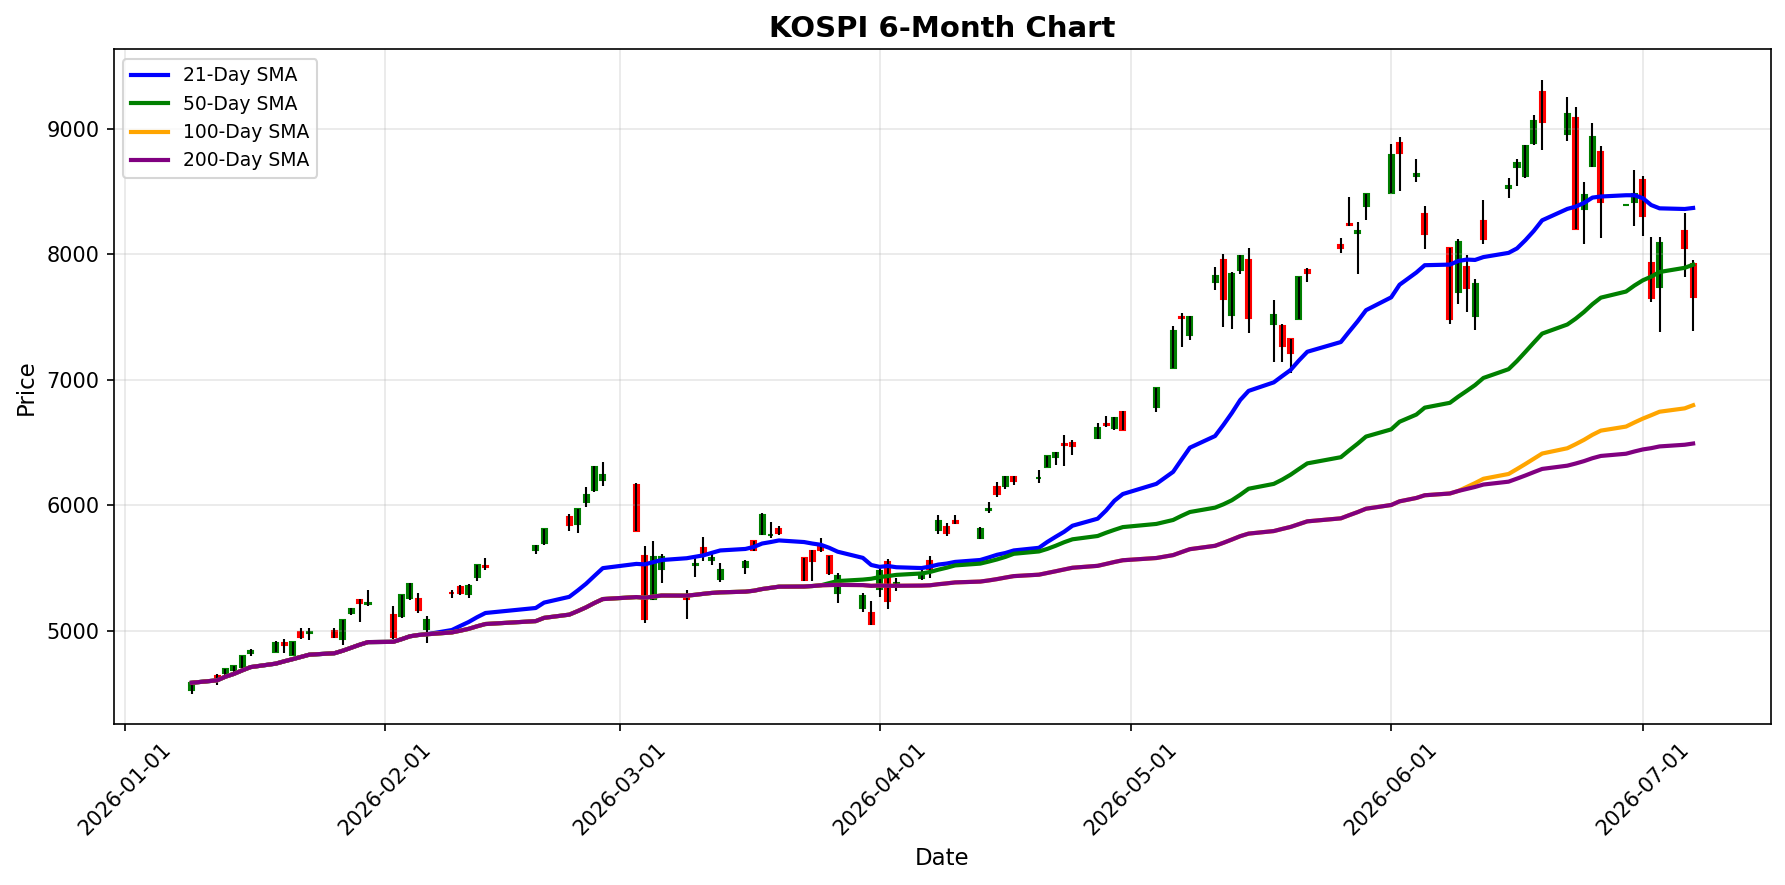
| KOSPI | 7,656.31 | -4.91% |
| S&P/ASX 200 | 8,803.90 | -0.31% |
| NIFTY 50 | 24,440.90 | +0.04% |
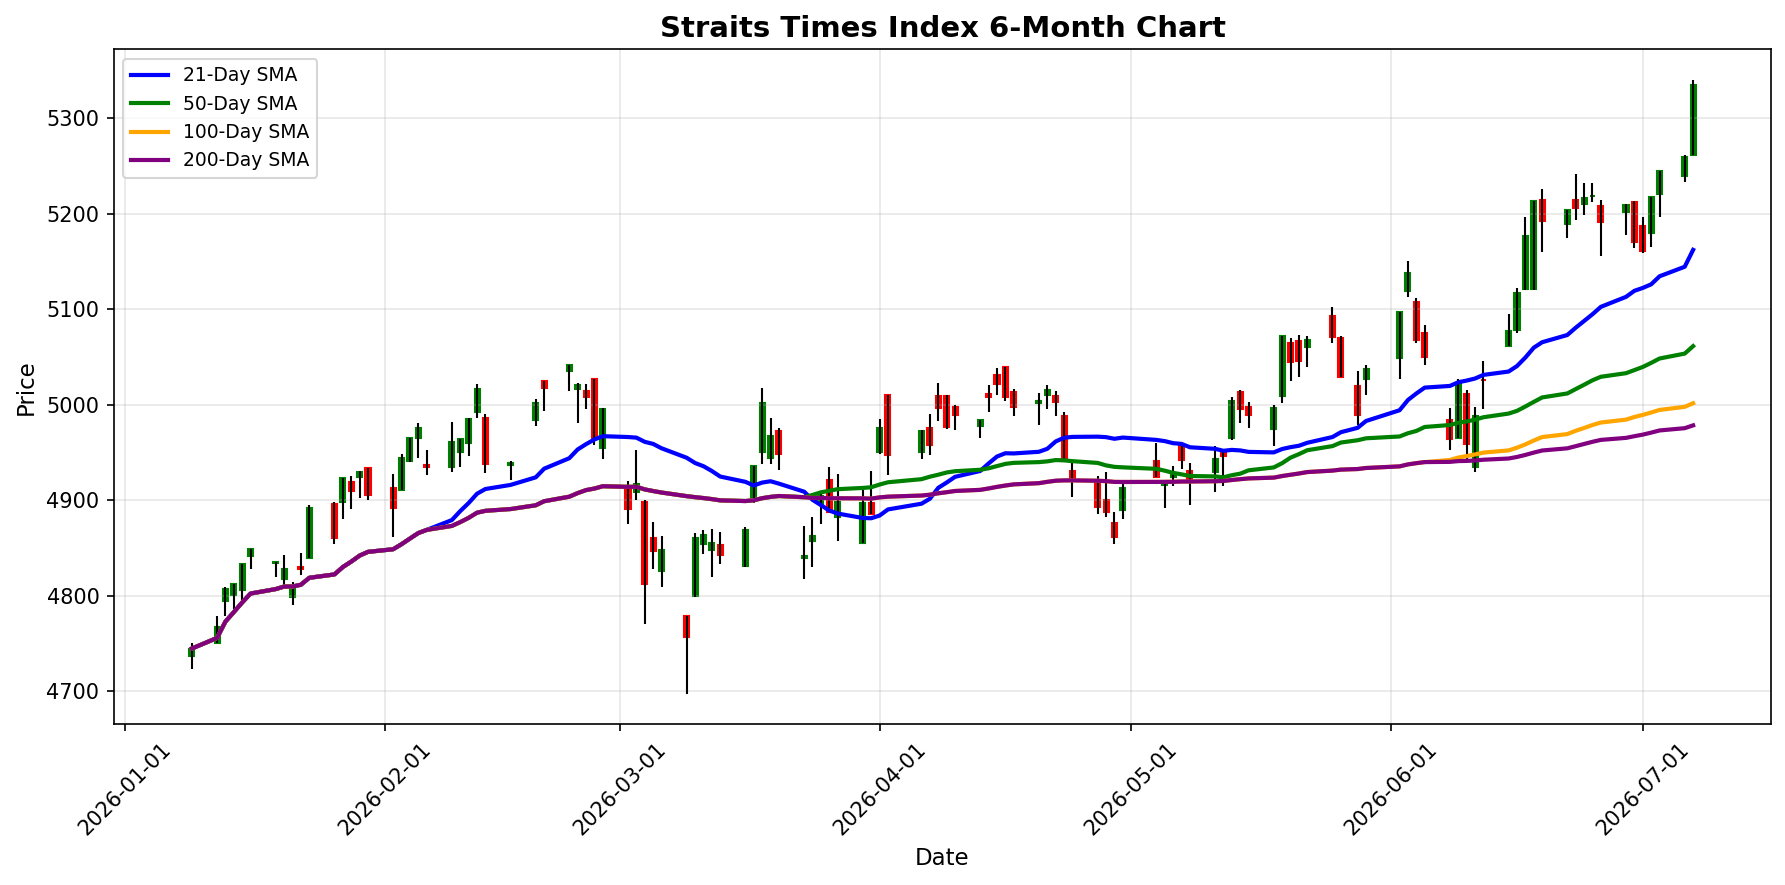
| Straits Times Index | 5,335.00 | +1.43% |
| S&P/NZX 50 | 13,762.79 | -0.00% |
| FTSE Bursa Malaysia KLCI | 1,682.93 | -0.04% |
| TAIEX | 45,479.11 | -2.31% |
📰 Market Commentary
As of July 07, 2026, the Asian markets are experiencing notable volatility, influenced by a combination of regional economic developments and sector-specific challenges. **Key Events Impacting Asian Indices:** - In Japan, the economic and fiscal policy minister has publicly denied claims that the government is exerting pressure on the Bank of Japan (BOJ) to raise interest rates. This statement comes amid ongoing concerns about the central bank's monetary policy direction, which has implications for market stability and investor confidence. - The Tokyo stock market closed lower, primarily driven by significant sell-offs in semiconductor stocks, despite positive earnings reports from South Korean tech giant Samsung. The Nikkei 225 index fell by 2.12%, reflecting broader market anxieties. - In China, the Shanghai Composite index declined by 1.26%, reflecting ongoing concerns about economic slowdown and regulatory actions impacting various sectors, including the recent crackdown on fraud in the jade market, which has led to falling prices in Myanmar. **Market Sentiment and Price Movements:** - The overall sentiment across Asian indices appears to be negative, with several markets recording declines. The KOSPI in South Korea was particularly hard hit, dropping by 4.91%, attributed to the turbulence in the semiconductor sector and broader economic concerns. - In contrast, the Straits Times Index in Singapore showed resilience, gaining 1.43%, indicating a divergence in market performance within the region. Other indices, such as the Hang Seng Index and the TAIEX, also reported losses of 0.51% and 2.31%, respectively, reflecting a cautious investor outlook amid economic uncertainties. **Regional Economic Developments:** - India is positioning itself for significant investment opportunities, with Japanese Prime Minister Sanae Takaichi leading a delegation to strengthen ties with India. This initiative is part of a broader strategy to enhance manufacturing capabilities without having to choose between partnerships with Japan and China. - Hong Kong is making strides in its financial sector by expanding its yuan facilities by 150% to meet international demand. This move is aimed at bolstering Hong Kong's position as a key player in yuan trading and enhancing its economic development strategy, which is increasingly focused on artificial intelligence. - The recent trial operation of a new gold clearing system in Hong Kong underscores the city's ambition to become a major bullion-trading hub, further diversifying its financial services. In summary, the Asian markets on July 07, 2026, are navigating a complex landscape characterized by sector-specific challenges, particularly in technology, alongside strategic economic initiatives aimed at fostering growth and stability in the region.
📅 Economic Calendar - Asian Session
All times are in US Eastern Time (ET)
| Date | Time | Cur | Imp | Event | Actual | Forecast |
|---|---|---|---|---|---|---|
| 2026-07-07 | 19:50 | 🇯🇵 | Medium | Adjusted Current Account (May) | 3.19T | |
| 2026-07-07 | 19:50 | 🇯🇵 | Medium | Current Account n.s.a. (May) | 4.121T |
On July 07, 2026, significant economic data releases from Japan could have notable implications for traders and Asian indices. 1. **Adjusted Current Account (May)** - **Forecast**: 3.19 trillion JPY - **Actual**: [Data not provided] - **Market Implications**: If the actual figure deviates significantly from the forecast, it could influence the Japanese yen's strength and impact broader market sentiment in Asia. A stronger-than-expected current account surplus may bolster confidence in Japan's economic stability, potentially leading to upward movement in Japanese equities. 2. **Current Account n.s.a. (May)** - **Forecast**: 4.121 trillion JPY - **Actual**: [Data not provided] - **Market Implications**: Similar to the adjusted current account, the actual outcome relative to the forecast will be crucial. A higher current account surplus could signal robust export performance, which may positively affect the Nikkei 225 and other regional indices. Conversely, a lower figure could raise concerns about Japan's trade balance, potentially exerting downward pressure on the yen and Japanese stocks. Traders should closely monitor the actual results against these forecasts, as they will likely influence market dynamics and sentiment across Asian financial markets.
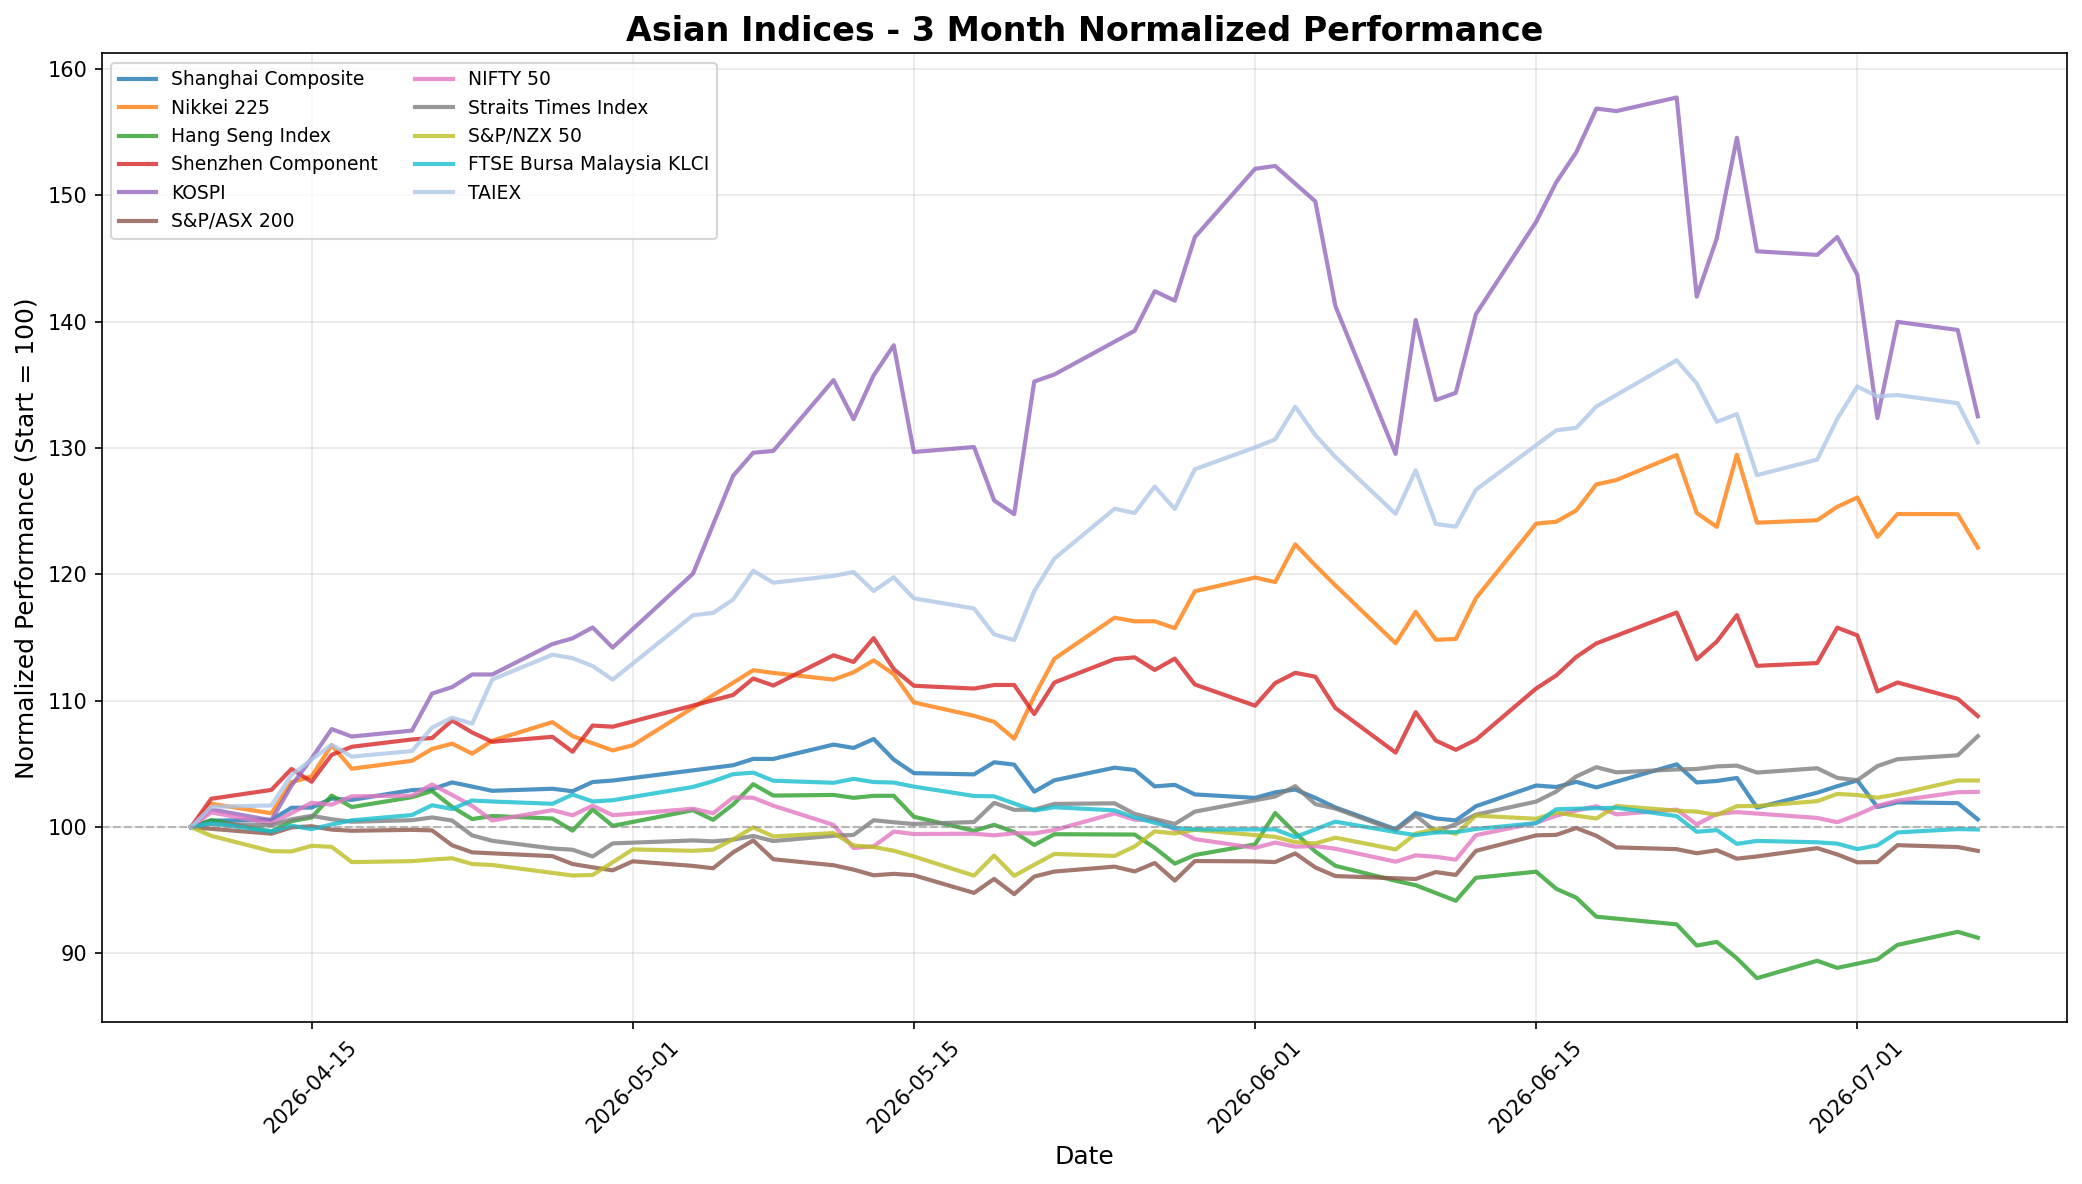
📈 Index Performance Charts
Best Performer: Straits Times Index
Worst Performer: KOSPI
💱 FX, Commodities & Crypto
### FX Pairs Performance 1. **USD/JPY**: The pair trades at 161.8670, reflecting a slight decline of -0.12%. This movement may be influenced by ongoing monetary policy discussions in Japan and the U.S., as investors assess interest rate differentials. 2. **USD/CNY**: Currently at 6.7944, this pair has seen a modest increase of 0.13%. The Chinese yuan's performance is likely driven by recent economic data releases and market sentiment regarding China's economic recovery. 3. **AUD/USD**: The Australian dollar is trading at 0.6945, down by -0.17%. This decline may be attributed to weaker commodity prices and shifts in risk sentiment affecting the Australian economy. 4. **NZD/USD**: The New Zealand dollar is at 0.5692, showing a decrease of -0.18%. Similar to the AUD, the NZD's performance is influenced by commodity price fluctuations and global economic conditions. ### Commodities Performance 1. **Gold**: Priced at $4,137.80, gold has experienced a decline of -0.42%. The drop can be linked to rising interest rates and a stronger U.S. dollar, which typically dampens demand for non-yielding assets like gold. 2. **Silver**: Trading at $61.31, silver has fallen by -0.98%. The decline reflects broader trends in precious metals and may also be impacted by industrial demand concerns. 3. **Crude Oil (WTI)**: Currently at $69.51, WTI crude oil has risen by 1.40%. This increase is likely driven by supply constraints and geopolitical tensions,
Currency Pairs
| Pair | Price | Daily Change (%) |
|---|---|---|
| USD/JPY | 161.87 | -0.12% |
| USD/CNY | 6.79 | +0.13% |
| AUD/USD | 0.69 | -0.17% |
| NZD/USD | 0.57 | -0.18% |
Commodities
| Commodity | Price | Daily Change (%) |
|---|---|---|
| Gold | $4137.80 | -0.42% |
| Silver | $61.31 | -0.98% |
| Crude Oil (WTI) | $69.51 | +1.40% |
Cryptocurrencies
| Asset | Price | Daily Change (%) |
|---|---|---|
| Bitcoin | $63,093 | -1.41% |
| Ethereum | $1,771 | -1.47% |
Disclaimer
The content on MarketsFN.com is provided for educational and informational purposes only. It does not constitute financial advice, investment recommendations, or trading guidance. All investments involve risks, and past performance does not guarantee future results. You are solely responsible for your investment decisions and should conduct independent research and consult a qualified financial advisor before acting. MarketsFN.com and its authors are not liable for any losses or damages arising from your use of this information.