Wheat: Down 0.1% to $581.25 — Testing 50.0% Fibonacci Support
· Commodities · QuoteReporter
Wheat: Down 0.1% to $581.25 — Testing 50.0% Fibonacci Support
Analysis Date: June 05, 2026
📊 Current Market Data
CURRENT PRICE
$581.25
DAILY CHANGE
-0.09%
WEEKLY CHANGE
-4.79%
52W HIGH
$679.50
52W LOW
$492.25
💡 Key Market Factors
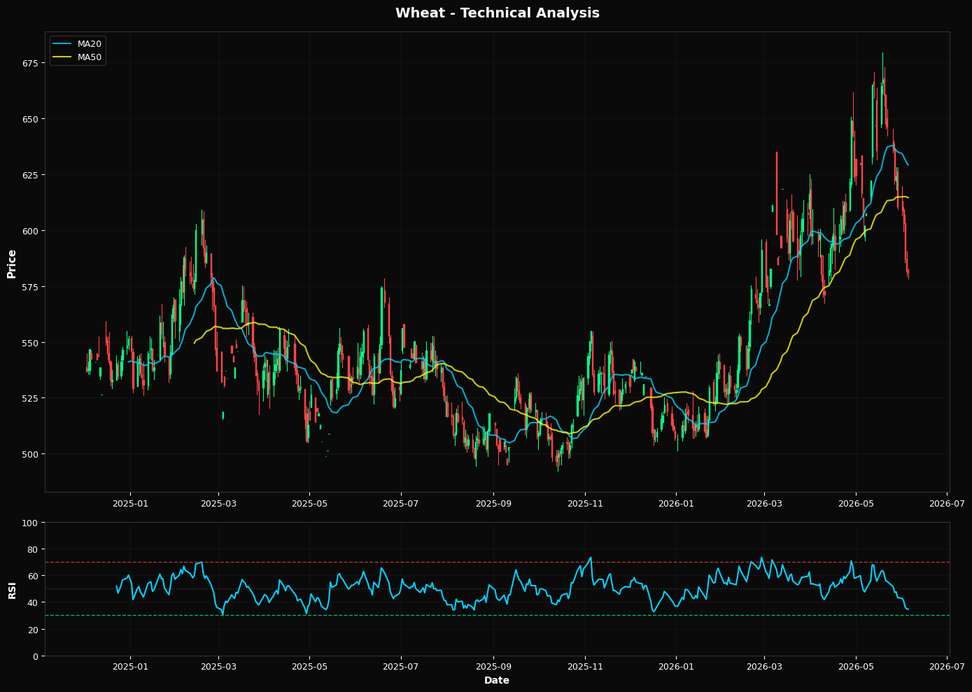
Wheat prices are teetering on a critical support level, with the market potentially underpricing the impact of a strengthening U.S. dollar. Currently priced at $581.25, wheat has declined by 4.79% over the past week, reflecting broader macroeconomic pressures. The U.S. dollar's appreciation, driven by expectations of continued Federal Reserve rate hikes, is exerting downward pressure on wheat prices. As wheat is globally traded in dollars, a stronger USD makes it more expensive for foreign buyers, potentially dampening demand. This currency dynamic is crucial right now, as it could exacerbate the existing price weakness if the dollar continues to gain strength. From a technical standpoint, wheat is showing bearish signals. The Relative Strength Index (RSI) at 34.7 suggests the commodity is approaching oversold territory, yet not quite there, indicating potential for further downside. The current price is below both the 20-day moving average ($629.15) and the 50-day moving average ($614.48), reinforcing a bearish trend. However, it remains above the 200-day moving average ($552.36), which could act as a long-term support. The nearest Fibonacci support at 50.0% is at $585.88, slightly above the current price, suggesting that a breach could lead to further declines. The technical setup implies a bearish bias, with potential for a short-term rebound if the price can hold above the 200-day moving average. A key risk that could alter this bearish outlook is a significant shift in global supply dynamics, such as unexpected geopolitical developments affecting major wheat-producing regions. For instance, any escalation in tensions in the Black Sea region, a critical wheat export hub, could disrupt supply chains and trigger a price rally. Conversely, a resolution or easing of such tensions could further pressure prices downward. The market may be underestimating these geopolitical risks, which could lead to sudden volatility. Looking ahead, the upcoming U.S. inflation data release will be pivotal. If inflation remains stubbornly high, it could reinforce the Fed's hawkish stance, further strengthening the dollar and pressuring wheat prices. Conversely, a softer inflation print might ease rate hike expectations, potentially weakening the dollar and providing some relief to wheat prices. This data point will be crucial in confirming or invalidating the current bearish outlook, as it directly influences the macroeconomic environment impacting wheat.📈 Technical Indicators Summary
RSI (14)
34.7
50-Day MA
$614.48
200-Day MA
$552.36
Fib Level
50.0%
📊 Technical Analysis Chart (18-Month View)
📐 Fibonacci Retracement Analysis
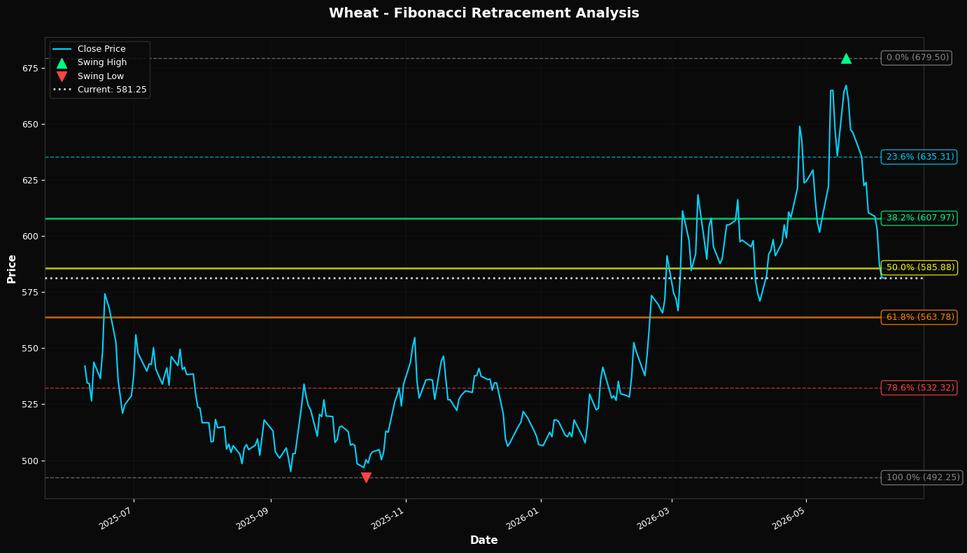
🎯 Key Trading Levels
Key Fibonacci Levels:
- 38.2%: $607.97
- 50.0%: $585.88
- 61.8%: $563.78
Support: $492.25 (Swing Low), $614.48 (50-Day MA)
Resistance: $679.50 (Swing High)
Disclaimer
The content on MarketsFN.com is provided for educational and informational purposes only. It does not constitute financial advice, investment recommendations, or trading guidance. All investments involve risks, and past performance does not guarantee future results. You are solely responsible for your investment decisions and should conduct independent research and consult a qualified financial advisor before acting. MarketsFN.com and its authors are not liable for any losses or damages arising from your use of this information.