Wheat: Down 1.1% to $605.75 — Testing 38.2% Fibonacci Support
· Commodities · QuoteReporter
Wheat: Down 1.1% to $605.75 — Testing 38.2% Fibonacci Support
Analysis Date: June 19, 2026
📊 Current Market Data
CURRENT PRICE
$605.75
DAILY CHANGE
-1.14%
WEEKLY CHANGE
+3.24%
52W HIGH
$679.50
52W LOW
$492.25
💡 Key Market Factors
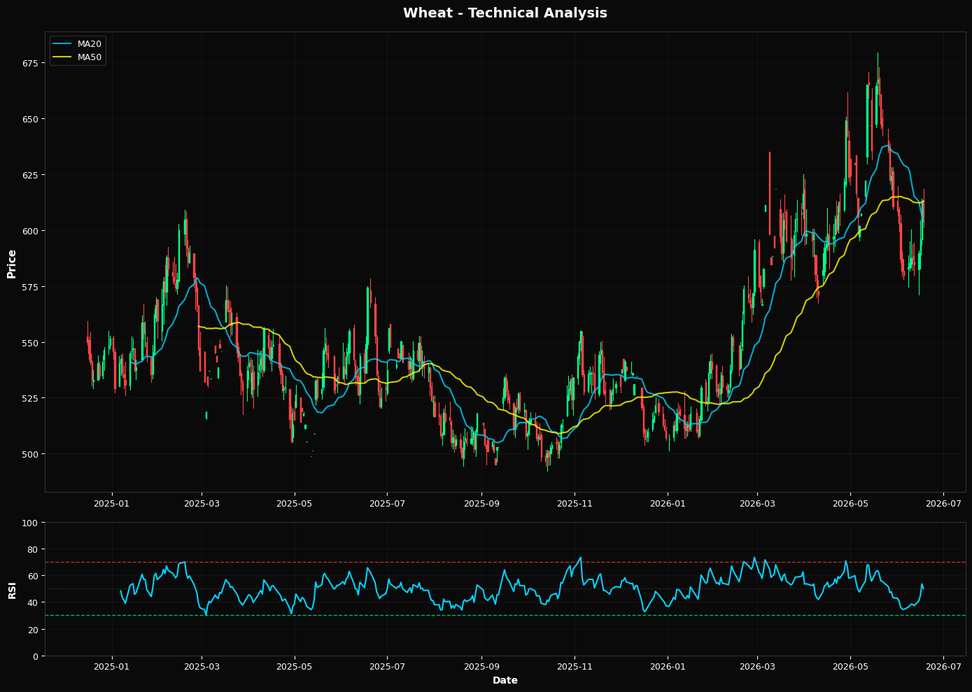
Wheat prices are poised for a potential breakout, with the market underpricing the impact of a weakening U.S. dollar. As the USD depreciates, it enhances the competitiveness of U.S. wheat on the global market, potentially driving demand higher. This currency dynamic is crucial, especially as the Federal Reserve signals a more dovish stance on interest rates, which could further pressure the dollar. Given wheat's current price at $605.75, a -1.14% daily decline contrasts with a +3.24% weekly gain, suggesting that the broader trend remains upward. The market may not fully appreciate how a sustained weaker dollar could amplify this trend, providing a tailwind for wheat prices. From a technical perspective, wheat is at a critical juncture. The Relative Strength Index (RSI) at 49.9 indicates a neutral momentum, but the price's proximity to the 38.2% Fibonacci support level at $607.97 suggests a potential bounce. The current price is slightly above the 20-day moving average of $603.92 but below the 50-day moving average of $613.03, indicating a short-term bullish bias within a broader consolidation phase. The significant gap between the 50-day and 200-day moving averages, with the latter at $556.12, underscores a longer-term bullish trend. If wheat can sustain above the Fibonacci level, it could signal a resumption of the upward trajectory towards the 52-week high of $679.50. A key risk to this bullish outlook is the potential for unexpected geopolitical developments, particularly in major wheat-producing regions like Ukraine or Russia. Any escalation in tensions or disruptions in these areas could lead to supply shocks, rapidly altering the supply-demand balance and driving prices higher. Conversely, a resolution or easing of tensions could alleviate supply concerns, putting downward pressure on prices. The market may be underestimating the volatility that such geopolitical factors can introduce, making it a critical variable to watch. Looking ahead, the upcoming U.S. inflation data release will be pivotal. A lower-than-expected inflation figure could reinforce the Fed's dovish stance, further weakening the dollar and supporting wheat prices. Conversely, a surprise uptick in inflation could prompt a reassessment of rate expectations, potentially strengthening the dollar and weighing on wheat. This data point will be crucial in confirming or invalidating the current bullish bias, making it essential for market participants to monitor closely.📈 Technical Indicators Summary
RSI (14)
49.9
50-Day MA
$613.03
200-Day MA
$556.12
Fib Level
38.2%
📊 Technical Analysis Chart (18-Month View)
📐 Fibonacci Retracement Analysis
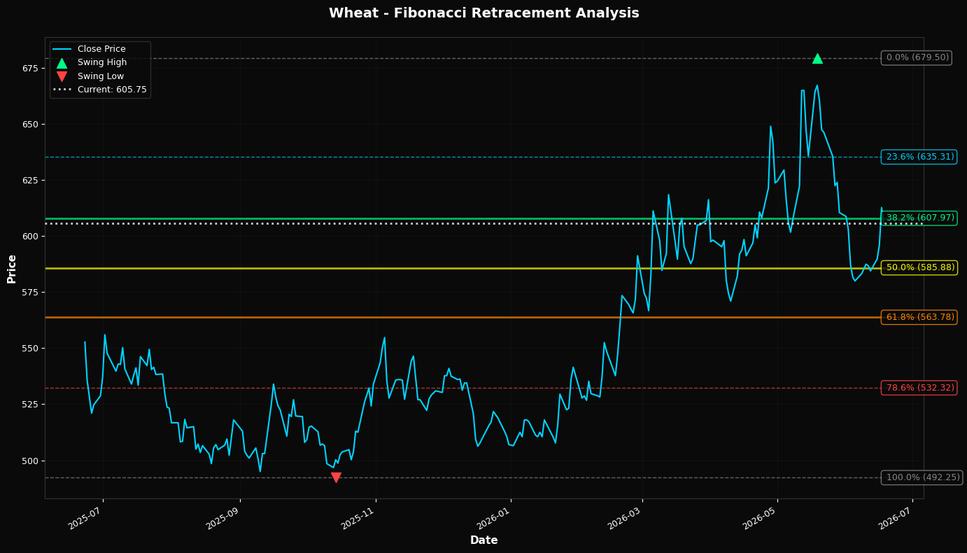
🎯 Key Trading Levels
Key Fibonacci Levels:
- 38.2%: $607.97
- 50.0%: $585.88
- 61.8%: $563.78
Support: $492.25 (Swing Low), $613.03 (50-Day MA)
Resistance: $679.50 (Swing High)
Disclaimer
The content on MarketsFN.com is provided for educational and informational purposes only. It does not constitute financial advice, investment recommendations, or trading guidance. All investments involve risks, and past performance does not guarantee future results. You are solely responsible for your investment decisions and should conduct independent research and consult a qualified financial advisor before acting. MarketsFN.com and its authors are not liable for any losses or damages arising from your use of this information.