Wheat: Up 0.3% to $582.00 — Testing 50.0% Fibonacci Support
· Commodities · QuoteReporter
Wheat: Up 0.3% to $582.00 — Testing 50.0% Fibonacci Support
Analysis Date: June 08, 2026
📊 Current Market Data
CURRENT PRICE
$582.00
DAILY CHANGE
+0.34%
WEEKLY CHANGE
-4.39%
52W HIGH
$679.50
52W LOW
$492.25
💡 Key Market Factors
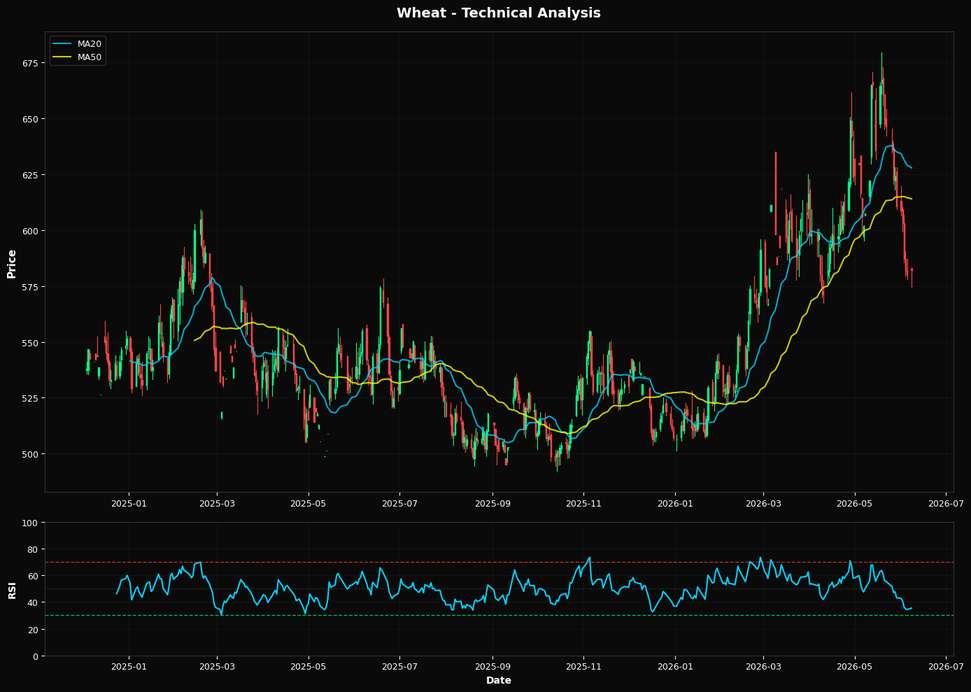
Wheat prices are teetering on a critical support level, with the market potentially underestimating the impact of a strengthening U.S. dollar. The current price of wheat at $582.00 is perilously close to the 50.0% Fibonacci support at $585.88. This suggests that any further appreciation in the USD could push prices below this key level, exacerbating the recent weekly decline of 4.39%. Given the Federal Reserve's hawkish stance, which is likely to keep interest rates elevated, the dollar's strength could persist, putting additional downward pressure on wheat prices. The market may not be fully pricing in the extent to which a robust dollar can suppress commodity prices, particularly those like wheat that are sensitive to currency fluctuations. From a technical perspective, wheat is showing signs of bearish momentum. The Relative Strength Index (RSI) at 35.4 indicates that the commodity is approaching oversold territory, yet it hasn't reached the critical threshold that typically signals a reversal. The price is also trading below both the 20-day moving average ($627.81) and the 50-day moving average ($613.99), reinforcing a bearish outlook. However, it remains above the 200-day moving average ($552.74), suggesting that while short-term sentiment is negative, the longer-term trend could still offer support. The proximity to the Fibonacci support level at $585.88 is crucial; a breach here could trigger further selling pressure. A key risk that could alter this bearish scenario is a sudden shift in global supply dynamics, such as adverse weather conditions in major wheat-producing regions. Should there be a significant disruption in supply, it could counteract the downward pressure from a strong dollar and lead to a price rebound. Conversely, if global supply remains stable or increases, the bearish trend could persist, especially if the USD continues to strengthen. The upcoming U.S. inflation data release will be pivotal in confirming or invalidating this view. A higher-than-expected inflation print could reinforce the Fed's hawkish stance, further boosting the dollar and pressuring wheat prices. Conversely, a softer inflation reading might ease rate hike expectations, potentially weakening the dollar and providing some relief to wheat prices. This data point will be critical in shaping the near-term trajectory for wheat, making it a must-watch for market participants.📈 Technical Indicators Summary
RSI (14)
35.4
50-Day MA
$613.99
200-Day MA
$552.74
Fib Level
50.0%
📊 Technical Analysis Chart (18-Month View)
📐 Fibonacci Retracement Analysis
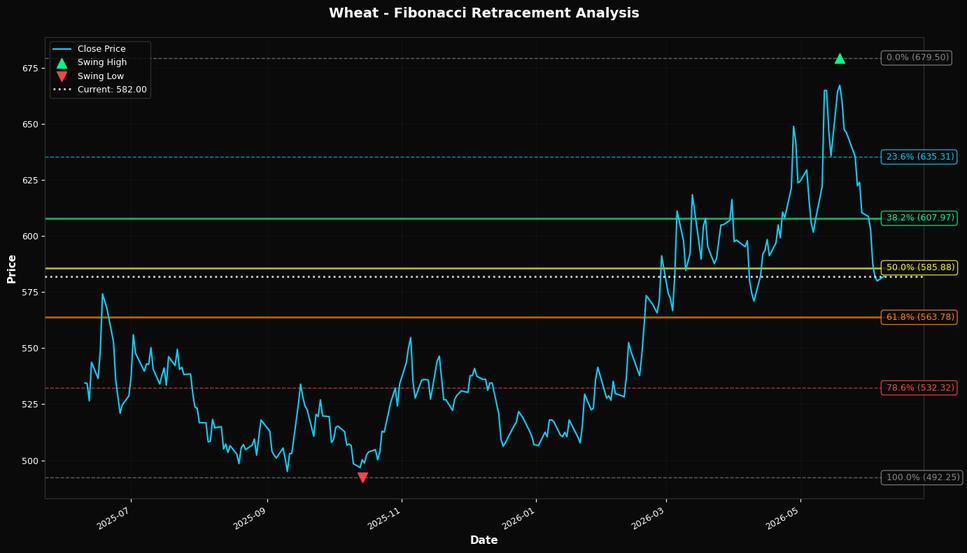
🎯 Key Trading Levels
Key Fibonacci Levels:
- 38.2%: $607.97
- 50.0%: $585.88
- 61.8%: $563.78
Support: $492.25 (Swing Low), $613.99 (50-Day MA)
Resistance: $679.50 (Swing High)
Disclaimer
The content on MarketsFN.com is provided for educational and informational purposes only. It does not constitute financial advice, investment recommendations, or trading guidance. All investments involve risks, and past performance does not guarantee future results. You are solely responsible for your investment decisions and should conduct independent research and consult a qualified financial advisor before acting. MarketsFN.com and its authors are not liable for any losses or damages arising from your use of this information.