Wheat: Up 0.4% to $585.50 — Testing 50.0% Fibonacci Support
· Commodities · QuoteReporter
Wheat: Up 0.4% to $585.50 — Testing 50.0% Fibonacci Support
Analysis Date: June 09, 2026
📊 Current Market Data
CURRENT PRICE
$585.50
DAILY CHANGE
+0.39%
WEEKLY CHANGE
-2.90%
52W HIGH
$679.50
52W LOW
$492.25
💡 Key Market Factors
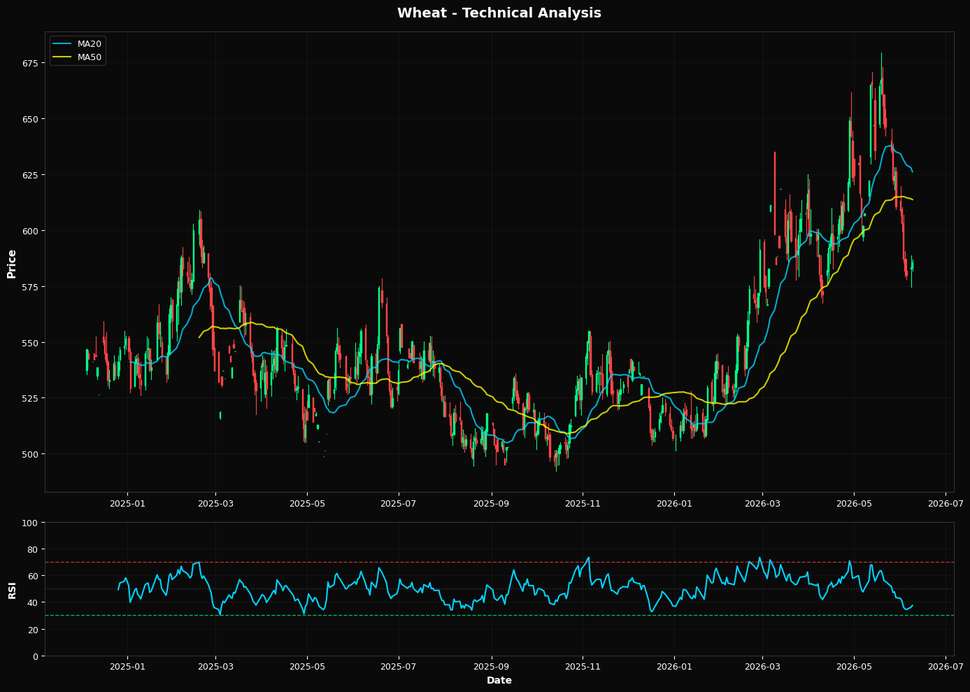
Wheat prices are poised at a critical juncture, with the U.S. dollar's strength emerging as the most significant macro driver impacting the commodity. As wheat is priced in dollars, a stronger USD typically exerts downward pressure on prices by making U.S. exports less competitive. Given the Federal Reserve's current stance on interest rates, which remains hawkish to combat inflation, the dollar has maintained its strength. This dynamic is crucial as it could further suppress wheat prices, especially when combined with the current weekly decline of 2.90%. The market may be underestimating the prolonged impact of a strong dollar on global demand for U.S. wheat, which could lead to sustained price weakness. From a technical perspective, wheat is showing signs of potential downside risk. The Relative Strength Index (RSI) at 37.3 suggests that the commodity is approaching oversold territory, but not quite there yet, indicating room for further declines. The current price of $585.50 is below both the 20-day moving average of $626.04 and the 50-day moving average of $613.62, reinforcing a bearish trend. However, it remains above the 200-day moving average of $553.13, which could act as a long-term support level. The nearest Fibonacci support at 50.0% is at $585.88, just above the current price, suggesting a critical support level that, if breached, could accelerate the downward momentum. A key risk that could alter this bearish outlook is the potential for geopolitical disruptions in major wheat-producing regions, such as Ukraine or Russia. Any escalation in tensions could lead to supply chain disruptions, driving prices higher. Conversely, a resolution or de-escalation could alleviate supply concerns and further pressure prices. The market may not be fully pricing in these geopolitical risks, which could lead to sudden volatility. Looking ahead, the upcoming U.S. inflation data release will be pivotal. Should inflationary pressures ease, it could lead to a softer stance from the Fed, potentially weakening the dollar and providing some relief to wheat prices. Conversely, stronger-than-expected inflation data could reinforce the Fed's hawkish stance, further strengthening the dollar and exacerbating the downward pressure on wheat. This data point will be crucial in confirming or invalidating the current bearish outlook for wheat.📈 Technical Indicators Summary
RSI (14)
37.3
50-Day MA
$613.62
200-Day MA
$553.13
Fib Level
50.0%
📊 Technical Analysis Chart (18-Month View)
📐 Fibonacci Retracement Analysis
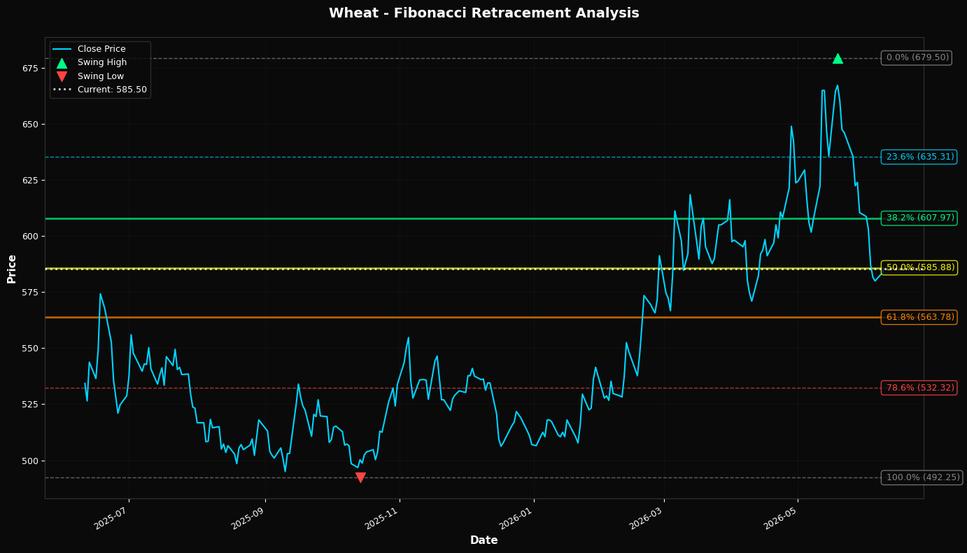
🎯 Key Trading Levels
Key Fibonacci Levels:
- 38.2%: $607.97
- 50.0%: $585.88
- 61.8%: $563.78
Support: $492.25 (Swing Low), $613.62 (50-Day MA)
Resistance: $679.50 (Swing High)
Disclaimer
The content on MarketsFN.com is provided for educational and informational purposes only. It does not constitute financial advice, investment recommendations, or trading guidance. All investments involve risks, and past performance does not guarantee future results. You are solely responsible for your investment decisions and should conduct independent research and consult a qualified financial advisor before acting. MarketsFN.com and its authors are not liable for any losses or damages arising from your use of this information.