Wheat: Up 0.4% to $608.00 — Testing 38.2% Fibonacci Support
· Commodities · QuoteReporter
Wheat: Up 0.4% to $608.00 — Testing 38.2% Fibonacci Support
Analysis Date: June 22, 2026
📊 Current Market Data
CURRENT PRICE
$608.00
DAILY CHANGE
+0.37%
WEEKLY CHANGE
+4.02%
52W HIGH
$679.50
52W LOW
$492.25
💡 Key Market Factors
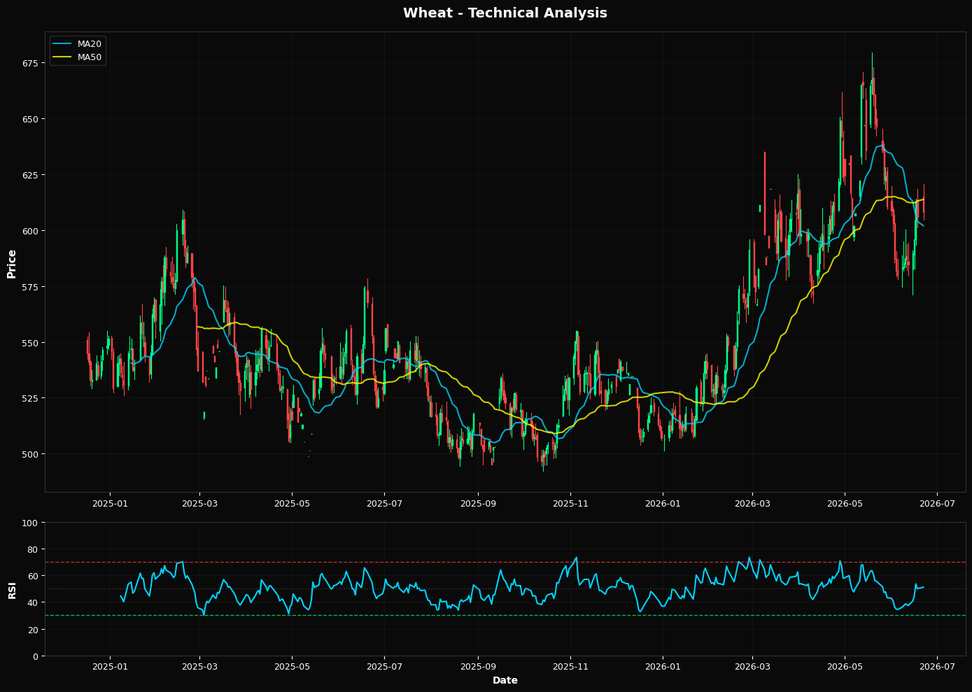
Wheat prices are poised for further gains as the market underestimates the impact of a weakening U.S. dollar. With wheat currently priced at $608.00, up 4.02% for the week, the commodity is benefiting from a softer dollar, which makes U.S. exports more competitive globally. The dollar's decline is a direct consequence of the Federal Reserve's recent dovish stance, suggesting a pause in rate hikes. This shift in monetary policy is crucial as it alleviates some of the upward pressure on the dollar, thereby supporting commodity prices, including wheat. The market may not fully appreciate how sustained dollar weakness could further bolster wheat prices, especially if global demand remains robust. From a technical perspective, wheat is showing bullish signals. The Relative Strength Index (RSI) at 51.1 indicates a neutral to slightly bullish momentum, suggesting room for further upside before reaching overbought conditions. The price is currently above the 20-day moving average of $601.95, but below the 50-day moving average of $613.70, indicating a potential breakout if it can surpass this resistance. The 200-day moving average at $556.64 provides a strong support level, reinforcing the upward trend. Additionally, the nearest Fibonacci support at $607.97 aligns closely with the current price, suggesting a solid foundation for further gains. These technical indicators collectively point to a bullish bias, with the potential for wheat to challenge its recent highs. A key risk to this bullish outlook is the potential for unexpected geopolitical developments, particularly in major wheat-producing regions like Ukraine or Russia. Any escalation in tensions or disruptions in these areas could lead to supply shocks, driving prices higher. Conversely, a resolution or easing of tensions could lead to increased supply and downward pressure on prices. The market may not be fully pricing in these geopolitical risks, which could lead to significant volatility. Looking ahead, the upcoming U.S. Department of Agriculture (USDA) report on global wheat supply and demand could be a pivotal catalyst. If the report indicates tighter-than-expected supplies or stronger global demand, it would confirm the bullish thesis and likely propel prices higher. Conversely, any indication of surplus or weakening demand could invalidate the current upward momentum. Investors should closely monitor this report for insights that could either reinforce or challenge the current market dynamics.📈 Technical Indicators Summary
RSI (14)
51.1
50-Day MA
$613.70
200-Day MA
$556.64
Fib Level
38.2%
📊 Technical Analysis Chart (18-Month View)
📐 Fibonacci Retracement Analysis
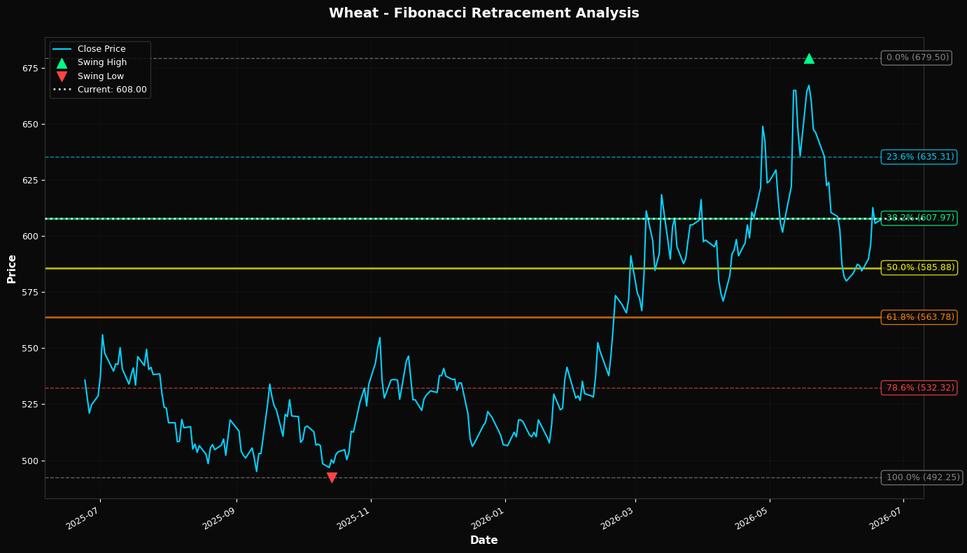
🎯 Key Trading Levels
Key Fibonacci Levels:
- 38.2%: $607.97
- 50.0%: $585.88
- 61.8%: $563.78
Support: $492.25 (Swing Low), $613.70 (50-Day MA)
Resistance: $679.50 (Swing High)
Disclaimer
The content on MarketsFN.com is provided for educational and informational purposes only. It does not constitute financial advice, investment recommendations, or trading guidance. All investments involve risks, and past performance does not guarantee future results. You are solely responsible for your investment decisions and should conduct independent research and consult a qualified financial advisor before acting. MarketsFN.com and its authors are not liable for any losses or damages arising from your use of this information.