Wheat: Up 0.9% to $590.00 — Testing 50.0% Fibonacci Support
· Commodities · QuoteReporter
Wheat: Up 0.9% to $590.00 — Testing 50.0% Fibonacci Support
Analysis Date: June 15, 2026
📊 Current Market Data
CURRENT PRICE
$590.00
DAILY CHANGE
+0.94%
WEEKLY CHANGE
+1.16%
52W HIGH
$679.50
52W LOW
$492.25
💡 Key Market Factors
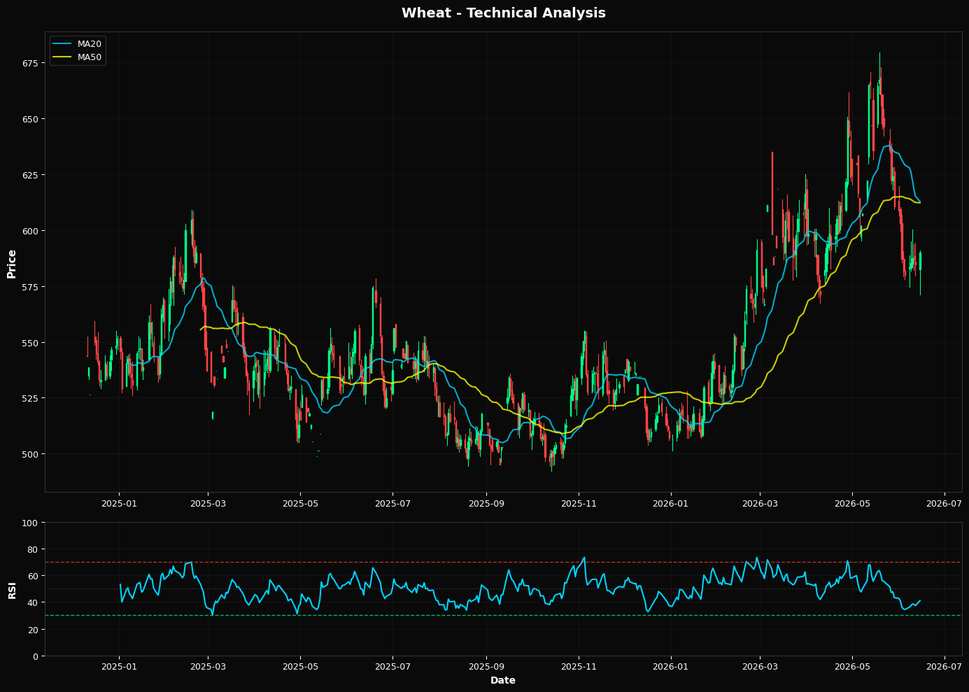
Wheat prices are poised for a potential upward correction, driven by technical support and macroeconomic factors. The most pressing macro driver for wheat today is the strength of the U.S. dollar. A strong dollar typically pressures commodity prices, but with the dollar's recent stabilization, wheat has room to recover. The dollar's influence is critical because it directly affects the purchasing power of international buyers, who are significant players in the wheat market. As the Federal Reserve signals a potential pause in rate hikes, the dollar could weaken, providing a tailwind for wheat prices. From a technical perspective, wheat is showing signs of resilience. The current price of $590.00 is above the nearest Fibonacci support at $585.88, suggesting a potential bounce. The RSI(14) at 40.9 indicates that wheat is not yet in oversold territory, but it is approaching levels where buying interest could increase. The price is below both the MA20 and MA50, which are closely aligned at $612.83 and $612.22, respectively, but remains above the MA200 at $554.76. This positioning suggests a short-term bearish trend within a longer-term bullish framework. The market may be underestimating the potential for a technical rebound if prices can sustain above the Fibonacci support. A key risk that could alter this outlook is the release of new agricultural yield data. Should reports indicate higher-than-expected wheat yields, prices could face downward pressure, negating the technical support. Conversely, any indication of adverse weather conditions affecting crop yields could act as a catalyst for price increases. The market may not be fully pricing in the potential for supply disruptions, which could lead to a rapid reassessment of wheat's value. Looking ahead, the upcoming U.S. inflation data will be crucial. If inflation shows signs of cooling, it could reinforce expectations of a dovish Fed stance, potentially weakening the dollar further and supporting commodity prices, including wheat. This data point will be pivotal in confirming whether the current technical and macroeconomic setup can sustain a bullish reversal in wheat prices.📈 Technical Indicators Summary
RSI (14)
40.9
50-Day MA
$612.22
200-Day MA
$554.76
Fib Level
50.0%
📊 Technical Analysis Chart (18-Month View)
📐 Fibonacci Retracement Analysis
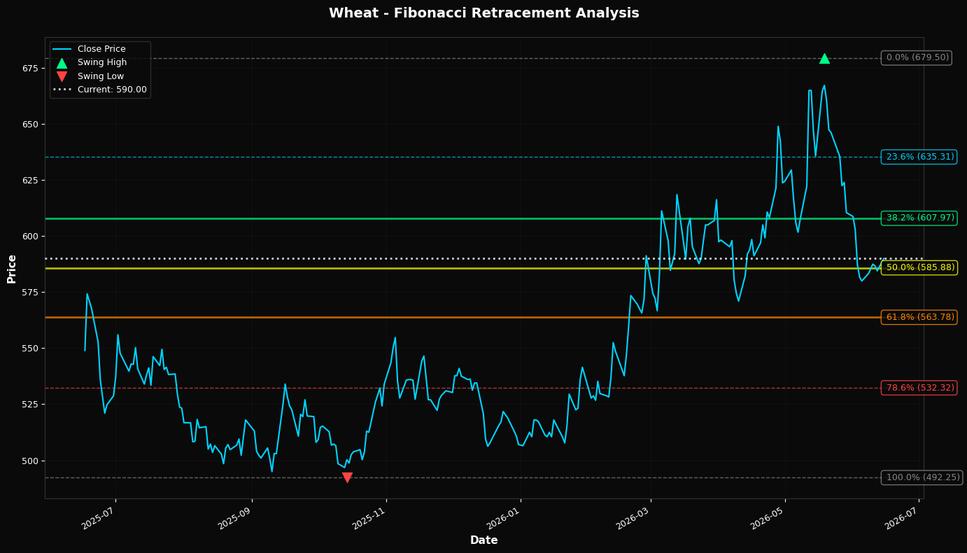
🎯 Key Trading Levels
Key Fibonacci Levels:
- 38.2%: $607.97
- 50.0%: $585.88
- 61.8%: $563.78
Support: $492.25 (Swing Low), $612.22 (50-Day MA)
Resistance: $679.50 (Swing High)
Disclaimer
The content on MarketsFN.com is provided for educational and informational purposes only. It does not constitute financial advice, investment recommendations, or trading guidance. All investments involve risks, and past performance does not guarantee future results. You are solely responsible for your investment decisions and should conduct independent research and consult a qualified financial advisor before acting. MarketsFN.com and its authors are not liable for any losses or damages arising from your use of this information.