Wheat: Up 1.7% to $596.00 — Testing 50.0% Fibonacci Support
· Commodities · QuoteReporter
Wheat: Up 1.7% to $596.00 — Testing 50.0% Fibonacci Support
Analysis Date: June 25, 2026
📊 Current Market Data
CURRENT PRICE
$596.00
DAILY CHANGE
+1.75%
WEEKLY CHANGE
-2.73%
52W HIGH
$679.50
52W LOW
$492.25
💡 Key Market Factors
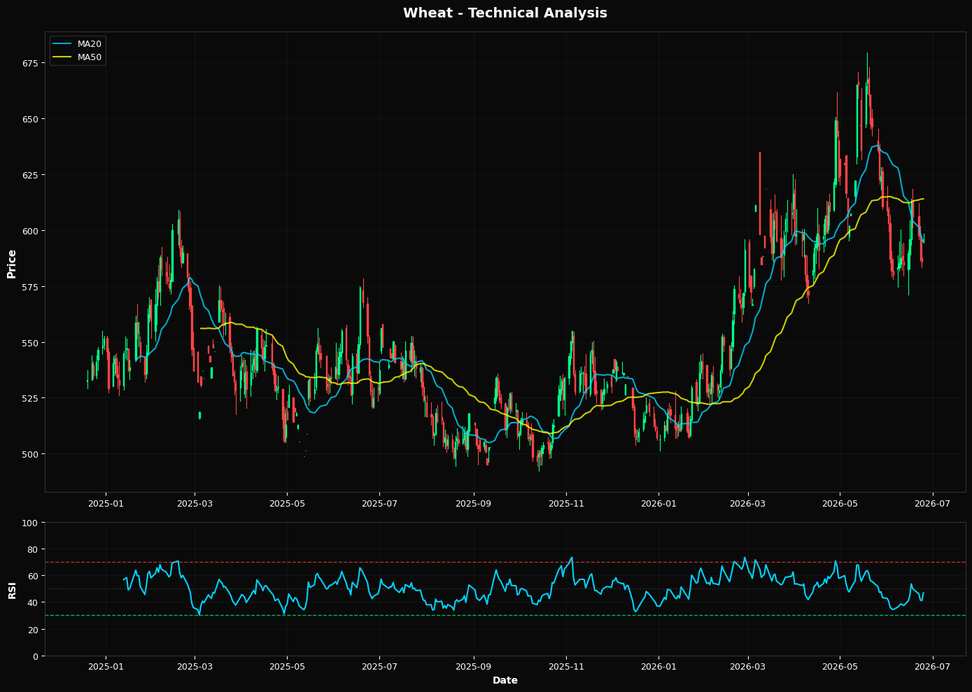
Wheat prices are poised for a potential rebound, driven by technical support and macroeconomic factors that may be underappreciated by the market. The most pressing macro driver for wheat right now is the strength of the U.S. dollar. A strong dollar typically exerts downward pressure on commodity prices, including wheat, by making U.S. exports more expensive for foreign buyers. However, with the Federal Reserve signaling a potential pause in rate hikes, the dollar could weaken, providing a tailwind for wheat prices. This dynamic is crucial as it directly impacts global competitiveness and demand for U.S. wheat exports. From a technical perspective, wheat is showing signs of stabilization and potential upward momentum. The current price of $596.00 is slightly above the 20-day moving average of $594.64, suggesting short-term bullishness. However, it remains below the 50-day moving average of $613.96, indicating that a longer-term uptrend has yet to be established. The Relative Strength Index (RSI) at 46.8 is neutral, but the proximity to the 50.0% Fibonacci retracement level at $585.88 provides a strong support zone. This suggests that the downside risk may be limited, and a bounce from this level could lead to a test of the 50-day moving average. A key risk that could alter the current outlook for wheat is geopolitical developments affecting major wheat-producing regions. Any escalation in conflict or trade disruptions in these areas could lead to supply constraints, driving prices higher. Conversely, a resolution or easing of tensions could alleviate supply concerns, putting downward pressure on prices. The market may be underpricing the potential for such geopolitical shocks, which could rapidly shift the supply-demand balance. Looking ahead, the upcoming U.S. Department of Agriculture (USDA) report on global wheat supply and demand will be critical. This report could either confirm the current support levels or challenge them by providing new insights into production forecasts and export demand. A bullish report could validate the technical support and drive prices higher, while a bearish report might test the resilience of the $585.88 Fibonacci level. Investors should closely watch this release for cues on the next directional move in wheat prices.📈 Technical Indicators Summary
RSI (14)
46.8
50-Day MA
$613.96
200-Day MA
$557.89
Fib Level
50.0%
📊 Technical Analysis Chart (18-Month View)
📐 Fibonacci Retracement Analysis
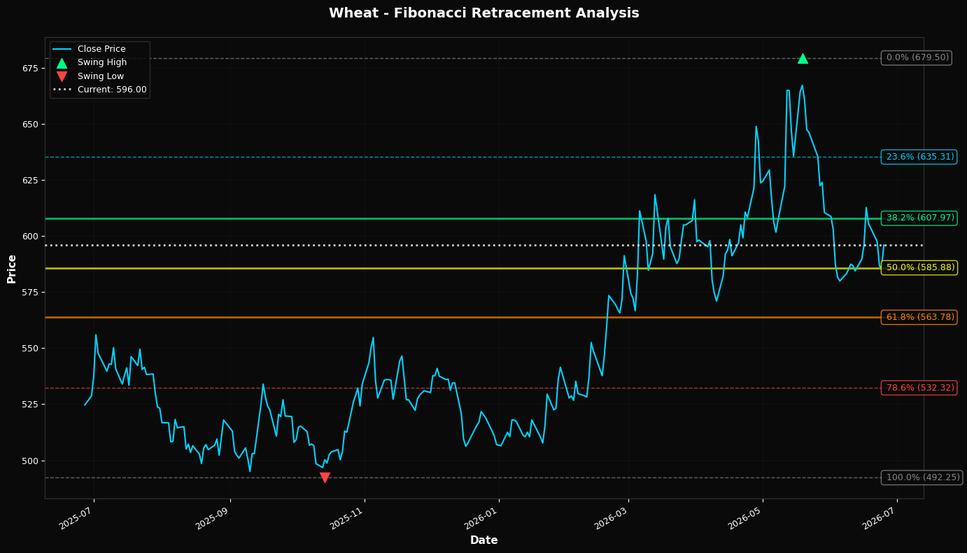
🎯 Key Trading Levels
Key Fibonacci Levels:
- 38.2%: $607.97
- 50.0%: $585.88
- 61.8%: $563.78
Support: $492.25 (Swing Low), $613.96 (50-Day MA)
Resistance: $679.50 (Swing High)
Disclaimer
The content on MarketsFN.com is provided for educational and informational purposes only. It does not constitute financial advice, investment recommendations, or trading guidance. All investments involve risks, and past performance does not guarantee future results. You are solely responsible for your investment decisions and should conduct independent research and consult a qualified financial advisor before acting. MarketsFN.com and its authors are not liable for any losses or damages arising from your use of this information.