Wheat: Up 3.9% to $603.25 — Testing 38.2% Fibonacci Support
· Commodities · QuoteReporter
Wheat: Up 3.9% to $603.25 — Testing 38.2% Fibonacci Support
Analysis Date: July 01, 2026
📊 Current Market Data
CURRENT PRICE
$603.25
DAILY CHANGE
+3.87%
WEEKLY CHANGE
+2.99%
52W HIGH
$679.50
52W LOW
$492.25
💡 Key Market Factors
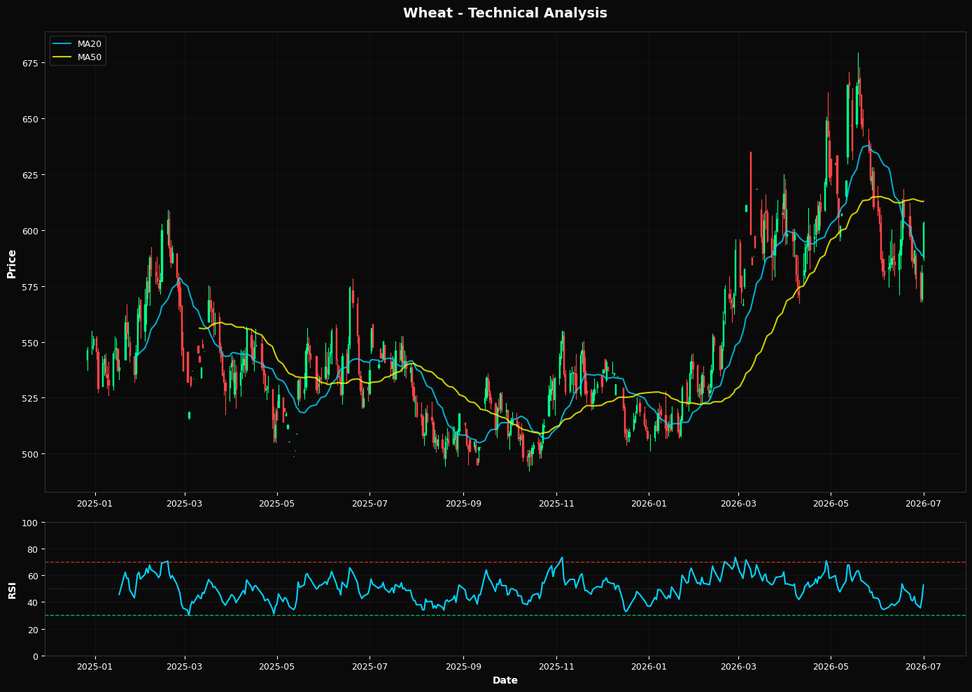
**Wheat Prices Poised for Further Gains Amid Inflation Concerns and Technical Strength** The most pressing factor influencing wheat prices today is inflation, which is exerting upward pressure on commodity prices broadly. With wheat currently priced at $603.25, reflecting a daily increase of +3.87% and a weekly gain of +2.99%, inflationary pressures are likely being underpriced by the market. As inflation persists, the purchasing power of the U.S. dollar diminishes, making dollar-denominated commodities like wheat more attractive. This dynamic is crucial as it suggests that the market may not fully appreciate the extent to which inflation could drive further price increases in wheat. The Federal Reserve's current stance on interest rates, which remains cautious, further supports this inflationary environment by keeping borrowing costs low and encouraging investment in real assets. From a technical perspective, wheat is showing signs of strength. The Relative Strength Index (RSI) at 52.6 indicates a neutral position but is trending towards bullish territory. The price is currently above the 20-day moving average (MA20) of $588.66, suggesting short-term momentum. However, it remains below the 50-day moving average (MA50) of $612.88, indicating that a breakout above this level could signal a more sustained upward trend. The 200-day moving average (MA200) at $559.52 provides a solid long-term support base. Importantly, the nearest Fibonacci support level at 38.2% is $607.97, just above the current price, which could act as a pivotal point for further gains. This technical setup suggests a bullish bias, with potential for the price to challenge the MA50 and possibly move towards the 52-week high of $679.50. A key risk or catalyst that could alter the current outlook for wheat is a significant change in U.S. monetary policy. Should the Federal Reserve signal a shift towards more aggressive interest rate hikes to combat inflation, this could strengthen the U.S. dollar and dampen the appeal of commodities like wheat. Conversely, any indication of continued dovishness could further fuel inflationary pressures, supporting higher wheat prices. The market may be underestimating the potential for such policy shifts, which could lead to rapid adjustments in wheat pricing. Looking ahead, the upcoming release of U.S. inflation data will be critical in confirming or invalidating this view. A higher-than-expected inflation print could reinforce the bullish case for wheat by highlighting persistent inflationary pressures, while a lower print might ease some of the upward pressure on prices. This data point will be pivotal in shaping market expectations around Fed policy and, by extension, the trajectory of wheat prices.📈 Technical Indicators Summary
RSI (14)
52.6
50-Day MA
$612.88
200-Day MA
$559.52
Fib Level
38.2%
📊 Technical Analysis Chart (18-Month View)
📐 Fibonacci Retracement Analysis
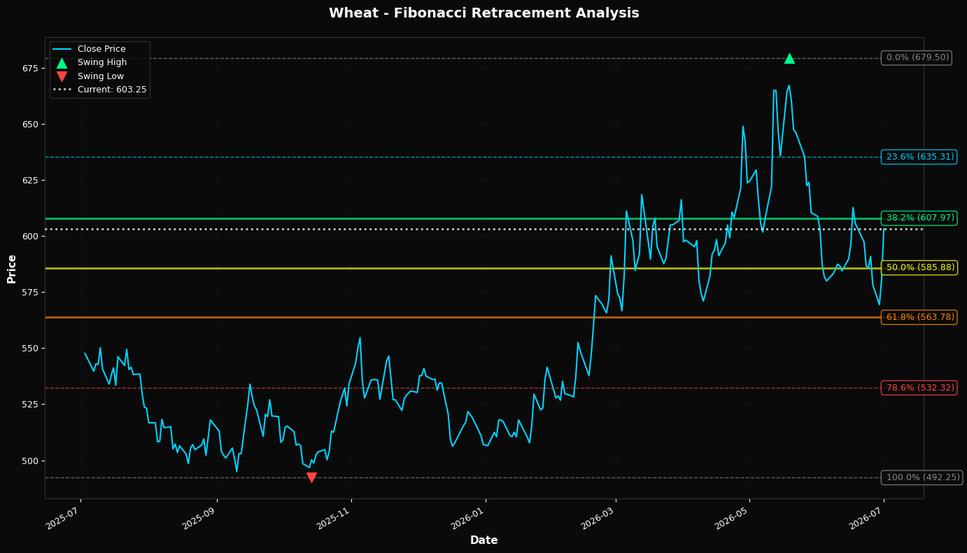
🎯 Key Trading Levels
Key Fibonacci Levels:
- 38.2%: $607.97
- 50.0%: $585.88
- 61.8%: $563.78
Support: $492.25 (Swing Low), $612.88 (50-Day MA)
Resistance: $679.50 (Swing High)
Disclaimer
The content on MarketsFN.com is provided for educational and informational purposes only. It does not constitute financial advice, investment recommendations, or trading guidance. All investments involve risks, and past performance does not guarantee future results. You are solely responsible for your investment decisions and should conduct independent research and consult a qualified financial advisor before acting. MarketsFN.com and its authors are not liable for any losses or damages arising from your use of this information.