Asian Indices Advance Led by Shanghai Composite
Shanghai Composite Technical Analysis
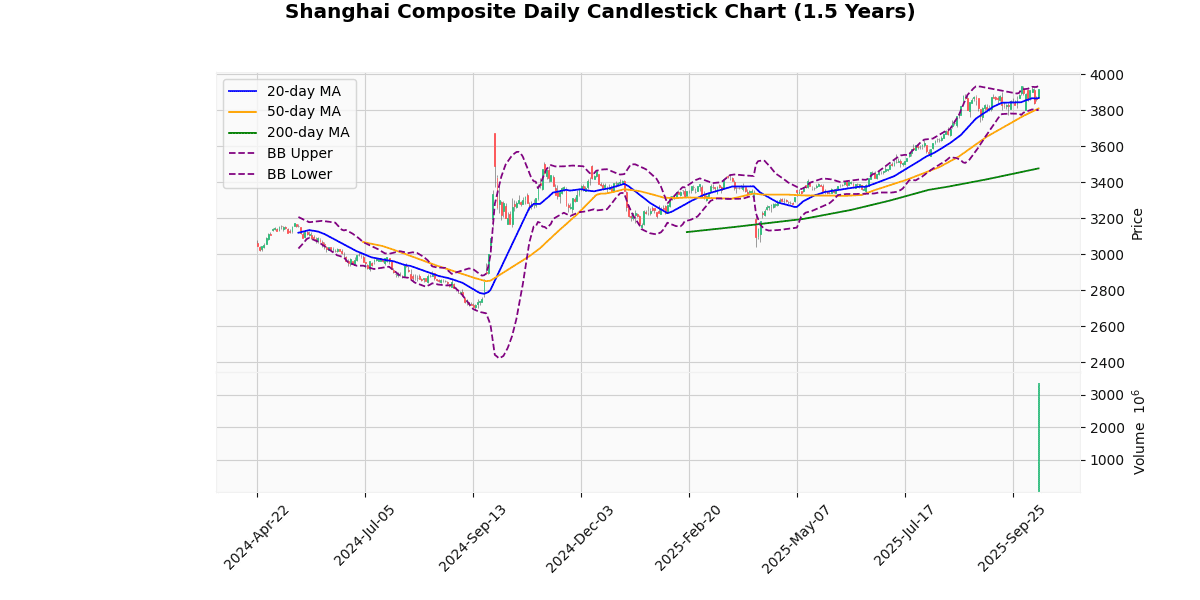
The Shanghai Composite Index is currently priced at 3916.33, marking a 1.36% increase today. This performance places the index near its 52-week and year-to-date highs of 3936.58, indicating a robust upward trend in recent sessions.
Analyzing the moving averages, the index is positioned above the 20-day (3867.74), 50-day (3809.84), and 200-day (3476.52) moving averages. This alignment suggests a strong bullish trend over multiple time frames. The significant distance above the 200-day moving average (12.65% higher) particularly underscores the long-term bullish sentiment.
The Bollinger Bands show the current price nearing the upper band (3935.22), which typically signals a high price level relative to recent volatility, potentially indicating overbought conditions. However, the index remains within the bands, suggesting that the current price level is not excessively volatile.
The Relative Strength Index (RSI) at 58.26 is neither in the overbought (>70) nor oversold (<30) territory, supporting a continuation of the current trend without immediate reversal signals. The Moving Average Convergence Divergence (MACD) at 24.41, with a signal line at 27.73, is indicative of a potential slowdown in momentum as the MACD is below the signal line, suggesting a bearish crossover might be approaching. The index’s proximity to its 3-day high (3921.06) and low (3835.36) further reflects recent consolidation, with a slight bias towards testing its upper range. The Average True Range (ATR) of 51.18 points to moderate daily volatility. In summary, the Shanghai Composite shows strong bullish signals across most metrics but with caution advised due to the potential overbought conditions suggested by the proximity to the upper Bollinger Band and the bearish hint from the MACD. Investors should watch for any shifts in these indicators for signs of a possible trend reversal or continuation of the current upward trajectory.
Technical Metrics
| Metric | Value |
|---|---|
| Current Price | 3916.33 |
| Today’s Change (%) | 1.36 |
| 20-day MA | 3867.74 |
| % from 20-day MA | 1.26 |
| 50-day MA | 3809.84 |
| % from 50-day MA | 2.80 |
| 200-day MA | 3476.52 |
| % from 200-day MA | 12.65 |
| Bollinger Upper | 3935.22 |
| % from BB Upper | -0.48 |
| Bollinger Lower | 3800.27 |
| % from BB Lower | 3.05 |
| RSI (14) | 58.26 |
| MACD | 24.41 |
| MACD Signal | 27.73 |
| 3-day High | 3921.06 |
| % from 3-day High | -0.12 |
| 3-day Low | 3835.36 |
| % from 3-day Low | 2.11 |
| 52-week High | 3936.58 |
| % from 52-week High | -0.51 |
| 52-week Low | 3040.69 |
| % from 52-week Low | 28.80 |
| YTD High | 3936.58 |
| % from YTD High | -0.51 |
| YTD Low | 3040.69 |
| % from YTD Low | 28.80 |
| ATR (14) | 51.18 |
The Shanghai Composite Index presents a bullish technical outlook as it trades above its key moving averages (MA20, MA50, MA200), indicating a strong upward trend over short, medium, and long-term periods. The current price of 3916.33 is near the upper Bollinger Band at 3935.22, suggesting that the index is testing resistance levels close to its 52-week and year-to-date highs around 3936.58. This proximity to the upper band and high points indicates potential resistance, but also shows strong market momentum.
The Relative Strength Index (RSI) at 58.26 is moderately bullish, suggesting some upward momentum without being overbought. However, the MACD (24.41) below its signal line (27.73) hints at a possible slowdown in the bullish momentum, warranting caution for immediate bullish trends.
Volatility, as measured by the Average True Range (ATR) of 51.18, indicates moderate price fluctuations, supporting the potential for continued active trading sessions.
Key support and resistance levels to watch are the recent 3-day low at 3835.36 and the 52-week high at 3936.58, respectively. The index’s performance above the MA200 by a significant 12.65% also underscores a robust longer-term bullish sentiment in the market.
Overall, the market sentiment appears positive, but investors should monitor for any shifts indicated by MACD and RSI, and be wary of potential resistance near current levels.
Hang Seng Technical Analysis
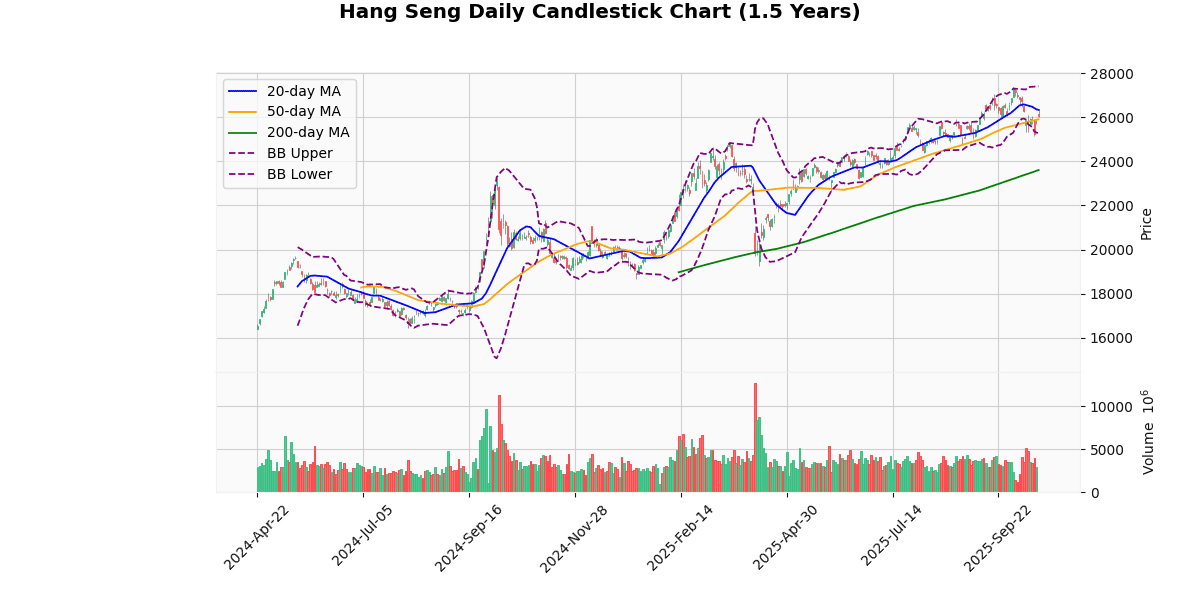
The Hang Seng Index is currently trading at 26,055.02, reflecting a modest increase of 0.76% today. The index is positioned below its 20-day moving average (MA20) of 26,333.11 but above its 50-day (MA50) and 200-day (MA200) moving averages, which are 25,910.97 and 23,604.29, respectively. This suggests a mixed short-term trend but a stronger performance in the medium to long term.
The Bollinger Bands indicate a range with the upper band at 27,402.1 and the lower band at 25,264.13. The current price is closer to the lower band, suggesting that the index might be nearing a potentially oversold territory, although it is not yet confirmed as the price is not touching the lower band.
The Relative Strength Index (RSI) at 49.29 is neutral, indicating neither overbought nor oversold conditions. This aligns with the current price’s position within the Bollinger Bands.
The Moving Average Convergence Divergence (MACD) is at -68.18 with its signal line at 60.9, indicating a bearish crossover. This suggests that the index might experience further downward pressure in the short term.
The index’s 3-day high is 26,367.35 and the 3-day low is 25,145.34, with the current price closer to the high, showing some recent recovery. The Average True Range (ATR) of 499.79 points to a high level of recent volatility, which is consistent with the significant fluctuations between the 3-day high and low.
In summary, the Hang Seng Index shows a bearish signal in the short term due to the MACD crossover and its position relative to the MA20. However, the proximity to the lower Bollinger Band and a neutral RSI suggest caution before concluding a strong bearish trend. Investors should watch for potential support near the lower Bollinger Band or any changes in the MACD and RSI for more definitive trading signals.
Technical Metrics
| Metric | Value |
|---|---|
| Current Price | 26055.02 |
| Today’s Change (%) | 0.76 |
| 20-day MA | 26333.11 |
| % from 20-day MA | -1.06 |
| 50-day MA | 25910.97 |
| % from 50-day MA | 0.56 |
| 200-day MA | 23604.29 |
| % from 200-day MA | 10.38 |
| Bollinger Upper | 27402.10 |
| % from BB Upper | -4.92 |
| Bollinger Lower | 25264.13 |
| % from BB Lower | 3.13 |
| RSI (14) | 49.29 |
| MACD | -68.18 |
| MACD Signal | 60.90 |
| 3-day High | 26367.35 |
| % from 3-day High | -1.18 |
| 3-day Low | 25145.34 |
| % from 3-day Low | 3.62 |
| 52-week High | 27381.84 |
| % from 52-week High | -4.85 |
| 52-week Low | 18671.49 |
| % from 52-week Low | 39.54 |
| YTD High | 27381.84 |
| % from YTD High | -4.85 |
| YTD Low | 18671.49 |
| % from YTD Low | 39.54 |
| ATR (14) | 499.79 |
The Hang Seng Index is currently exhibiting mixed technical signals, suggesting a cautious outlook. The index’s current price of 26,055.02 is hovering between the 50-day moving average (MA50) at 25,910.97, which it slightly exceeds, and the 20-day moving average (MA20) at 26,333.11, which it is currently below. This positioning indicates a potential consolidation phase in the short term.
The Bollinger Bands show the index trading closer to the lower band at 25,264.13, suggesting that the index might be approaching oversold territory. However, the Relative Strength Index (RSI) at 49.29 and the MACD value at -68.18, below its signal line at 60.9, both signal a lack of strong momentum, with a slight bearish bias.
Volatility, as indicated by the Average True Range (ATR) of 499.79, remains relatively high, pointing to continued uncertainty and potential price swings in the near term.
Key support and resistance levels to watch are the recent three-day low at 25,145.34 and the three-day high at 26,367.35, respectively. The proximity to the 52-week low suggests a significant recovery over the past year, yet the distance from the 52-week high indicates room for potential upside if positive momentum returns.
Overall, market sentiment appears cautiously optimistic but leans towards a wait-and-see approach, given the mixed technical indicators and the current geopolitical and economic context impacting global markets. Investors should monitor these levels and indicators closely for signs of a clearer directional trend.
Nikkei 225 Technical Analysis
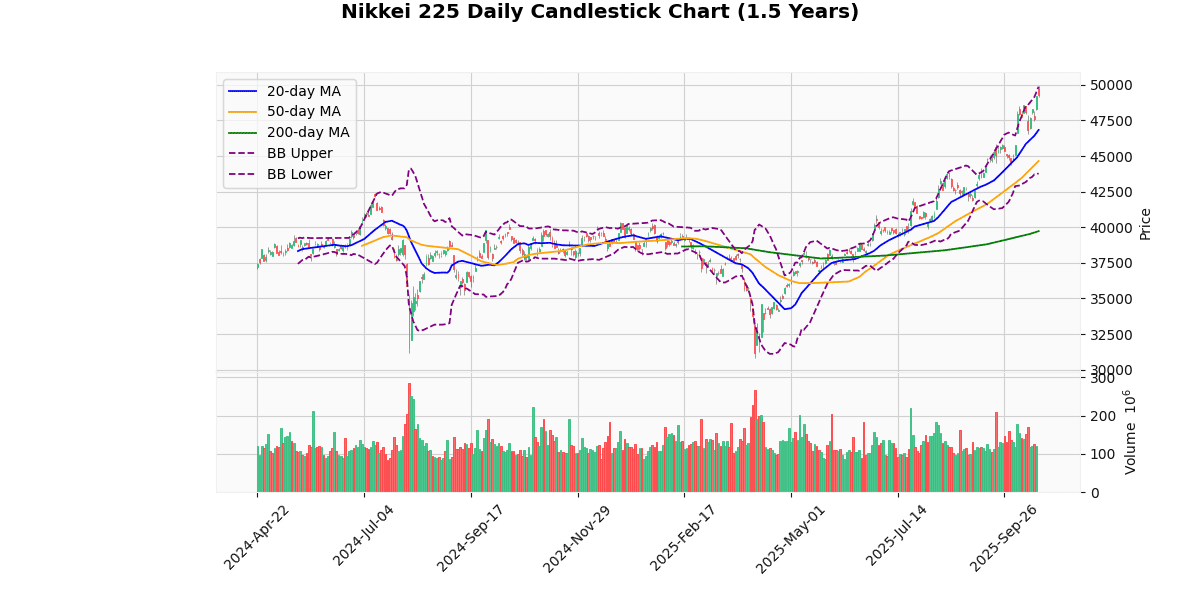
The Nikkei 225 index currently stands at 49,316.06, marking a modest increase of 0.27% today. This performance is particularly notable when considering the index’s significant gains over its 20-day (5.3%), 50-day (10.46%), and 200-day (24.14%) moving averages, indicating a strong upward trend over these periods.
The Bollinger Bands show the index nearing the upper band (49,876.06), which suggests that the market might be approaching overbought territory. This is further supported by the Relative Strength Index (RSI) at 68.44, nearing the overbought threshold of 70, hinting at potential upcoming price stabilization or a minor pullback.
The Moving Average Convergence Divergence (MACD) stands at 1253.61, above its signal line at 1139.64, which typically suggests bullish momentum. However, investors should watch for any potential MACD crossovers that might indicate a shift in momentum.
The index’s proximity to its 52-week and year-to-date high (49,945.95), with a minimal percentage difference of -1.26%, underscores the strong bullish momentum throughout the year. However, the Average True Range (ATR) of 820 points to considerable daily volatility, suggesting that while the trend is upward, significant price swings are common.
In summary, the Nikkei 225 is exhibiting strong bullish signals with its performance above key moving averages and near its historical highs. However, the proximity to the upper Bollinger Band and a high RSI value caution against potential overbought conditions, which could lead to short-term price corrections. Investors should monitor these indicators closely for signs of reversal or continued strength in the market trend.
Technical Metrics
| Metric | Value |
|---|---|
| Current Price | 49316.06 |
| Today’s Change (%) | 0.27 |
| 20-day MA | 46832.43 |
| % from 20-day MA | 5.30 |
| 50-day MA | 44647.43 |
| % from 50-day MA | 10.46 |
| 200-day MA | 39726.46 |
| % from 200-day MA | 24.14 |
| Bollinger Upper | 49876.06 |
| % from BB Upper | -1.12 |
| Bollinger Lower | 43788.80 |
| % from BB Lower | 12.62 |
| RSI (14) | 68.44 |
| MACD | 1253.61 |
| MACD Signal | 1139.64 |
| 3-day High | 49945.95 |
| % from 3-day High | -1.26 |
| 3-day Low | 47494.31 |
| % from 3-day Low | 3.84 |
| 52-week High | 49945.95 |
| % from 52-week High | -1.26 |
| 52-week Low | 30792.74 |
| % from 52-week Low | 60.15 |
| YTD High | 49945.95 |
| % from YTD High | -1.26 |
| YTD Low | 30792.74 |
| % from YTD Low | 60.15 |
| ATR (14) | 820.00 |
The technical outlook for the Nikkei 225 index shows a strong bullish trend, as indicated by its current price of 49,316.06, which is significantly above its 20-day, 50-day, and 200-day moving averages. This suggests sustained upward momentum over both short and long-term periods. The index is trading near the upper Bollinger Band, just below its recent 3-day and 52-week high at 49,945.95, indicating potential resistance around this level. If the index surpasses this point, it could signal further bullish momentum.
The Relative Strength Index (RSI) at 68.44 is approaching the overbought territory, which could suggest a potential pullback or stabilization in the near term. However, the MACD above its signal line confirms the ongoing strength in the trend. The Average True Range (ATR) of 820 points to high volatility, aligning with significant price movements and active trading environments.
Key support levels might be found at the middle Bollinger Band (46,832.43) and further at the 20-day moving average. Resistance is currently tested near the recent highs and the upper Bollinger Band. Market sentiment appears bullish, supported by strong technical indicators, but traders should watch for signs of reversal or consolidation given the proximity to overbought conditions and key resistance levels.
KOSPI Composite Technical Analysis
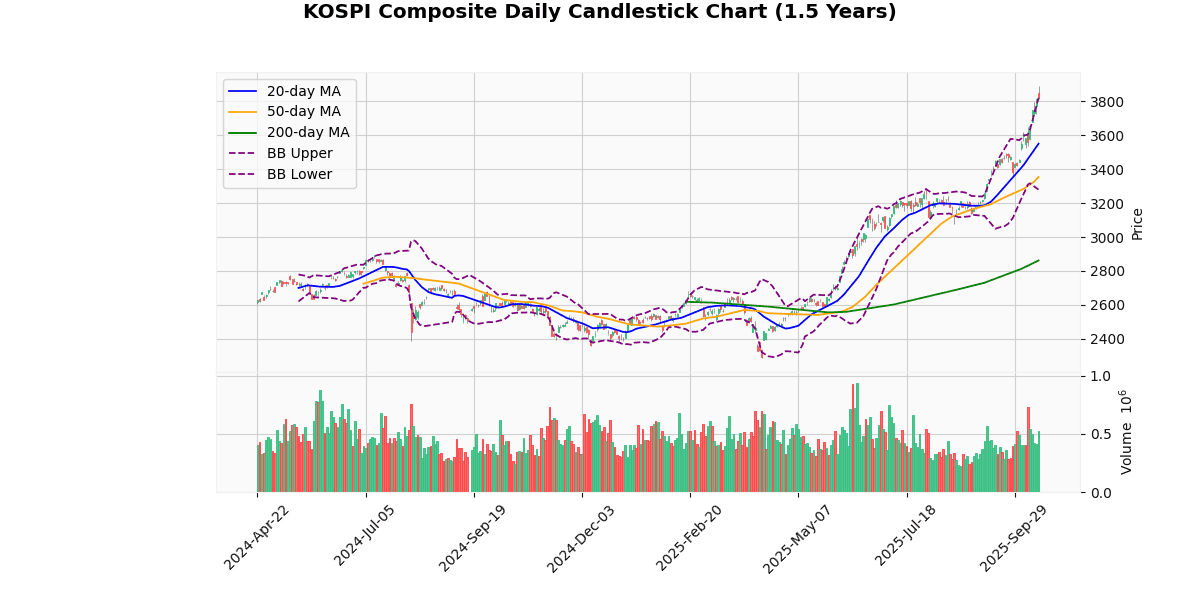
The KOSPI Composite index is currently priced at 3823.84, marking a modest increase of 0.24% today. The index shows a strong upward trend, as indicated by its position above all key moving averages: 20-day (3550.75), 50-day (3354.4), and 200-day (2861.94). This configuration suggests a solid bullish momentum over short, medium, and long-term periods.
The Bollinger Bands reveal that the current price is slightly above the upper band (3821.5), which typically signals an overextended market condition. This is further supported by the Relative Strength Index (RSI) at 80.05, indicating that the index is in the overbought territory, which could precede a potential pullback or consolidation in the near term.
The Moving Average Convergence Divergence (MACD) stands at 123.38, well above its signal line at 97.02, confirming the ongoing bullish sentiment. However, the significant distance between the MACD and its signal line, coupled with the high RSI, might suggest caution as the market could be overheating.
The index is currently near its 52-week and year-to-date high of 3893.06, having recently moved -1.78% from this peak. The Average True Range (ATR) at 64.39 points to a relatively high volatility, which aligns with the recent price fluctuations within the 3-day range between 3722.07 and 3893.06.
In summary, while the KOSPI Composite exhibits strong bullish signals with prices well above moving averages and a positive MACD, the overbought RSI and proximity to the upper Bollinger Band could suggest a near-term retracement or consolidation. Investors should watch for potential MACD crossovers or RSI declines as indicators for adjusting positions.
Technical Metrics
| Metric | Value |
|---|---|
| Current Price | 3823.84 |
| Today’s Change (%) | 0.24 |
| 20-day MA | 3550.75 |
| % from 20-day MA | 7.69 |
| 50-day MA | 3354.40 |
| % from 50-day MA | 13.99 |
| 200-day MA | 2861.94 |
| % from 200-day MA | 33.61 |
| Bollinger Upper | 3821.50 |
| % from BB Upper | 0.06 |
| Bollinger Lower | 3280.00 |
| % from BB Lower | 16.58 |
| RSI (14) | 80.05 |
| MACD | 123.38 |
| MACD Signal | 97.02 |
| 3-day High | 3893.06 |
| % from 3-day High | -1.78 |
| 3-day Low | 3722.07 |
| % from 3-day Low | 2.73 |
| 52-week High | 3893.06 |
| % from 52-week High | -1.78 |
| 52-week Low | 2284.72 |
| % from 52-week Low | 67.37 |
| YTD High | 3893.06 |
| % from YTD High | -1.78 |
| YTD Low | 2284.72 |
| % from YTD Low | 67.37 |
| ATR (14) | 64.39 |
The KOSPI Composite Index currently exhibits a strong bullish trend, as indicated by its position relative to key moving averages and Bollinger Bands. The index’s current price of 3823.84 is significantly above the 20-day moving average (MA20) of 3550.75, the 50-day moving average (MA50) of 3354.4, and the 200-day moving average (MA200) of 2861.94, highlighting a sustained upward movement over both short and long terms.
The index is trading just above the upper Bollinger Band at 3821.5, suggesting that it is potentially overextended in the short term. This is further supported by a high Relative Strength Index (RSI) of 80.05, indicating overbought conditions which might lead to a pullback or consolidation in the near future.
The Moving Average Convergence Divergence (MACD) at 123.38, above its signal line at 97.02, confirms the ongoing bullish momentum. However, the proximity to the year-to-date and 52-week high at 3893.06 suggests that the index may encounter resistance near this level.
Volatility, as measured by the Average True Range (ATR) of 64.39, remains relatively high, indicating that significant price movements can be expected, which aligns with the recent price dynamics.
In summary, while the KOSPI Composite’s technical outlook is robustly bullish, the current overbought conditions and approaching resistance near historical highs suggest potential for short-term volatility with a chance of pullback. Investors should watch for support around the lower Bollinger Band at 3280.0 and the recent low at 3722.07 in case of a downward correction.


