Asian Indices Decline with Hang Seng Leading Losses
Shanghai Composite Technical Analysis
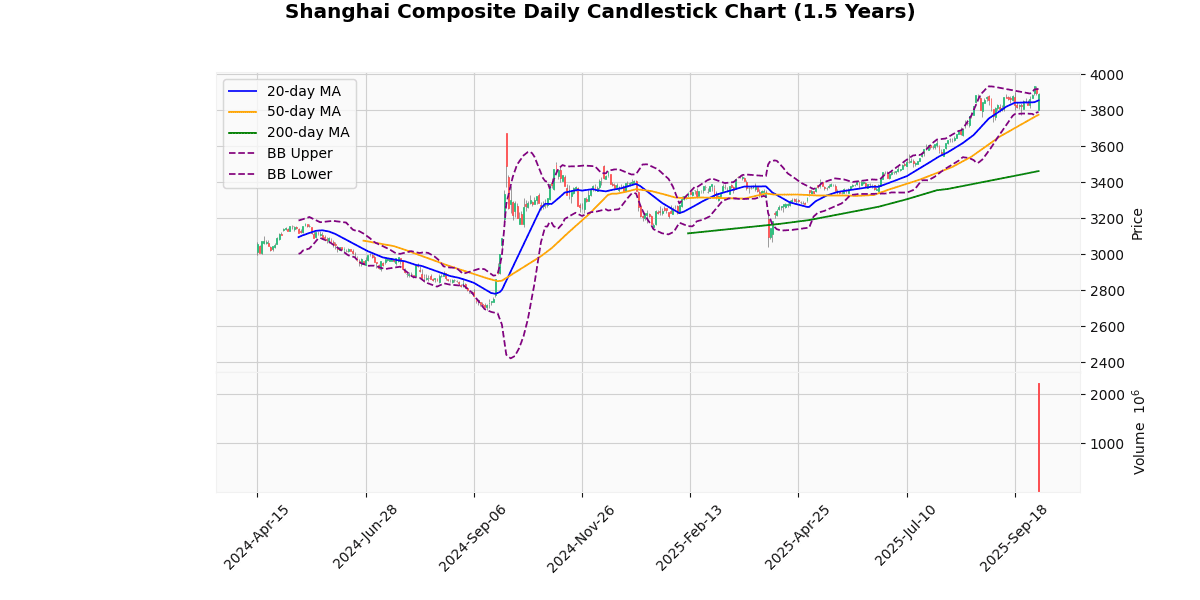
The Shanghai Composite Index currently stands at 3889.5, marking a slight decrease of 0.19% today. The index has shown a robust upward trend over the year, as evidenced by its current position above all key moving averages: 20-day (3854.7), 50-day (3774.36), and 200-day (3461.72). This indicates a strong bullish trend in the medium to long term.
The Bollinger Bands reveal the index is trading near the upper band (3918.57), suggesting it is approaching overbought territory, although it hasn’t breached this level. The proximity to the upper band, coupled with a Relative Strength Index (RSI) of 58.74, indicates sustained buying interest, but not yet into the overbought zone (RSI > 70).
The Moving Average Convergence Divergence (MACD) at 31.79 with a signal line at 31.92 shows a potential for a bearish crossover if the MACD line continues to descend. This could signal a short-term reversal or consolidation if confirmed.
The index’s performance relative to its 3-day high (3936.58) and low (3800.11) shows recent volatility, with a current price closer to the high, reflecting recent bullish momentum. The Average True Range (ATR) of 48.95 further supports this increased volatility.
Year-to-date and 52-week metrics highlight significant gains, with the index up 27.92% from the YTD low and an impressive 40.85% from the 52-week low, underscoring a strong recovery and bullish sentiment throughout the year.
In summary, the Shanghai Composite Index shows a strong bullish trend with potential signs of nearing overbought conditions. Investors should watch for a MACD crossover and any movement outside the Bollinger Bands for signals of short-term directional changes.
Technical Metrics
| Metric | Value |
|---|---|
| Current Price | 3889.50 |
| Today’s Change (%) | -0.19 |
| 20-day MA | 3854.70 |
| % from 20-day MA | 0.90 |
| 50-day MA | 3774.36 |
| % from 50-day MA | 3.05 |
| 200-day MA | 3461.72 |
| % from 200-day MA | 12.36 |
| Bollinger Upper | 3918.57 |
| % from BB Upper | -0.74 |
| Bollinger Lower | 3790.83 |
| % from BB Lower | 2.60 |
| RSI (14) | 58.74 |
| MACD | 31.79 |
| MACD Signal | 31.92 |
| 3-day High | 3936.58 |
| % from 3-day High | -1.20 |
| 3-day Low | 3800.11 |
| % from 3-day Low | 2.35 |
| 52-week High | 3936.58 |
| % from 52-week High | -1.20 |
| 52-week Low | 2761.37 |
| % from 52-week Low | 40.85 |
| YTD High | 3936.58 |
| % from YTD High | -1.20 |
| YTD Low | 3040.69 |
| % from YTD Low | 27.92 |
| ATR (14) | 48.95 |
The Shanghai Composite Index currently exhibits a bullish trend, as evidenced by its position above all key moving averages (MA20, MA50, MA200), suggesting sustained upward momentum over short, medium, and long-term periods. The index’s current price of 3889.5 is slightly below the upper Bollinger Band (3918.57) but remains well above the middle and lower bands, indicating that it is trading near the higher end of its recent price range.
The Relative Strength Index (RSI) at 58.74 points towards a neither overbought nor oversold condition, suggesting moderate bullish momentum without immediate concerns of a reversal. The MACD value is very close to its signal line, indicating a potential consolidation phase or a pause in momentum, as there is no clear divergence signaling a strong move.
The Average True Range (ATR) of 48.95 reflects moderate volatility, which is consistent with the index’s recent price fluctuations. Key support and resistance levels are identified at the recent three-day low of 3800.11 and the 52-week high of 3936.58, respectively. The proximity to the 52-week high also highlights the market’s positive sentiment and the potential for testing new highs if bullish momentum continues.
Overall, the technical outlook for the Shanghai Composite is positive, with a watchful eye on potential shifts in momentum indicated by MACD and any significant increase in volatility that could affect stability.
Hang Seng Technical Analysis
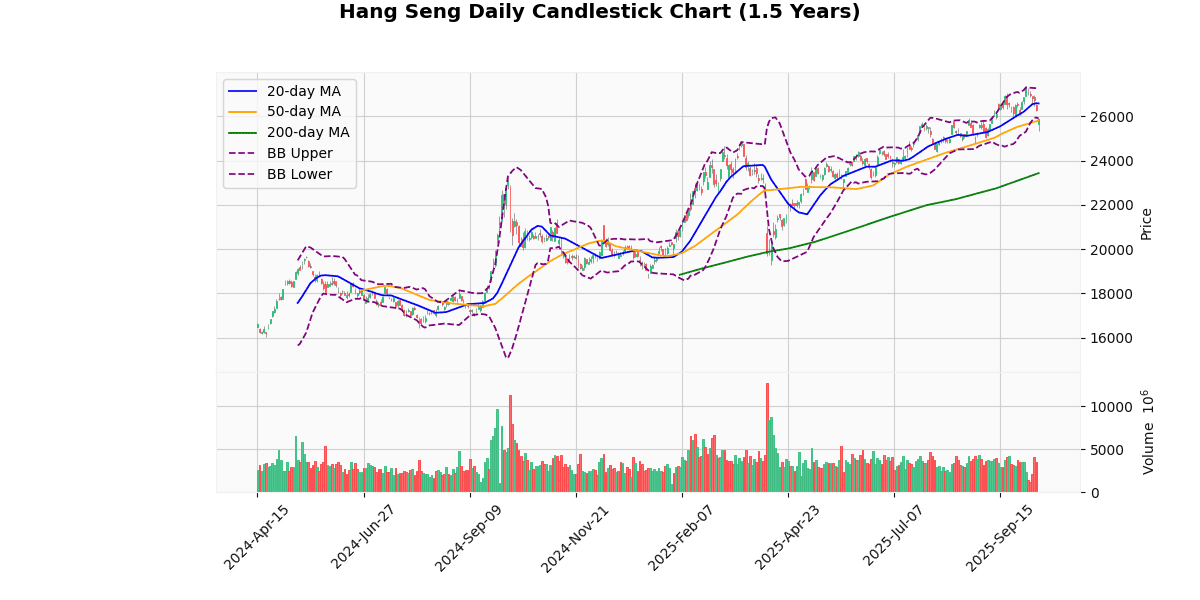
The Hang Seng Index is currently priced at 25,889.48, marking a decline of 1.52% today. This movement places the index below its 20-day moving average (MA20) of 26,576.62 and slightly above its 50-day moving average (MA50) of 25,802.84, indicating a potential trend reversal or short-term bearish sentiment. The index is significantly above its 200-day moving average (MA200) of 23,429.33, suggesting a longer-term bullish trend.
The Bollinger Bands show the current price near the lower band (25,895.11), which often indicates a potential oversold condition or a level where the market might find support. The upper Bollinger Band is at 27,258.14, far from the current price, highlighting recent volatility and a downward price movement.
The Relative Strength Index (RSI) at 43.5 does not indicate extreme conditions, as it is neither in the overbought (>70) nor the oversold (<30) range. However, it leans towards the lower end, suggesting mild bearish momentum.
The Moving Average Convergence Divergence (MACD) at 201.18 with a signal line at 310.0 shows a bearish crossover as the MACD is below the signal, reinforcing the potential continuation of the current downtrend.
The index’s Average True Range (ATR) of 445.09 points to high volatility, consistent with the significant daily price range and recent market fluctuations.
Considering the 3-day, 52-week, and year-to-date metrics, the index has recently been trading closer to its lower ranges, indicating a pullback from higher levels observed earlier. The proximity to the 3-day low (25,336.09) and the significant drop from the 3-day high (26,978.41) further validate this bearish sentiment.
Overall, the technical indicators suggest cautious bearish momentum with potential support near the lower Bollinger Band. Investors should watch for any signs of reversal if the index approaches oversold RSI levels or if there is a positive MACD crossover, which could indicate a shift in momentum.
Technical Metrics
| Metric | Value |
|---|---|
| Current Price | 25889.48 |
| Today’s Change (%) | -1.52 |
| 20-day MA | 26576.62 |
| % from 20-day MA | -2.59 |
| 50-day MA | 25802.84 |
| % from 50-day MA | 0.34 |
| 200-day MA | 23429.33 |
| % from 200-day MA | 10.50 |
| Bollinger Upper | 27258.14 |
| % from BB Upper | -5.02 |
| Bollinger Lower | 25895.11 |
| % from BB Lower | -0.02 |
| RSI (14) | 43.50 |
| MACD | 201.18 |
| MACD Signal | 310.00 |
| 3-day High | 26978.41 |
| % from 3-day High | -4.04 |
| 3-day Low | 25336.09 |
| % from 3-day Low | 2.18 |
| 52-week High | 27381.84 |
| % from 52-week High | -5.45 |
| 52-week Low | 18671.49 |
| % from 52-week Low | 38.66 |
| YTD High | 27381.84 |
| % from YTD High | -5.45 |
| YTD Low | 18671.49 |
| % from YTD Low | 38.66 |
| ATR (14) | 445.09 |
The technical outlook for the Hang Seng Index indicates a mixed sentiment with a slight bearish bias. Currently trading at 25889.48, the index is positioned just below the lower Bollinger Band (25895.11) and slightly above the 50-day moving average (25802.84), suggesting a potential consolidation or reversal point. However, the index remains well below the 20-day moving average (26576.62) and the middle Bollinger Band, which aligns with the 20-day MA, indicating recent bearish momentum.
The Relative Strength Index (RSI) at 43.5 points to neither overbought nor oversold conditions, providing a neutral signal. However, the MACD (201.18) below its signal line (310.0) suggests bearish momentum in the short term. The Average True Range (ATR) of 445.09 reflects moderate volatility, which could mean potential for significant price movements.
Key support and resistance levels are evident with immediate support around the recent low at 25336.09 and resistance near the 20-day MA and upper Bollinger Band around 26576.62 and 27258.14, respectively. The index’s performance relative to its 200-day moving average (23429.33) shows a longer-term upward trend, but recent price actions and indicators suggest cautious trading in the near term. Overall, traders should monitor these levels and indicators closely for signs of directional changes or continuation of the current trend.
Nikkei 225 Technical Analysis
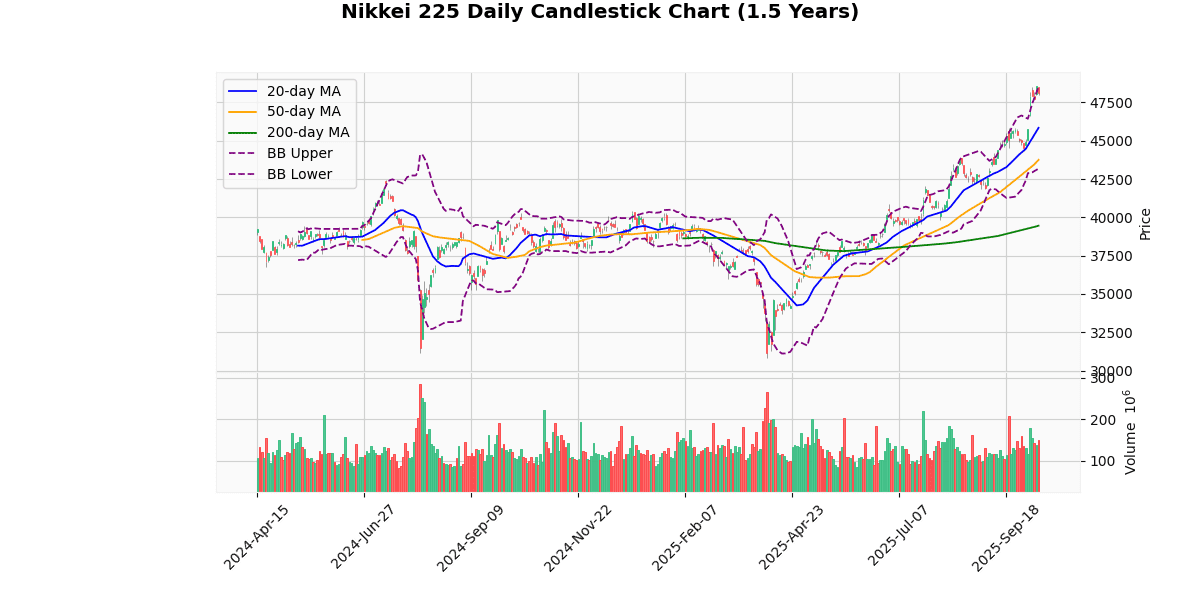
The Nikkei 225 index is currently priced at 48,088.8, reflecting a decline of 1.01% today. This recent drop places the index just below its upper Bollinger Band (48,515.5) and its recent 3-day and 52-week high of 48,597.08, indicating a potential short-term overextension in price movement.
The index’s moving averages show a strong upward trend, with the current price significantly above the 20-day (45,847.49), 50-day (43,752.99), and 200-day (39,454.95) moving averages. This suggests a robust long-term bullish trend, with the price 21.88% above the 200-day moving average.
The Relative Strength Index (RSI) at 71.76 signals that the index might be entering overbought territory, which could precede a potential pullback or consolidation in the near term. Additionally, the MACD value of 1242.9, being above its signal line (1008.6), supports the strong bullish momentum but also warrants caution for a possible reversal as it indicates heightened buying activity.
The Average True Range (ATR) of 693.59 points to a relatively high volatility, aligning with the significant daily price movements and the recent testing of upper resistance levels.
In summary, while the Nikkei 225 demonstrates a strong bullish trend over the medium to long term, the proximity to its recent highs and the overbought RSI levels suggest that investors might see some short-term consolidation or a slight pullback. The key will be to watch for any MACD crossovers or a sustained move outside of the Bollinger Bands which could signal a shift in the current trend dynamics.
Technical Metrics
| Metric | Value |
|---|---|
| Current Price | 48088.80 |
| Today’s Change (%) | -1.01 |
| 20-day MA | 45847.49 |
| % from 20-day MA | 4.89 |
| 50-day MA | 43752.99 |
| % from 50-day MA | 9.91 |
| 200-day MA | 39454.95 |
| % from 200-day MA | 21.88 |
| Bollinger Upper | 48515.50 |
| % from BB Upper | -0.88 |
| Bollinger Lower | 43179.47 |
| % from BB Lower | 11.37 |
| RSI (14) | 71.76 |
| MACD | 1242.90 |
| MACD Signal | 1008.60 |
| 3-day High | 48597.08 |
| % from 3-day High | -1.05 |
| 3-day Low | 47728.27 |
| % from 3-day Low | 0.76 |
| 52-week High | 48597.08 |
| % from 52-week High | -1.05 |
| 52-week Low | 30792.74 |
| % from 52-week Low | 56.17 |
| YTD High | 48597.08 |
| % from YTD High | -1.05 |
| YTD Low | 30792.74 |
| % from YTD Low | 56.17 |
| ATR (14) | 693.59 |
The technical outlook for the Nikkei 225 index suggests a strong bullish trend, as indicated by its current price of 48,088.8, which is significantly above its 20-day, 50-day, and 200-day moving averages. The index is trading near its upper Bollinger Band and has recently approached its 52-week and year-to-date highs, signaling robust upward momentum. However, the proximity to the upper Bollinger Band at 48,515.5 and a slight retreat from the recent high suggests potential short-term resistance or consolidation.
The Relative Strength Index (RSI) at 71.76 indicates an overbought condition, which could lead to a temporary pullback or sideways movement. Meanwhile, the MACD value of 1242.9, above its signal line at 1008.6, supports the continuation of the bullish trend but also warrants caution for potential overextension.
Volatility, as measured by the Average True Range (ATR) of 693.59, remains elevated, reflecting ongoing market dynamics and possible price fluctuations. Key support and resistance levels to watch are the recent 3-day low at 47,728.27 and the upper Bollinger Band, respectively. Overall, market sentiment appears positive, but vigilance is advised due to signs of potential overbought conditions and approaching resistance levels.
KOSPI Composite Technical Analysis
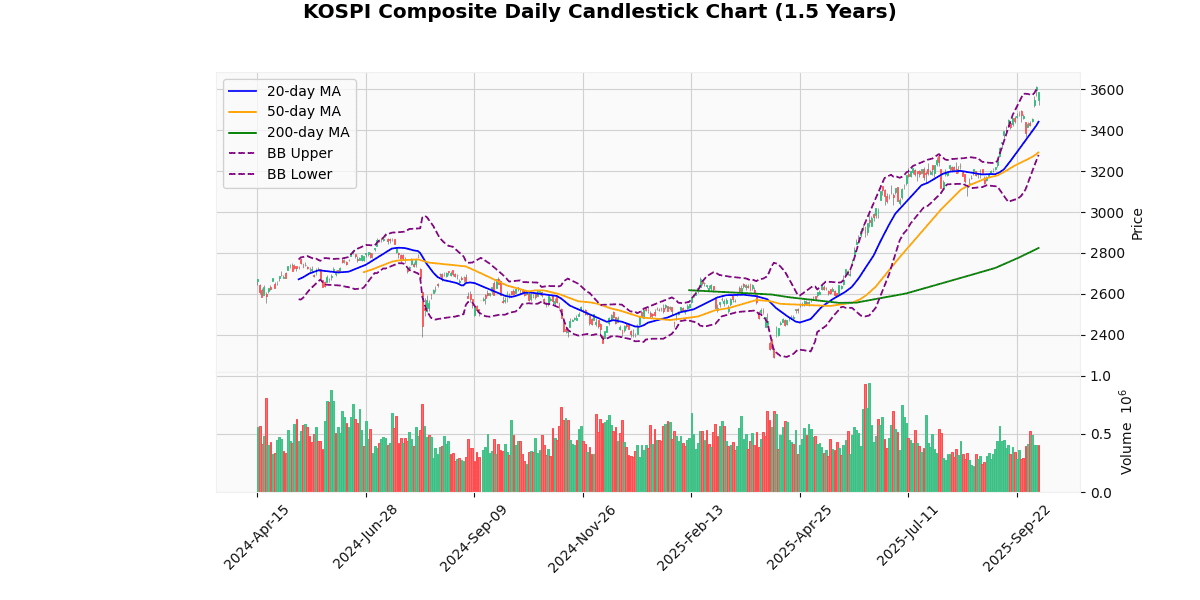
The KOSPI Composite Index is currently priced at 3584.55, experiencing a slight decline of 0.72% today. The index is trading near its upper Bollinger Band at 3604.01, indicating potential resistance, with the middle and lower bands at 3441.57 and 3279.12 respectively. This proximity to the upper band, combined with a high Relative Strength Index (RSI) of 70.27, suggests that the index may be entering overbought territory, which could lead to a pullback or stabilization in the short term.
The Moving Average Convergence Divergence (MACD) at 78.46, positioned above its signal line at 69.34, supports the ongoing bullish momentum. However, the close alignment and high values raise caution for potential overextension of the current trend.
The index’s moving averages (MA20 at 3441.57, MA50 at 3291.45, and MA200 at 2824.42) all indicate a strong upward trend, with the current price significantly above all three averages. This setup reinforces the bullish sentiment over the medium to long term.
The Average True Range (ATR) of 50.98 reflects moderate volatility, with recent trading ranges between the 3-day high of 3617.86 and low of 3512.16. The index’s proximity to its 52-week and year-to-date high at 3617.86 (only 0.92% below) suggests that it is testing critical resistance levels.
In summary, while the KOSPI Composite shows robust bullish signals across moving averages and MACD, the proximity to the upper Bollinger Band and a high RSI level indicate potential overbought conditions that could lead to short-term consolidation or a slight pullback. Investors should watch for any MACD crossovers or RSI movements below 70 as indicators for potential trend reversals or easing momentum.
Technical Metrics
| Metric | Value |
|---|---|
| Current Price | 3584.55 |
| Today’s Change (%) | -0.72 |
| 20-day MA | 3441.57 |
| % from 20-day MA | 4.15 |
| 50-day MA | 3291.45 |
| % from 50-day MA | 8.90 |
| 200-day MA | 2824.42 |
| % from 200-day MA | 26.91 |
| Bollinger Upper | 3604.01 |
| % from BB Upper | -0.54 |
| Bollinger Lower | 3279.12 |
| % from BB Lower | 9.31 |
| RSI (14) | 70.27 |
| MACD | 78.46 |
| MACD Signal | 69.34 |
| 3-day High | 3617.86 |
| % from 3-day High | -0.92 |
| 3-day Low | 3512.16 |
| % from 3-day Low | 2.06 |
| 52-week High | 3617.86 |
| % from 52-week High | -0.92 |
| 52-week Low | 2284.72 |
| % from 52-week Low | 56.89 |
| YTD High | 3617.86 |
| % from YTD High | -0.92 |
| YTD Low | 2284.72 |
| % from YTD Low | 56.89 |
| ATR (14) | 50.98 |
The technical outlook for the KOSPI Composite Index suggests a bullish trend, as evidenced by its current price of 3584.55, which is well above its 20-day, 50-day, and 200-day moving averages of 3441.57, 3291.45, and 2824.42 respectively. This indicates sustained upward momentum over both short and long-term periods.
The index is trading near the upper Bollinger Band at 3604.01, hinting at potential overbought conditions, which is corroborated by a relatively high RSI of 70.27. However, the MACD at 78.46 above its signal line at 69.34 supports the continuation of the bullish trend, suggesting that there might still be some upward potential despite the near overbought status.
Volatility, as measured by the ATR at 50.98, remains moderate, indicating that the recent price movements are not excessively erratic but are within a normal range.
Potential resistance is seen near the recent 52-week high at 3617.86, which the index approached but has slightly retreated from. Immediate support might be found around the lower Bollinger Band at 3279.12, though more significant support could be expected near the 20-day moving average at 3441.57.
Overall, market sentiment appears positive, but caution is warranted near current levels due to the proximity to historical highs and the RSI nearing overbought territory. Investors should watch for any signs of reversal or consolidation in the near term.
STI Technical Analysis
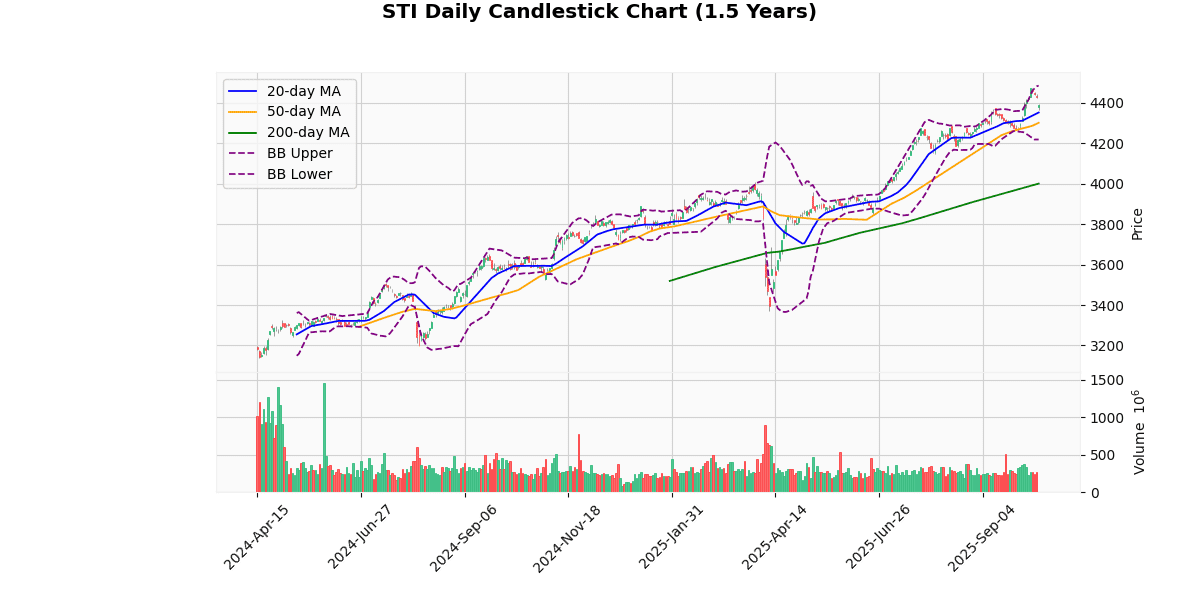
The STI index is currently priced at 4387.45, marking a slight decrease of 0.89% today. This price is above its 20-day (4350.64), 50-day (4299.91), and significantly above the 200-day moving averages (3999.6), indicating a strong upward trend in the medium to long term. The index is positioned between the middle and upper Bollinger Bands, suggesting moderate volatility with the upper band at 4483.53 and the lower band at 4217.76.
The Relative Strength Index (RSI) stands at 57.18, which is neither in the overbought nor oversold territory, indicating a balanced level of price momentum. The Moving Average Convergence Divergence (MACD) is at 40.03, above its signal line at 34.26, which is a bullish signal suggesting that the upward momentum might continue in the short term.
The index’s price is currently closer to its 3-day low of 4362.4 than its 3-day high of 4453.63, suggesting some recent pullback from higher levels. The index is also near its 52-week and year-to-date high of 4474.12, indicating that it is testing resistance levels that could define further movements.
The Average True Range (ATR) of 32.26 points to a moderate level of intraday volatility. Given the current metrics, the STI appears to be in a generally bullish phase but is approaching significant resistance levels. Investors should watch for potential pullbacks or consolidations, especially if the index fails to breach the recent highs. The MACD and RSI provide some bullish signals, but caution is warranted near these high levels.
Technical Metrics
| Metric | Value |
|---|---|
| Current Price | 4387.45 |
| Today’s Change (%) | -0.89 |
| 20-day MA | 4350.64 |
| % from 20-day MA | 0.85 |
| 50-day MA | 4299.91 |
| % from 50-day MA | 2.04 |
| 200-day MA | 3999.60 |
| % from 200-day MA | 9.70 |
| Bollinger Upper | 4483.53 |
| % from BB Upper | -2.14 |
| Bollinger Lower | 4217.76 |
| % from BB Lower | 4.02 |
| RSI (14) | 57.18 |
| MACD | 40.03 |
| MACD Signal | 34.26 |
| 3-day High | 4453.63 |
| % from 3-day High | -1.49 |
| 3-day Low | 4362.40 |
| % from 3-day Low | 0.57 |
| 52-week High | 4474.12 |
| % from 52-week High | -1.94 |
| 52-week Low | 3372.38 |
| % from 52-week Low | 30.10 |
| YTD High | 4474.12 |
| % from YTD High | -1.94 |
| YTD Low | 3372.38 |
| % from YTD Low | 30.10 |
| ATR (14) | 32.26 |
The technical outlook for the STI index presents a moderately bullish sentiment as evidenced by its current price of 4387.45, which is above the key moving averages (MA20 at 4350.64, MA50 at 4299.91, and MA200 at 3999.6). This positioning indicates a sustained upward trend over short, medium, and long-term periods. The index is trading near the upper Bollinger Band (upper at 4483.53, middle at 4350.64), suggesting some level of overextension but still within the realm of a potential push towards the band’s upper limit.
The Relative Strength Index (RSI) at 57.18 shows neither overbought nor oversold conditions, supporting a continuation of the current trend without immediate reversal signals. The MACD value at 40.03 above its signal line at 34.26 further confirms bullish momentum.
Volatility, measured by the Average True Range (ATR) at 32.26, indicates moderate price fluctuations, aligning with the current stable yet positive market dynamics. Potential resistance is approaching at the recent 52-week high of 4474.12, while support might be found around the recent 3-day low of 4362.4.
Overall, the STI’s technical indicators suggest continued bullish behavior with careful watch on resistance near the 52-week high and potential pullbacks that could test lower support levels, particularly around the lower Bollinger Band at 4217.76. Market participants should monitor these levels for signs of either consolidation or a shift in momentum.


