Asian Indices Plunge, KOSPI Composite Leads Decline
Shanghai Composite Technical Analysis
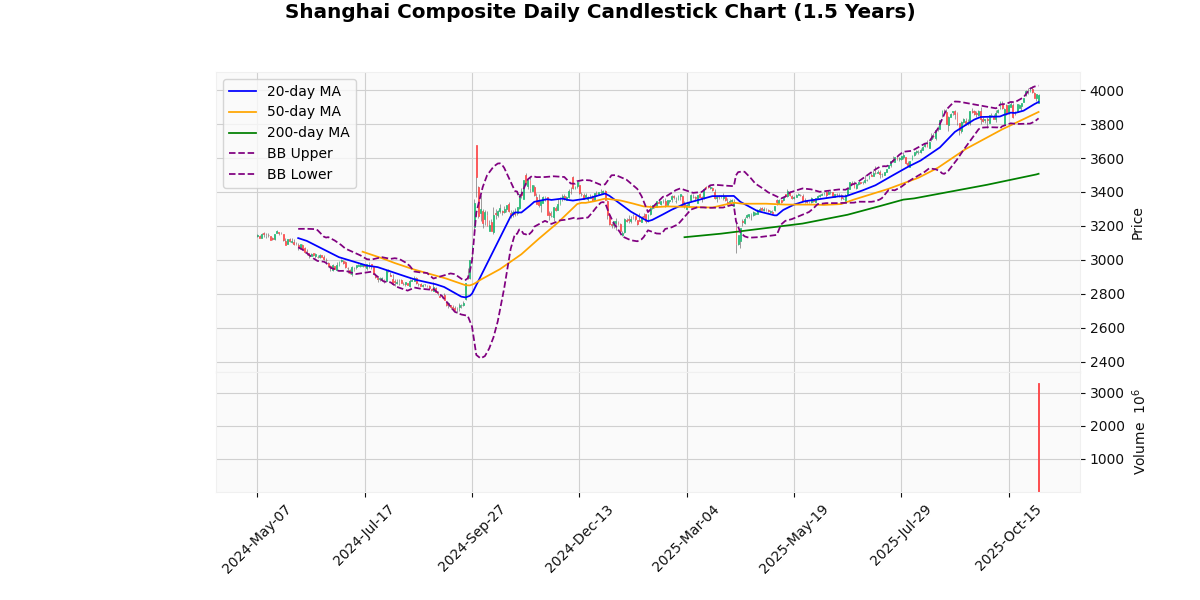
The Shanghai Composite Index is currently priced at 3973.06, reflecting a slight decrease of 0.09% today. This minor change indicates a relatively stable market condition for the day. The index is trading above all its key moving averages (20-day at 3929.81, 50-day at 3871.13, and 200-day at 3507.23), suggesting a strong bullish trend over the short to long term. The price is 1.1% above the 20-day MA and 13.28% above the 200-day MA, highlighting significant upward momentum over the past several months.
The Bollinger Bands show the current price nearing the upper band (4026.04), with the middle band aligning with the 20-day MA. This proximity to the upper band, combined with a relatively high RSI of 58.95, suggests that the market is leaning towards being overbought, though it has not crossed the typical overbought threshold of 70.
The MACD (38.2) is currently above its signal line (37.03), indicating a bullish momentum as it represents a recent positive crossover. This could suggest continuing upward price movement in the short term.
The index’s 3-day high is 3986.74, and the 3-day low is 3922.58, showing moderate volatility. The Average True Range (ATR) of 44.92 also supports this observation of moderate but not extreme volatility.
Year-to-date and 52-week metrics show the index has significantly rebounded from its lows (3040.69), with both the YTD and 52-week highs at 4025.71, which the index is currently approaching. This nearness to the yearly high could lead to resistance around this level.
In summary, the Shanghai Composite Index exhibits a strong bullish trend with potential resistance near the yearly highs. Investors should watch for any signs of reversal, especially if the RSI moves into overbought territory or if the MACD shows a bearish crossover. However, the current indicators suggest that the upward momentum may continue in the near term.
Technical Metrics
| Metric | Value |
|---|---|
| Current Price | 3973.06 |
| Today’s Change (%) | -0.09 |
| 20-day MA | 3929.81 |
| % from 20-day MA | 1.10 |
| 50-day MA | 3871.13 |
| % from 50-day MA | 2.63 |
| 200-day MA | 3507.23 |
| % from 200-day MA | 13.28 |
| Bollinger Upper | 4026.04 |
| % from BB Upper | -1.32 |
| Bollinger Lower | 3833.58 |
| % from BB Lower | 3.64 |
| RSI (14) | 58.95 |
| MACD | 38.20 |
| MACD Signal | 37.03 |
| 3-day High | 3986.74 |
| % from 3-day High | -0.34 |
| 3-day Low | 3922.58 |
| % from 3-day Low | 1.29 |
| 52-week High | 4025.71 |
| % from 52-week High | -1.31 |
| 52-week Low | 3040.69 |
| % from 52-week Low | 30.66 |
| YTD High | 4025.71 |
| % from YTD High | -1.31 |
| YTD Low | 3040.69 |
| % from YTD Low | 30.66 |
| ATR (14) | 44.92 |
The Shanghai Composite Index exhibits a moderately bullish technical outlook as it trades above its key moving averages (20-day, 50-day, and 200-day), suggesting a strong upward trend over both short and long-term periods. The current price of 3973.06 is above the 20-day MA of 3929.81 and significantly higher than the 200-day MA of 3507.23, reinforcing the bullish sentiment.
The Bollinger Bands indicate that the index is nearing the upper band at 4026.04, which may act as a resistance level. The proximity to the upper band, combined with a slight retreat from the 52-week high of 4025.71, suggests potential resistance near these levels. The lower Bollinger Band at 3833.58 could serve as a strong support level in case of a pullback.
RSI at 58.95 points to neither overbought nor oversold conditions, supporting a stable outlook. The MACD above its signal line further confirms bullish momentum. However, the ATR of 44.92 indicates moderate volatility, suggesting that while the trend is upward, significant price swings are possible.
In summary, the Shanghai Composite’s position above crucial moving averages, combined with healthy momentum indicators and moderate volatility, points to a continued positive trend. Investors should watch for resistance around the 4025-4026 area and potential support near the 3833 level, keeping an eye on volatility and market sentiment shifts.
Hang Seng Technical Analysis
The Hang Seng Index is currently trading at 25,887.87, marking a 1.03% decline today. The index is positioned below its 20-day (26,100.94) and 50-day (26,071.93) moving averages, suggesting a short-term bearish trend. However, it remains well above the 200-day moving average of 23,897.75, indicating a longer-term bullish outlook.
The Bollinger Bands show the index near the lower band (25,265.12), which could suggest a potential rebound if it behaves according to typical range-bound strategies. However, the relatively wide spread between the upper (26,936.76) and lower bands indicates high current volatility.
The Relative Strength Index (RSI) at 46.8 does not signal extreme conditions, sitting near the neutral 50 mark, suggesting neither overbought nor oversold conditions. The Moving Average Convergence Divergence (MACD) at -24.4, with its signal line at -9.87, indicates bearish momentum as the MACD remains below its signal line.
The index’s current price is closer to the 3-day low of 25,496.13 than the 3-day high of 26,283.96, aligning with the short-term downward trend. The index’s performance relative to its 52-week and YTD highs and lows shows significant recovery from the lows but a recent pullback from the highs.
The Average True Range (ATR) of 452.51 points to high volatility, which could mean larger price swings are likely in the near term.
In summary, the Hang Seng Index exhibits bearish signals in the short term with potential for volatility, as indicated by its position relative to moving averages, Bollinger Bands, and MACD. However, the long-term bullish trend indicated by the position above the 200-day moving average and the significant recovery from yearly lows suggests underlying strength. Investors should watch for potential stabilization or reversal signals near the lower Bollinger Band and changes in MACD and RSI for more immediate trading cues.
Technical Metrics
| Metric | Value |
|---|---|
| Current Price | 25887.87 |
| Today’s Change (%) | -1.03 |
| 20-day MA | 26100.94 |
| % from 20-day MA | -0.82 |
| 50-day MA | 26071.93 |
| % from 50-day MA | -0.71 |
| 200-day MA | 23897.75 |
| % from 200-day MA | 8.33 |
| Bollinger Upper | 26936.76 |
| % from BB Upper | -3.89 |
| Bollinger Lower | 25265.12 |
| % from BB Lower | 2.46 |
| RSI (14) | 46.80 |
| MACD | -24.40 |
| MACD Signal | -9.87 |
| 3-day High | 26283.96 |
| % from 3-day High | -1.51 |
| 3-day Low | 25496.13 |
| % from 3-day Low | 1.54 |
| 52-week High | 27381.84 |
| % from 52-week High | -5.46 |
| 52-week Low | 18671.49 |
| % from 52-week Low | 38.65 |
| YTD High | 27381.84 |
| % from YTD High | -5.46 |
| YTD Low | 18671.49 |
| % from YTD Low | 38.65 |
| ATR (14) | 452.51 |
The technical outlook for the Hang Seng Index suggests a cautious approach as the index currently trades below its 20-day and 50-day moving averages (MA20 at 26100.94 and MA50 at 26071.93), indicating a short-term bearish sentiment. However, it remains well above the 200-day moving average (MA200 at 23897.75), reflecting a longer-term bullish trend.
The index’s position near the lower Bollinger Band (25265.12) and a Relative Strength Index (RSI) of 46.8 suggest that it is neither in an oversold nor overbought territory, but it is leaning towards potential undervaluation. The negative MACD value (-24.4) below its signal line (-9.87) further supports the bearish momentum in the short term.
Volatility, as indicated by the Average True Range (ATR) of 452.51, remains relatively high, suggesting that significant price movements could still occur. Current support and resistance levels are identified near the recent three-day low (25496.13) and high (26283.96), respectively.
Given these factors, investors might remain watchful for signs of stabilization or a reversal before making significant commitments. The market sentiment appears mixed, with short-term indicators leaning bearish while the long-term trend remains positive.
Nikkei 225 Technical Analysis
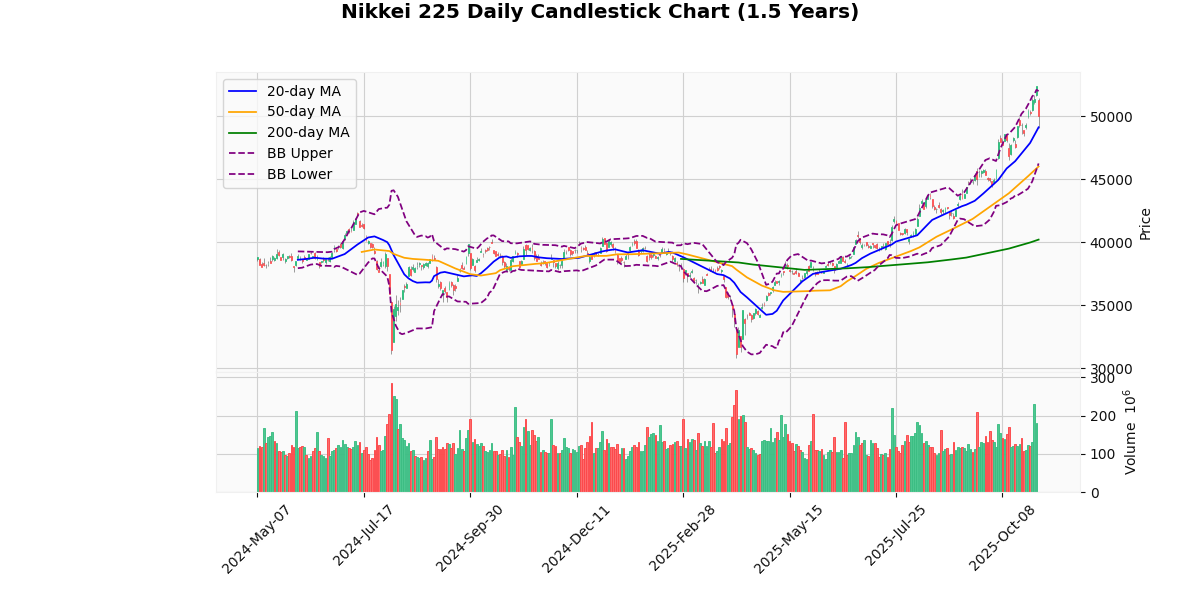
The Nikkei 225 index is currently priced at 50,005.76, reflecting a slight decline of 4.59% from its recent peak. This decline places the index just below its 3-day high of 52,411.34 and significantly above its 3-day low of 49,073.58, indicating recent volatility.
The index’s moving averages suggest a strong bullish trend, with the current price well above the 20-day (49,110.61), 50-day (46,007.06), and 200-day (40,207.17) moving averages. This pattern highlights sustained upward momentum over the short, medium, and long term. The price is also positioned between the middle and upper Bollinger Bands (BB), with the upper BB at 51,977.91 and the lower BB at 46,243.31, suggesting that while the price is in the higher range, it is not in an extreme position.
The Relative Strength Index (RSI) at 58.19 indicates that the market is neither overbought nor oversold, supporting a continuation of the current trend without immediate reversal signals. The Moving Average Convergence Divergence (MACD) at 1501.65, above its signal line at 1412.08, confirms the bullish momentum, as this setup typically suggests buying opportunities.
The Average True Range (ATR) at 1033.19 points to high volatility, consistent with the significant daily price movements and the recent highs and lows.
In summary, the Nikkei 225 shows a robust bullish trend with sustained positive momentum as indicated by its position relative to moving averages and MACD. However, the proximity to the recent high and the high ATR suggest that traders should be cautious of potential volatility and price retracements. The current setup favors bullish strategies, but with an awareness of potential pullbacks or corrections given the recent peak and inherent market volatility.
Technical Metrics
| Metric | Value |
|---|---|
| Current Price | 50005.76 |
| Today’s Change (%) | -4.59 |
| 20-day MA | 49110.61 |
| % from 20-day MA | 1.82 |
| 50-day MA | 46007.06 |
| % from 50-day MA | 8.69 |
| 200-day MA | 40207.17 |
| % from 200-day MA | 24.37 |
| Bollinger Upper | 51977.91 |
| % from BB Upper | -3.79 |
| Bollinger Lower | 46243.31 |
| % from BB Lower | 8.14 |
| RSI (14) | 58.19 |
| MACD | 1501.65 |
| MACD Signal | 1412.08 |
| 3-day High | 52411.34 |
| % from 3-day High | -4.59 |
| 3-day Low | 49073.58 |
| % from 3-day Low | 1.90 |
| 52-week High | 52411.34 |
| % from 52-week High | -4.59 |
| 52-week Low | 30792.74 |
| % from 52-week Low | 62.39 |
| YTD High | 52411.34 |
| % from YTD High | -4.59 |
| YTD Low | 30792.74 |
| % from YTD Low | 62.39 |
| ATR (14) | 1033.19 |
The technical outlook for the Nikkei 225 index suggests a bullish trend, as evidenced by its current price of 50,005.76, which is above all key moving averages (MA20 at 49,110.61, MA50 at 46,007.06, and MA200 at 40,207.17). This positioning above the moving averages indicates a strong upward momentum over short, medium, and long-term periods.
The index is currently trading near the upper Bollinger Band (51,977.91), though it has recently pulled back slightly as indicated by today’s minor decrease of 4.59 points. This proximity to the upper band, coupled with a Relative Strength Index (RSI) of 58.19, suggests that the market is in a moderately overbought territory but not excessively so, which could support further gains unless the index moves sharply towards overbought conditions (RSI above 70).
The MACD value at 1501.65, above its signal line at 1412.08, reinforces the bullish sentiment, indicating ongoing buying momentum. The Average True Range (ATR) of 1033.19 points to high volatility, which is typical for indices at all-time highs and should be considered for risk management.
Potential resistance can be anticipated near the recent 52-week and YTD high at 52,411.34, while support might be found around the 3-day low of 49,073.58. Given the current market sentiment and technical indicators, the Nikkei 225 appears poised to test its recent highs, assuming no significant bearish reversal occurs.
KOSPI Composite Technical Analysis
The KOSPI Composite Index currently stands at 3983.52, reflecting a slight decline of 5.65 points today. This movement is within a broader context of significant growth, as evidenced by its current position relative to its moving averages: it is 3.79% above the 20-day moving average (MA20) of 3838.0, 13.22% above the 50-day moving average (MA50) of 3518.31, and 35.42% above the 200-day moving average (MA200) of 2941.54. These figures indicate a strong bullish trend over the short, medium, and long term.
The Bollinger Bands show the index recently reaching the upper band at 4266.45, which aligns with the 52-week and year-to-date high of 4221.92, suggesting a potential overbought condition. However, the index has retracted slightly, now positioned closer to the middle band (MA20). The width between the bands, combined with an Average True Range (ATR) of 94.67, points to high volatility.
The Relative Strength Index (RSI) at 61.84 is in the upper range of the neutral zone, edging towards overbought territory but not yet signaling a strong reversal risk. The Moving Average Convergence Divergence (MACD) at 175.6 with a signal of 163.64 indicates continued bullish momentum, as the MACD remains above its signal line.
Considering the recent highs and lows, the index has shown resilience by staying above the 3-day low of 3867.81 and maintaining a robust year-to-date gain of 74.35% from its low at 2284.72.
**Conclusion:**
The KOSPI Composite Index exhibits strong bullish signals across several indicators, though the proximity to its recent highs and upper Bollinger Band suggests caution for potential pullbacks. Investors should watch for any MACD crossovers or significant RSI shifts that might indicate a change in momentum. The current volatility highlighted by the ATR also suggests that there could be substantial price movements in the near term, warranting close monitoring for trading opportunities.
Technical Metrics
| Metric | Value |
|---|---|
| Current Price | 3983.52 |
| Today’s Change (%) | -5.65 |
| 20-day MA | 3838.00 |
| % from 20-day MA | 3.79 |
| 50-day MA | 3518.31 |
| % from 50-day MA | 13.22 |
| 200-day MA | 2941.54 |
| % from 200-day MA | 35.42 |
| Bollinger Upper | 4266.45 |
| % from BB Upper | -6.63 |
| Bollinger Lower | 3409.55 |
| % from BB Lower | 16.83 |
| RSI (14) | 61.84 |
| MACD | 175.60 |
| MACD Signal | 163.64 |
| 3-day High | 4221.92 |
| % from 3-day High | -5.65 |
| 3-day Low | 3867.81 |
| % from 3-day Low | 2.99 |
| 52-week High | 4221.92 |
| % from 52-week High | -5.65 |
| 52-week Low | 2284.72 |
| % from 52-week Low | 74.35 |
| YTD High | 4221.92 |
| % from YTD High | -5.65 |
| YTD Low | 2284.72 |
| % from YTD Low | 74.35 |
| ATR (14) | 94.67 |
The technical outlook for the KOSPI Composite Index suggests a generally bullish trend, underpinned by its current price of 3983.52, which is significantly above its 20-day (3838.0), 50-day (3518.31), and 200-day (2941.54) moving averages. This indicates a strong upward momentum over short, medium, and long-term periods.
The index’s positioning between the upper and middle Bollinger Bands, despite a recent pullback from the upper band at 4266.45, supports the presence of ongoing bullish sentiment. However, the proximity to the upper band also suggests potential overbought conditions which might lead to short-term corrections.
The Relative Strength Index (RSI) at 61.84, though high, is not yet in the overbought territory (above 70), providing room for further upside before any significant reversal in trend. The MACD value at 175.6, above its signal line at 163.64, reinforces the bullish momentum.
Volatility, as indicated by an ATR of 94.67, remains relatively high, suggesting that significant price movements can be expected. This is further evidenced by the recent swings between the 3-day high of 4221.92 and low of 3867.81.
Key support and resistance levels to watch are the recent 3-day low at 3867.81 and the 52-week high at 4221.92, respectively. A break beyond these levels could indicate further directional movement.
Overall, market sentiment appears positive with a watchful eye on potential volatility and price corrections due to the index’s current high standing relative to its moving averages and Bollinger Bands.
STI Technical Analysis
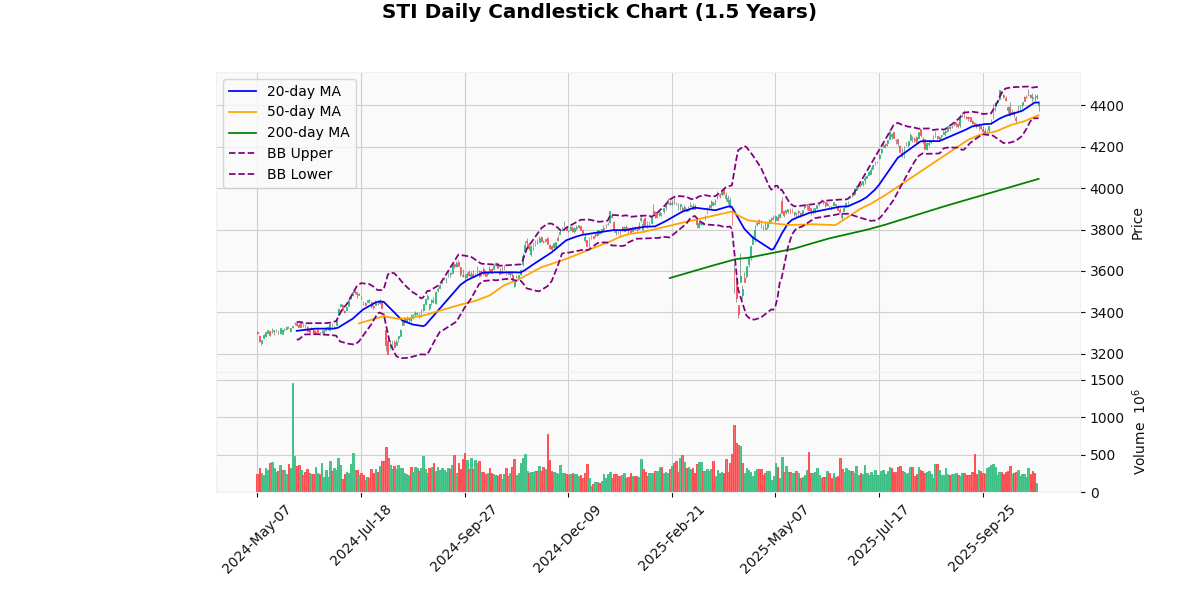
The STI (Straits Times Index) is currently priced at 4408.45, experiencing a slight decrease of 0.81% today. This minor decline positions the index just below its 20-day moving average (MA20) of 4412.86, indicating a potential short-term consolidation phase. However, the index remains well above both its 50-day (MA50) at 4351.16 and 200-day (MA200) moving averages at 4044.35, suggesting a robust longer-term uptrend.
The Bollinger Bands show the upper band at 4488.73 and the lower band at 4336.99, with the index trading near the middle band (MA20). This proximity to the middle band, coupled with a relatively narrow band width, suggests a lack of strong volatility. The current Relative Strength Index (RSI) of 53.27 indicates a neutral market momentum, neither overbought nor oversold.
The Moving Average Convergence Divergence (MACD) at 24.55, with its signal line at 26.31, is nearing a bearish crossover as the MACD approaches the signal line from above. This could suggest a potential slowdown in the bullish momentum if the crossover occurs.
The index is currently trading between its 3-day high of 4455.42 and 3-day low of 4372.64, showing moderate short-term fluctuations. The 52-week and year-to-date metrics reveal a significant range from a low of 3372.38 to a high of 4478.15, with the current price nearing the upper end of this range, underscoring a strong annual performance.
The Average True Range (ATR) of 36.02 points to a moderate level of recent daily volatility, which aligns with the observed price movements within the Bollinger Bands.
In summary, the STI is exhibiting signs of a stable but strong upward trend over the long term, with potential short-term consolidation or slight pullback as indicated by the proximity to the MA20 and the potential MACD bearish crossover. Investors should watch for these MACD and RSI signals closely to gauge the next directional move.
Technical Metrics
| Metric | Value |
|---|---|
| Current Price | 4408.45 |
| Today’s Change (%) | -0.81 |
| 20-day MA | 4412.86 |
| % from 20-day MA | -0.10 |
| 50-day MA | 4351.16 |
| % from 50-day MA | 1.32 |
| 200-day MA | 4044.35 |
| % from 200-day MA | 9.00 |
| Bollinger Upper | 4488.73 |
| % from BB Upper | -1.79 |
| Bollinger Lower | 4336.99 |
| % from BB Lower | 1.65 |
| RSI (14) | 53.27 |
| MACD | 24.55 |
| MACD Signal | 26.31 |
| 3-day High | 4455.42 |
| % from 3-day High | -1.05 |
| 3-day Low | 4372.64 |
| % from 3-day Low | 0.82 |
| 52-week High | 4478.15 |
| % from 52-week High | -1.56 |
| 52-week Low | 3372.38 |
| % from 52-week Low | 30.72 |
| YTD High | 4478.15 |
| % from YTD High | -1.56 |
| YTD Low | 3372.38 |
| % from YTD Low | 30.72 |
| ATR (14) | 36.02 |
The technical outlook for the STI index suggests a relatively balanced market environment, with the current price of 4408.45 hovering near the 20-day moving average (MA20) of 4412.86 and slightly above the 50-day (MA50) and 200-day (MA200) moving averages, indicating a positive medium to long-term trend. The index is positioned just below the middle Bollinger Band (4412.86), with recent prices fluctuating between the upper (4488.73) and lower (4336.99) bands, suggesting moderate volatility.
The Relative Strength Index (RSI) at 53.27 points to a neither overbought nor oversold condition, supporting a stable market sentiment. However, the Moving Average Convergence Divergence (MACD) at 24.55, being below its signal line (26.31), hints at potential short-term bearish momentum.
The Average True Range (ATR) of 36.02 indicates a reasonable level of recent daily volatility, aligning with the observed price fluctuations within the Bollinger Bands. Key support and resistance levels are identified at the recent 3-day low of 4372.64 and the 3-day high of 4455.42, respectively. Additional resistance is near the 52-week high of 4478.15.
Overall, the STI’s technical indicators suggest a cautiously optimistic outlook, with potential for continued near-term stability, but investors should watch for shifts in MACD and RSI for early signs of momentum changes.


