Asian Indices Surge, KOSPI Composite Leads Gains
Shanghai Composite Technical Analysis
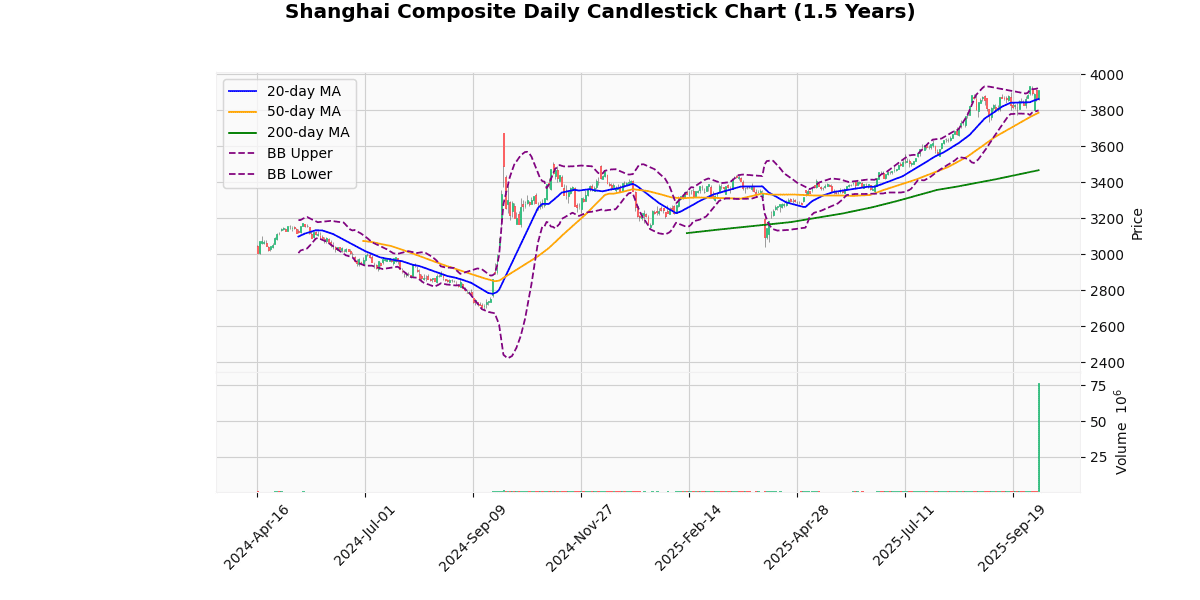
The Shanghai Composite Index is currently trading at 3912.21, marking a 1.22% increase today. This places the index near its upper Bollinger Band (3924.74) and just below its recent 3-day high of 3918.44. The proximity to the upper Bollinger Band and the 3-day high suggests a potential resistance level around 3920-3930.
The index’s moving averages indicate a bullish trend, with the current price above the 20-day (3861.86), 50-day (3785.76), and 200-day (3466.34) moving averages. The significant gap between the current price and the 200-day moving average (+12.86%) highlights strong medium to long-term bullish momentum.
The Relative Strength Index (RSI) at 60.48 is in the upper range of the neutral zone, edging towards overbought territory but not yet signaling a strong reversal risk. This suggests that there is still some room for upward movement before the market becomes technically overbought.
The Moving Average Convergence Divergence (MACD) at 30.29 with a signal line at 31.13 indicates a recent bearish crossover as the MACD falls below the signal line. This could suggest a potential slowdown in the bullish momentum or a short-term pullback.
The Average True Range (ATR) of 50.58 points to moderate volatility, aligning with the index’s recent fluctuations between its 3-day high and low.
Considering these factors, the Shanghai Composite appears to be in a strong bullish phase but approaching levels where traders might expect some resistance and potential consolidation. The nearness to the upper Bollinger Band and the slight bearish signal from the MACD warrant caution for those looking for entry points, suggesting that watching for a confirmed breakout above the recent highs or a pullback for a better buying opportunity could be prudent strategies.
Technical Metrics
| Metric | Value |
|---|---|
| Current Price | 3912.21 |
| Today’s Change (%) | 1.22 |
| 20-day MA | 3861.86 |
| % from 20-day MA | 1.30 |
| 50-day MA | 3785.76 |
| % from 50-day MA | 3.34 |
| 200-day MA | 3466.34 |
| % from 200-day MA | 12.86 |
| Bollinger Upper | 3924.74 |
| % from BB Upper | -0.32 |
| Bollinger Lower | 3798.99 |
| % from BB Lower | 2.98 |
| RSI (14) | 60.48 |
| MACD | 30.29 |
| MACD Signal | 31.13 |
| 3-day High | 3918.44 |
| % from 3-day High | -0.16 |
| 3-day Low | 3800.10 |
| % from 3-day Low | 2.95 |
| 52-week High | 3936.58 |
| % from 52-week High | -0.62 |
| 52-week Low | 2889.01 |
| % from 52-week Low | 35.42 |
| YTD High | 3936.58 |
| % from YTD High | -0.62 |
| YTD Low | 3040.69 |
| % from YTD Low | 28.66 |
| ATR (14) | 50.58 |
The Shanghai Composite Index presents a bullish technical outlook as it trades above its key moving averages (20-day, 50-day, and 200-day), indicating a strong upward trend over short, medium, and long-term periods. The index is currently positioned near the upper Bollinger Band, suggesting it is approaching overbought territory, but not excessively so. This is corroborated by an RSI of 60.48, which is moderately high but still below the typical overbought threshold of 70.
The MACD is slightly below its signal line, indicating a potential slowdown in momentum, but the difference is minimal, suggesting that any bearish reversal might be mild or short-lived. The Average True Range (ATR) of 50.58 points to moderate volatility, which is consistent with the index’s recent price movements.
Looking at potential support and resistance levels, immediate resistance can be seen near the 52-week and year-to-date high of 3936.58. A break above this level could signal further bullish momentum. On the downside, immediate support is likely around the lower Bollinger Band at 3798.99, with more substantial support at the 20-day moving average of 3861.86.
Overall, market sentiment appears positive, with the index showing strength across various time frames and technical indicators. Investors should watch for any sustained movements beyond the noted resistance or support levels to adjust their market expectations and strategies accordingly.
Hang Seng Technical Analysis
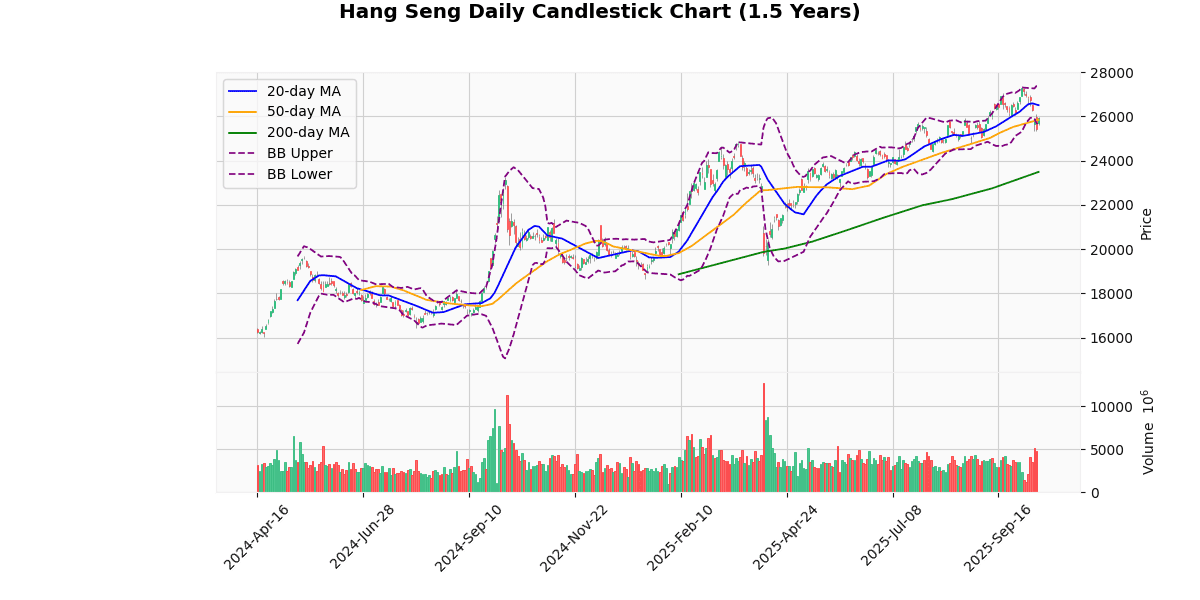
The Hang Seng Index is currently priced at 25,910.6, reflecting a modest increase of 1.84% today. This movement places the index below its 20-day moving average (MA20) of 26,502.48 but slightly above its 50-day moving average (MA50) of 25,845.05, indicating a potential consolidation phase. The index is well above its 200-day moving average (MA200) of 23,488.0, suggesting a longer-term upward trend.
The Bollinger Bands show the index trading near the lower band (25,620.17), which could indicate a potential rebound if it holds as a support level. The upper band at 27,384.8 remains a resistance point to watch.
The Relative Strength Index (RSI) at 45.64 does not indicate extreme conditions, suggesting that the index is neither overbought nor oversold. However, the Moving Average Convergence Divergence (MACD) at 55.52, significantly below its signal line at 225.37, suggests bearish momentum in the short term.
The index’s 3-day high is 26,102.68 and the 3-day low is 25,331.64, with the current price closer to the low, indicating recent downward pressure. The 52-week and YTD metrics show the index has rebounded significantly from its lows (18,671.49), but it is currently off its highs (27,381.84) by approximately 5.37%.
The Average True Range (ATR) at 473.55 points to a relatively high volatility, which could mean larger price swings and potentially more trading opportunities.
In summary, the Hang Seng Index shows a mixed technical outlook with a longer-term bullish trend but short-term bearish signals. Traders should watch for potential support at the lower Bollinger Band and any shifts in the MACD or RSI for signs of momentum changes.
Technical Metrics
| Metric | Value |
|---|---|
| Current Price | 25910.60 |
| Today’s Change (%) | 1.84 |
| 20-day MA | 26502.48 |
| % from 20-day MA | -2.23 |
| 50-day MA | 25845.05 |
| % from 50-day MA | 0.25 |
| 200-day MA | 23488.00 |
| % from 200-day MA | 10.31 |
| Bollinger Upper | 27384.80 |
| % from BB Upper | -5.38 |
| Bollinger Lower | 25620.17 |
| % from BB Lower | 1.13 |
| RSI (14) | 45.64 |
| MACD | 55.52 |
| MACD Signal | 225.37 |
| 3-day High | 26102.68 |
| % from 3-day High | -0.74 |
| 3-day Low | 25331.64 |
| % from 3-day Low | 2.29 |
| 52-week High | 27381.84 |
| % from 52-week High | -5.37 |
| 52-week Low | 18671.49 |
| % from 52-week Low | 38.77 |
| YTD High | 27381.84 |
| % from YTD High | -5.37 |
| YTD Low | 18671.49 |
| % from YTD Low | 38.77 |
| ATR (14) | 473.55 |
The technical outlook for the Hang Seng Index suggests a cautious stance, as the index is currently trading below its 20-day moving average (MA20) at 26,502.48 but slightly above its 50-day moving average (MA50) at 25,845.05. This positioning indicates a mixed short-term sentiment, with the index showing some resilience above the MA50 but struggling to regain momentum above the MA20.
The Bollinger Bands reveal that the index is trading near the lower band (25,620.17), suggesting that it might be approaching oversold territory. However, the Relative Strength Index (RSI) at 45.64 and the negative divergence between the MACD (55.52) and its signal line (225.37) indicate that there is still some bearish momentum, which could limit upward movements in the short term.
The Average True Range (ATR) of 473.55 points to a relatively high level of volatility, which could lead to significant price swings. This is further evidenced by the index’s recent fluctuations between its 3-day high and low.
Key support and resistance levels to watch are the recent 3-day low at 25,331.64 and the 20-day moving average at 26,502.48, respectively. A break below the support could see further declines towards the MA200 at 23,488.0, while a move above the resistance might signal a potential recovery towards the upper Bollinger Band at 27,384.8.
Overall, market sentiment appears cautious with a bearish tilt, suggesting that investors should be prepared for potential volatility and consider defensive strategies until clearer bullish signals emerge.
Nikkei 225 Technical Analysis
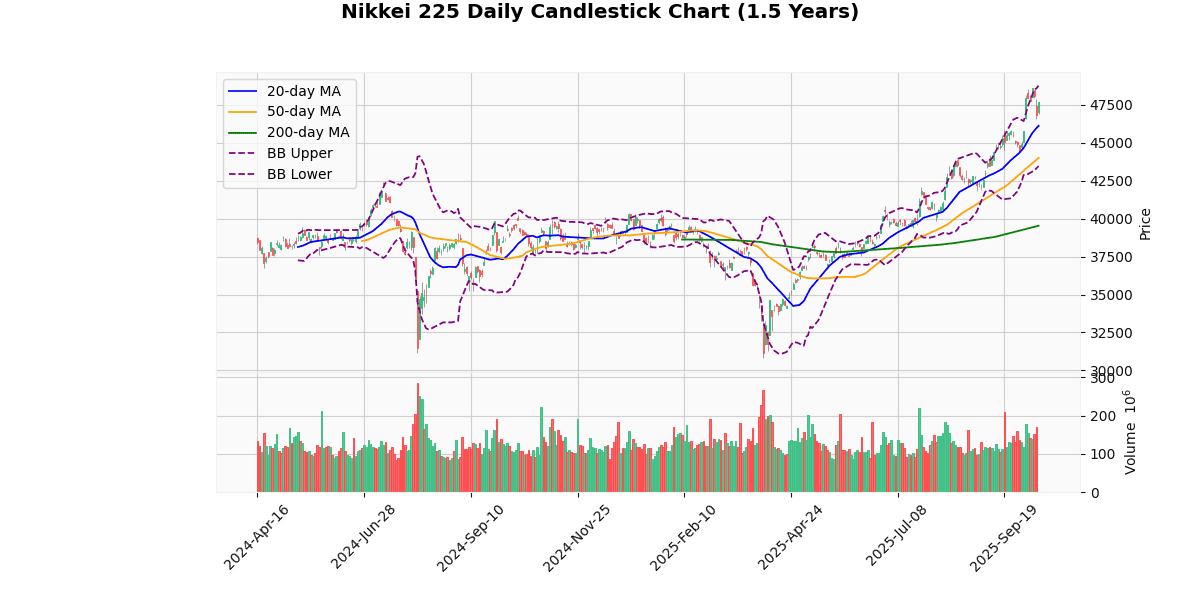
The Nikkei 225 index is currently priced at 47,672.67, marking a 1.76% increase today. This performance places the index above its 20-day (46,116.45), 50-day (44,008.9), and 200-day (39,533.44) moving averages, indicating a strong bullish trend over short, medium, and long-term periods. The price is 3.37%, 8.33%, and 20.59% higher than these averages, respectively, reinforcing the upward momentum.
The Bollinger Bands show the current price nearing the upper band (48,767.3), which suggests the market might be approaching overbought territory. However, with the price still below the upper band, there’s room for potential further upward movement before encountering major resistance. The lower band sits at 43,465.61, far below the current price, indicating strong support at lower levels.
The Relative Strength Index (RSI) at 63.98 is approaching the overbought threshold of 70 but is not there yet, suggesting that while the market is strong, it is not excessively so. The Moving Average Convergence Divergence (MACD) at 1145.28, above its signal line at 1059.94, confirms the bullish momentum with a positive crossover, indicating ongoing buying interest.
The index is currently close to its 52-week and year-to-date high of 48,597.08, showing only a 1.9% difference, which could act as a psychological resistance point. The 3-day high and low provide a narrower trading range with the current price closer to the high, suggesting recent days have maintained strong bullish sentiment.
The Average True Range (ATR) of 766.76 points to a relatively high volatility, which could mean larger price swings and potentially more trading opportunities but also higher risk.
Overall, the Nikkei 225 exhibits strong bullish signals across various indicators, but traders should be cautious of potential resistance near the 52-week high and watch for signs of reversal, especially if the RSI crosses into overbought territory or the MACD shows a bearish crossover.
Technical Metrics
| Metric | Value |
|---|---|
| Current Price | 47672.67 |
| Today’s Change (%) | 1.76 |
| 20-day MA | 46116.45 |
| % from 20-day MA | 3.37 |
| 50-day MA | 44008.90 |
| % from 50-day MA | 8.33 |
| 200-day MA | 39533.44 |
| % from 200-day MA | 20.59 |
| Bollinger Upper | 48767.30 |
| % from BB Upper | -2.24 |
| Bollinger Lower | 43465.61 |
| % from BB Lower | 9.68 |
| RSI (14) | 63.98 |
| MACD | 1145.28 |
| MACD Signal | 1059.94 |
| 3-day High | 48510.72 |
| % from 3-day High | -1.73 |
| 3-day Low | 46544.05 |
| % from 3-day Low | 2.42 |
| 52-week High | 48597.08 |
| % from 52-week High | -1.90 |
| 52-week Low | 30792.74 |
| % from 52-week Low | 54.82 |
| YTD High | 48597.08 |
| % from YTD High | -1.90 |
| YTD Low | 30792.74 |
| % from YTD Low | 54.82 |
| ATR (14) | 766.76 |
The Nikkei 225 index exhibits a strong bullish trend as indicated by its current price of 47,672.67, which is well above its 20-day, 50-day, and 200-day moving averages (MA20 at 46,116.45, MA50 at 44,008.9, and MA200 at 39,533.44 respectively). This positioning above all major moving averages suggests sustained upward momentum.
The index is currently trading near the upper Bollinger Band (upper at 48,767.3, middle at 46,116.45), indicating it is approaching overbought territory, though it remains below the band suggesting there is still room for upward movement. The Relative Strength Index (RSI) at 63.98 supports this, as it is below the typical overbought threshold of 70.
The MACD (1,145.28) above its signal line (1,059.94) reinforces the bullish sentiment, suggesting continued positive momentum. The Average True Range (ATR) of 766.76 points to high volatility, which could mean significant price movements ahead.
Key resistance can be anticipated near the recent 52-week and year-to-date high of 48,597.08, while support might be found around the lower Bollinger Band at 43,465.61. Given the index’s performance and technical indicators, market sentiment appears optimistic, though traders should watch for potential reversals or consolidations as the index approaches significant resistance levels.
KOSPI Composite Technical Analysis
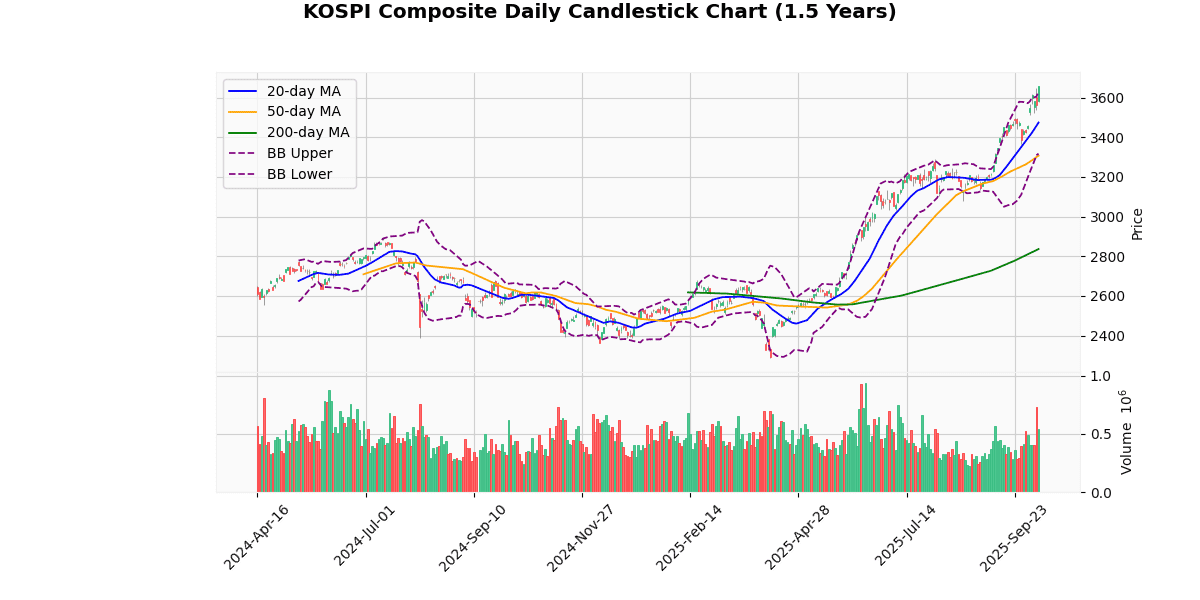
The KOSPI Composite Index currently stands at 3657.28, marking a modest increase of 2.68 points today. Analyzing its performance through various technical indicators provides insights into its current and potential future movements.
**Moving Averages**: The index is performing well above its 20-day (3473.79), 50-day (3307.03), and 200-day (2835.89) moving averages, indicating a strong bullish trend. The significant gaps between the current price and these averages highlight sustained positive momentum over short, medium, and long-term periods.
**Bollinger Bands**: The current price is above the upper Bollinger Band (3630.68), suggesting that the index might be in an overbought territory. This could potentially lead to a pullback if traders decide to take profits.
**RSI and MACD**: The Relative Strength Index (RSI) at 72.81 indicates that the index is currently overbought, which aligns with the signal from the Bollinger Bands. Meanwhile, the Moving Average Convergence Divergence (MACD) value at 85.62, being above its signal line (74.1), supports the strong bullish momentum. However, the elevated position of both RSI and MACD could signal caution for potential reversals.
**3-Day and 52-Week/YTD Metrics**: The index is just shy of its 3-day and 52-week/YTD high of 3659.91, indicating strong recent performance. The 3-day low at 3522.54 and the considerable percentage increase from the 52-week/YTD low (2284.72) further underscore the bullish trend.
**Average True Range (ATR)**: An ATR of 58.34 points to a relatively high level of volatility, which is typical in a vigorously trading market and should be considered by traders for potential price swings.
In summary, the KOSPI Composite is exhibiting robust bullish signals across most technical indicators. However, the overbought conditions suggested by the RSI and the position relative to the upper Bollinger Band might caution against potential short-term pullbacks. Investors should watch for any signs of reversal, especially if profit-taking begins, but the overall trend remains strongly positive.
Technical Metrics
| Metric | Value |
|---|---|
| Current Price | 3657.28 |
| Today’s Change (%) | 2.68 |
| 20-day MA | 3473.79 |
| % from 20-day MA | 5.28 |
| 50-day MA | 3307.03 |
| % from 50-day MA | 10.59 |
| 200-day MA | 2835.89 |
| % from 200-day MA | 28.96 |
| Bollinger Upper | 3630.68 |
| % from BB Upper | 0.73 |
| Bollinger Lower | 3316.90 |
| % from BB Lower | 10.26 |
| RSI (14) | 72.81 |
| MACD | 85.62 |
| MACD Signal | 74.10 |
| 3-day High | 3659.91 |
| % from 3-day High | -0.07 |
| 3-day Low | 3522.54 |
| % from 3-day Low | 3.83 |
| 52-week High | 3659.91 |
| % from 52-week High | -0.07 |
| 52-week Low | 2284.72 |
| % from 52-week Low | 60.08 |
| YTD High | 3659.91 |
| % from YTD High | -0.07 |
| YTD Low | 2284.72 |
| % from YTD Low | 60.08 |
| ATR (14) | 58.34 |
The technical outlook for the KOSPI Composite Index presents a bullish scenario as it currently trades above all key moving averages (MA20, MA50, MA200), indicating a strong upward trend over short, medium, and long-term periods. The index’s current price of 3657.28 is above the upper Bollinger Band (3630.68), suggesting that it might be in an overbought territory, which is also supported by a high Relative Strength Index (RSI) of 72.81.
The MACD (85.62) above its signal line (74.1) further confirms the bullish momentum, although the proximity to the 52-week and YTD highs (3659.91) could indicate potential resistance near these levels. The Average True Range (ATR) of 58.34 points to a relatively high volatility, which could lead to significant price movements in the near term.
Considering the current market sentiment and technical indicators, potential resistance might be tested again at the 52-week high, while support could be found around the upper Bollinger Band or the recent 3-day low of 3522.54. Investors should watch for any signs of reversal, especially if the index starts to retreat from its current highs, which could trigger profit-taking.
STI Technical Analysis
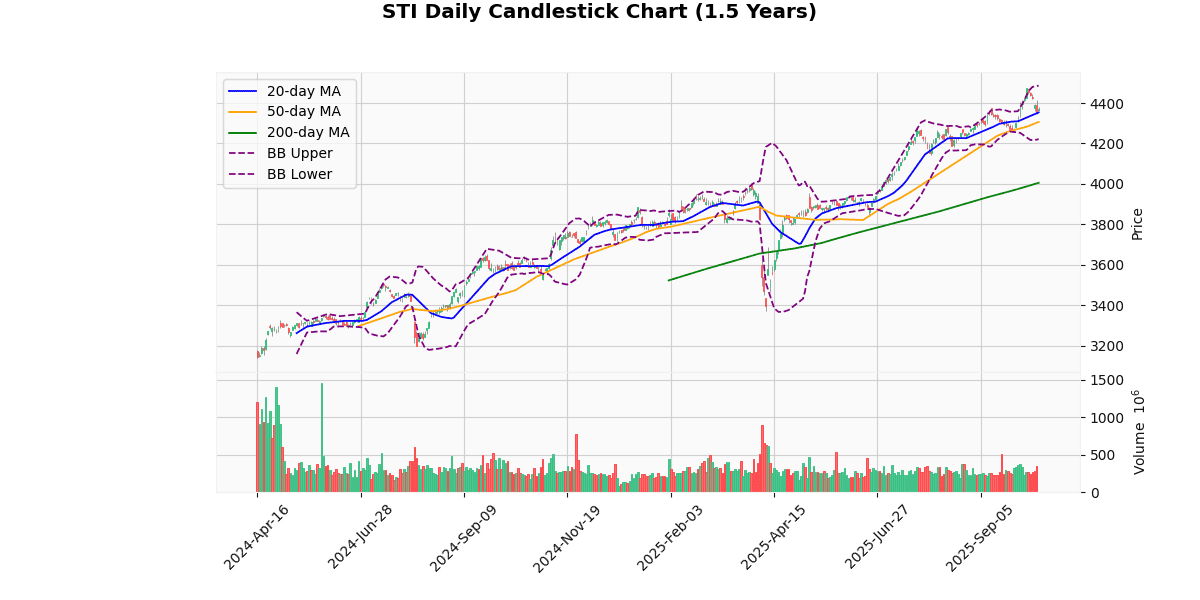
The Straits Times Index (STI) is currently priced at 4368.48, marking a modest daily increase of 0.32%. The index shows a positive trend as it is trading above its 20-day (4353.83), 50-day (4305.69), and 200-day (4005.39) moving averages, indicating a bullish sentiment in the medium to long term. The price is 0.34% above the 20-day MA and 1.46% above the 50-day MA, further underscoring this upward momentum.
The Bollinger Bands reveal that the STI is trading near the middle band (4353.83), with the current price slightly above it. The upper and lower bands are positioned at 4486.29 and 4221.38, respectively. The price is closer to the upper band, suggesting some level of overvaluation, but not excessively so, as it remains within the bands.
The Relative Strength Index (RSI) at 53.17 indicates neither overbought nor oversold conditions, supporting a stable market sentiment without immediate extremes. However, the Moving Average Convergence Divergence (MACD) at 30.22 is currently below its signal line (33.47), suggesting a potential bearish crossover that could indicate a slowdown or reversal in the upward trend if sustained.
The index’s Average True Range (ATR) of 34.35 points to moderate volatility. The proximity of the current price to its 3-day high (4417.24) and low (4346.01) also suggests recent stability in price movements.
Year-to-date and 52-week metrics show significant gains from the lows, with the current price up 29.54% from the YTD and 52-week lows, although it has pulled back slightly by 2.36% from the YTD and 52-week highs.
In summary, the STI exhibits a generally bullish trend with stable recent performance. Investors should monitor the MACD for potential bearish signals and consider the moderate volatility in their short-term strategies. The proximity to key moving averages and Bollinger Bands suggests that while the market is currently stable, vigilance for any shifts in these indicators is advisable.
Technical Metrics
| Metric | Value |
|---|---|
| Current Price | 4368.48 |
| Today’s Change (%) | 0.32 |
| 20-day MA | 4353.83 |
| % from 20-day MA | 0.34 |
| 50-day MA | 4305.69 |
| % from 50-day MA | 1.46 |
| 200-day MA | 4005.39 |
| % from 200-day MA | 9.07 |
| Bollinger Upper | 4486.29 |
| % from BB Upper | -2.63 |
| Bollinger Lower | 4221.38 |
| % from BB Lower | 3.48 |
| RSI (14) | 53.17 |
| MACD | 30.22 |
| MACD Signal | 33.47 |
| 3-day High | 4417.24 |
| % from 3-day High | -1.10 |
| 3-day Low | 4346.01 |
| % from 3-day Low | 0.52 |
| 52-week High | 4474.12 |
| % from 52-week High | -2.36 |
| 52-week Low | 3372.38 |
| % from 52-week Low | 29.54 |
| YTD High | 4474.12 |
| % from YTD High | -2.36 |
| YTD Low | 3372.38 |
| % from YTD Low | 29.54 |
| ATR (14) | 34.35 |
The technical outlook for the STI index presents a cautiously optimistic picture. Currently trading at 4368.48, the index is slightly above its 20-day moving average (MA20) of 4353.83 and well above its 50-day (MA50) and 200-day (MA200) moving averages, suggesting a positive trend in the medium to long term. The index’s position between the middle and upper Bollinger Bands indicates moderate bullish momentum, although it remains below the upper band at 4486.29, which could act as a resistance level.
The Relative Strength Index (RSI) at 53.17 points to a neither overbought nor oversold condition, supporting a stable market sentiment. However, the Moving Average Convergence Divergence (MACD) is slightly below its signal line, suggesting some bearish pressure could be emerging.
Volatility, as measured by the Average True Range (ATR) of 34.35, remains moderate, indicating that while there are fluctuations, they are not excessively volatile. The index’s proximity to its recent 3-day low at 4346.01 and its 52-week high at 4474.12 suggests that these levels could serve as short-term support and resistance, respectively.
Overall, market sentiment appears cautiously positive with a watchful eye on emerging bearish signals from the MACD. Investors might look for stability above the MA20 and potential resistance tests near the upper Bollinger Band or recent highs.


