Asian Indices Surge, KOSPI Composite Leads Gains
Shanghai Composite Technical Analysis
The Shanghai Composite Index is currently priced at 3976.52, reflecting a modest increase of 0.55% today. This performance indicates a positive trend as the index is positioned above all its key moving averages (20-day at 3924.28, 50-day at 3866.23, and 200-day at 3503.42), suggesting a strong bullish momentum over short, medium, and long-term periods.
The index is trading close to its upper Bollinger Band at 4022.62, which, combined with a recent 3-day high of 4025.71, points to potential resistance near these levels. The proximity to the upper Bollinger Band also suggests that the market might be approaching overbought territory, although the current RSI of 59.54 remains just below the typical overbought threshold of 70, indicating there might still be room for upward movement before the market becomes technically overbought.
The MACD value at 39.52, positioned above its signal line at 36.74, supports the bullish sentiment, showing a positive momentum as indicated by the MACD line being above the signal line. This is a bullish crossover signal, typically considered a buying opportunity.
The Average True Range (ATR) of 44.23 suggests moderate volatility, with recent price action between the 3-day high and low (4025.71 and 3937.02) confirming this level of market activity.
Considering the index’s performance relative to its 52-week and year-to-date highs and lows (both at 4025.71 and 3040.69 respectively), the index has shown significant recovery and strength this year, as highlighted by a 30.78% increase from the year’s low.
In summary, the Shanghai Composite Index exhibits a strong bullish trend with potential resistance near the recent highs. Investors should watch for any signs of reversal if the index approaches or surpasses its recent highs, while also monitoring the RSI for any move into overbought territory, which could signal a short-term pullback or consolidation.
Technical Metrics
| Metric | Value |
|---|---|
| Current Price | 3976.52 |
| Today’s Change (%) | 0.55 |
| 20-day MA | 3924.28 |
| % from 20-day MA | 1.33 |
| 50-day MA | 3866.23 |
| % from 50-day MA | 2.85 |
| 200-day MA | 3503.42 |
| % from 200-day MA | 13.50 |
| Bollinger Upper | 4022.62 |
| % from BB Upper | -1.15 |
| Bollinger Lower | 3825.95 |
| % from BB Lower | 3.94 |
| RSI (14) | 59.54 |
| MACD | 39.52 |
| MACD Signal | 36.74 |
| 3-day High | 4025.71 |
| % from 3-day High | -1.22 |
| 3-day Low | 3937.02 |
| % from 3-day Low | 1.00 |
| 52-week High | 4025.71 |
| % from 52-week High | -1.22 |
| 52-week Low | 3040.69 |
| % from 52-week Low | 30.78 |
| YTD High | 4025.71 |
| % from YTD High | -1.22 |
| YTD Low | 3040.69 |
| % from YTD Low | 30.78 |
| ATR (14) | 44.23 |
The Shanghai Composite Index currently exhibits a bullish technical outlook, as indicated by its performance relative to various moving averages and other technical indicators. The index’s current price of 3976.52 is above the 20-day (3924.28), 50-day (3866.23), and 200-day (3503.42) moving averages, suggesting a strong upward trend over short, medium, and long-term periods.
The Bollinger Bands show the index trading near the upper band (4022.62), which typically indicates a high level of price volatility and potential resistance near this upper limit. The proximity to the upper band, coupled with a recent high of 4025.71, suggests that the index might face resistance if it attempts to push beyond these levels.
The Relative Strength Index (RSI) at 59.54 and the MACD above its signal (39.52 vs. 36.74) both support the continuation of the current bullish momentum. However, the RSI is not yet in the overbought territory, which provides room for potential further upside before becoming excessively bought.
The Average True Range (ATR) of 44.23 points to moderate volatility, consistent with the index’s recent movements. Key support and resistance levels are identified at the recent three-day low of 3937.02 and the high of 4025.71, respectively.
Overall, market sentiment appears positive, with the index showing strength across multiple indicators. Investors should watch for potential resistance at the recent highs around 4025.71 and support at the lower Bollinger Band or recent lows if a pullback occurs.
Hang Seng Technical Analysis
The Hang Seng Index is currently priced at 26,158.36, showing a modest increase of 0.97% today. This places the index just slightly below its 20-day moving average (MA20) of 26,163.6, indicating a near-term equilibrium between buyers and sellers. The 50-day and 200-day moving averages are 26,056.26 and 23,863.63, respectively, suggesting a positive trend over the medium to long term, as the index is trading above these levels.
The Bollinger Bands show the upper band at 27,107.06 and the lower band at 25,220.13, with the index currently near the middle band. This positioning within the bands does not suggest any immediate extreme volatility, as the index is not challenging either band.
The Relative Strength Index (RSI) at 50.53 is neutral, indicating neither overbought nor oversold conditions, supporting a stable market sentiment in the short term. The Moving Average Convergence Divergence (MACD) is -6.36, with a signal line at -6.24, indicating a slight bearish momentum as the MACD is below the signal line. However, the proximity of these values suggests that any downward momentum might be losing strength.
The index’s 3-day high and low are 26,588.89 and 25,906.65, respectively, showing recent trading within a relatively narrow range, which is confirmed by the Average True Range (ATR) of 436.38, indicating moderate volatility.
Year-to-date and 52-week metrics show the index has rebounded significantly from its lows, with current prices up over 40% from the 52-week low of 18,671.49, yet still below the highs around 27,381.84 by about 4.47%.
Overall, the Hang Seng Index exhibits a stable yet cautious market environment with a slight bullish bias over the longer term, given its position above the longer-term moving averages. Investors should watch for any potential MACD crossover or significant shifts in RSI for stronger directional cues.
Technical Metrics
| Metric | Value |
|---|---|
| Current Price | 26158.36 |
| Today’s Change (%) | 0.97 |
| 20-day MA | 26163.60 |
| % from 20-day MA | -0.02 |
| 50-day MA | 26056.26 |
| % from 50-day MA | 0.39 |
| 200-day MA | 23863.63 |
| % from 200-day MA | 9.62 |
| Bollinger Upper | 27107.06 |
| % from BB Upper | -3.50 |
| Bollinger Lower | 25220.13 |
| % from BB Lower | 3.72 |
| RSI (14) | 50.53 |
| MACD | -6.36 |
| MACD Signal | -6.24 |
| 3-day High | 26588.89 |
| % from 3-day High | -1.62 |
| 3-day Low | 25906.65 |
| % from 3-day Low | 0.97 |
| 52-week High | 27381.84 |
| % from 52-week High | -4.47 |
| 52-week Low | 18671.49 |
| % from 52-week Low | 40.10 |
| YTD High | 27381.84 |
| % from YTD High | -4.47 |
| YTD Low | 18671.49 |
| % from YTD Low | 40.10 |
| ATR (14) | 436.38 |
The Hang Seng Index presents a mixed technical outlook as it hovers near its 20-day moving average (MA20) at 26,163.6, slightly below the current price of 26,158.36. This proximity to the MA20, along with the index being above its 50-day (MA50) and significantly above the 200-day moving averages (MA200), suggests a generally bullish mid to long-term trend but indicates short-term consolidation.
The Bollinger Bands show the index trading near the middle band, with a recent move towards the lower band, suggesting reduced volatility. However, the Average True Range (ATR) of 436.38 points to a relatively high volatility in recent trading sessions.
The Relative Strength Index (RSI) at 50.53 and the MACD slightly below its signal line (-6.36 vs. -6.24) indicate a lack of strong momentum, with the market neither overbought nor oversold.
Key support and resistance levels are evident with recent lows around 25,906.65 and highs near 26,588.89. The index’s performance against its 52-week high and low shows significant recovery from yearly lows but some resistance as it approaches yearly highs.
Overall, market sentiment appears cautiously optimistic with underlying volatility. Investors might look for stronger directional cues from global economic factors and local market developments. The technical indicators suggest a hold strategy with a watch on breaking either key support or resistance for new positions.
Nikkei 225 Technical Analysis
The Nikkei 225 index is currently experiencing a robust bullish trend, as evidenced by its current price of 52,411.34, which is a new 52-week and year-to-date high. This represents a significant increase of 70.21% from the year’s low of 30,792.74, indicating strong upward momentum.
Today’s price change of 2.12% further underscores the current bullish sentiment in the market. The index’s price is well above all key moving averages (20-day at 48,898.8, 50-day at 45,864.72, and 200-day at 40,155.17), with percentage differences of 7.18%, 14.27%, and 30.52% respectively, suggesting a sustained uptrend.
The Relative Strength Index (RSI) at 75.52 indicates that the index may be approaching overbought territory, which could signal a potential pullback or consolidation in the near term. However, the Moving Average Convergence Divergence (MACD) value of 1,621.9, above its signal line at 1,389.68, supports the continuation of the bullish trend.
The Bollinger Bands show the current price exceeding the upper band at 52,079.1, which typically suggests that the index is overextended to the upside and might revert to mean levels soon. The Average True Range (ATR) of 855.92 points to high volatility, aligning with the significant price movements observed.
Given these indicators, while the bullish momentum is strong, investors should be cautious of potential volatility and the chance of a short-term reversal due to the overbought RSI levels. The MACD and price above moving averages, however, still favor bullish outcomes in the medium term.
Technical Metrics
| Metric | Value |
|---|---|
| Current Price | 52411.34 |
| Today’s Change (%) | 2.12 |
| 20-day MA | 48898.80 |
| % from 20-day MA | 7.18 |
| 50-day MA | 45864.72 |
| % from 50-day MA | 14.27 |
| 200-day MA | 40155.17 |
| % from 200-day MA | 30.52 |
| Bollinger Upper | 52079.10 |
| % from BB Upper | 0.64 |
| Bollinger Lower | 45718.50 |
| % from BB Lower | 14.64 |
| RSI (14) | 75.52 |
| MACD | 1621.90 |
| MACD Signal | 1389.68 |
| 3-day High | 52411.34 |
| % from 3-day High | N/A |
| 3-day Low | 50365.62 |
| % from 3-day Low | 4.06 |
| 52-week High | 52411.34 |
| % from 52-week High | N/A |
| 52-week Low | 30792.74 |
| % from 52-week Low | 70.21 |
| YTD High | 52411.34 |
| % from YTD High | N/A |
| YTD Low | 30792.74 |
| % from YTD Low | 70.21 |
| ATR (14) | 855.92 |
The technical outlook for the Nikkei 225 index suggests a strong bullish momentum, as evidenced by its current price of 52,411.34, which is significantly above all key moving averages (MA20, MA50, MA200). This positioning indicates a sustained upward trend over the short, medium, and long term. The index is also trading just above the upper Bollinger Band, suggesting that it is at a potential resistance level, which could lead to a temporary pullback or consolidation.
The Relative Strength Index (RSI) at 75.52 signals that the market is currently overbought, which could precede a short-term reversal or correction in prices. Similarly, the MACD is well above its signal line, reinforcing the strong bullish sentiment but also hinting at possible overextension.
The Average True Range (ATR) of 855.92 points to high volatility, aligning with the significant price movements and the index’s recent setting of new 52-week and year-to-date highs. This environment suggests that traders should be prepared for continued price swings and possibly abrupt changes in market direction.
Immediate support and resistance levels can be identified around the lower Bollinger Band at 45,718.5 and the recent high at 52,411.34, respectively. Given the current market sentiment and technical indicators, investors might watch for potential retracements to these levels for buying opportunities, while also being cautious of any signs of a trend reversal.
KOSPI Composite Technical Analysis
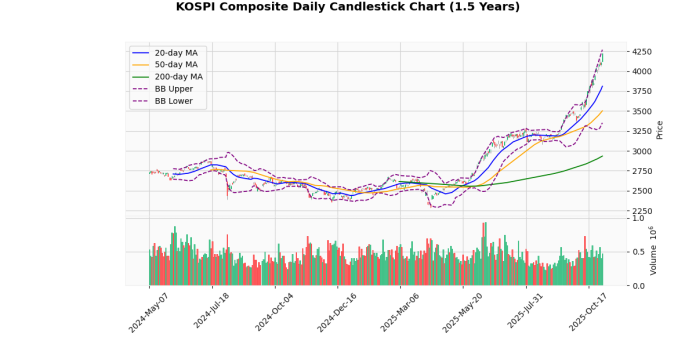
The KOSPI Composite Index currently stands at 4221.87, showing a modest increase of 2.78% today. This performance places the index just below its 52-week and year-to-date high of 4221.92, indicating a strong upward trend.
Analyzing the moving averages, the index is well above its 20-day (3810.06), 50-day (3501.68), and 200-day (2934.06) moving averages, reflecting a robust bullish momentum over the short, medium, and long term. The significant percentage differences between the current price and these averages (10.81% above the 20-day MA, 20.57% above the 50-day MA, and 43.89% above the 200-day MA) reinforce this bullish trend.
The Bollinger Bands show the current price nearing the upper band (4268.74), with the middle band at 3810.06 and the lower band at 3351.37. The proximity to the upper band suggests that the index might be approaching overbought territory, a sentiment echoed by the high Relative Strength Index (RSI) of 85.06, which is well into the overbought zone.
The Moving Average Convergence Divergence (MACD) at 189.03, with a signal line at 160.65, indicates continued bullish momentum as the MACD remains above its signal line. However, the high RSI and the MACD’s elevated level could hint at potential for a pullback or consolidation in the near term.
The Average True Range (ATR) of 74.72 points to relatively high volatility, aligning with the significant movements and new highs the index has been testing.
In summary, the KOSPI Composite Index is exhibiting strong bullish signals with its current positioning above key moving averages and near its upper Bollinger Band. However, the overbought RSI and the proximity to the 52-week high suggest that traders should watch for signs of potential consolidation or a slight retracement. Investors might consider looking for stabilization or a slight pullback before taking new positions, given the heightened volatility and overbought conditions.
Technical Metrics
| Metric | Value |
|---|---|
| Current Price | 4221.87 |
| Today’s Change (%) | 2.78 |
| 20-day MA | 3810.06 |
| % from 20-day MA | 10.81 |
| 50-day MA | 3501.68 |
| % from 50-day MA | 20.57 |
| 200-day MA | 2934.06 |
| % from 200-day MA | 43.89 |
| Bollinger Upper | 4268.74 |
| % from BB Upper | -1.10 |
| Bollinger Lower | 3351.37 |
| % from BB Lower | 25.97 |
| RSI (14) | 85.06 |
| MACD | 189.03 |
| MACD Signal | 160.65 |
| 3-day High | 4221.92 |
| % from 3-day High | N/A |
| 3-day Low | 4059.74 |
| % from 3-day Low | 3.99 |
| 52-week High | 4221.92 |
| % from 52-week High | N/A |
| 52-week Low | 2284.72 |
| % from 52-week Low | 84.79 |
| YTD High | 4221.92 |
| % from YTD High | N/A |
| YTD Low | 2284.72 |
| % from YTD Low | 84.79 |
| ATR (14) | 74.72 |
The KOSPI Composite Index presents a robust technical outlook, currently trading at 4221.87, which is significantly above its 20-day (3810.06), 50-day (3501.68), and 200-day (2934.06) moving averages, indicating a strong bullish trend. The index is approaching the upper Bollinger Band (4268.74), suggesting it is nearing a potential resistance level. The proximity to the upper band, combined with a high RSI of 85.06, points to overbought conditions, which could signal a forthcoming consolidation or pullback.
The MACD value at 189.03, above its signal line (160.65), supports the continuation of the upward momentum, although caution is warranted given the elevated RSI levels. The Average True Range (ATR) of 74.72 reflects moderate volatility, typical of an active market but not excessively unstable.
Potential resistance is immediately at the 52-week high of 4221.92, with further resistance possibly near the upper Bollinger Band. On the downside, support might be found around the 20-day moving average at 3810.06, which could serve as a fallback level if a retracement occurs. Overall, market sentiment appears bullish, but investors should monitor for signs of reversal due to the overbought conditions.
STI Technical Analysis
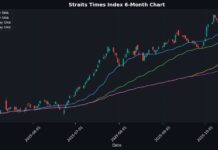
The STI index currently stands at 4444.33, marking a modest increase of 0.35% today. This performance is reflected in its position relative to both short-term and long-term moving averages, indicating a bullish trend. The index is trading above the 20-day (4413.52), 50-day (4348.12), and 200-day (4041.36) moving averages, with respective percentage differences of 0.7%, 2.21%, and 9.97%. This suggests sustained upward momentum over these periods.
The Bollinger Bands provide further insights, with the index currently positioned between the upper (4489.46) and middle (4413.52) bands. The proximity to the upper band, coupled with a -1.01% difference from it, indicates that the index is nearing a potentially overbought zone but has not yet reached it. The bands themselves, with a lower band at 4337.58, show a normal range of volatility, as evidenced by the ATR of 33.28.
The RSI at 61.76 leans towards the upper end of the neutral range, approaching overbought territory but still offering room for potential upside before extreme levels are reached. The MACD value of 27.59, slightly above its signal line at 26.74, confirms the ongoing bullish momentum through a positive crossover, suggesting that the upward trend might continue in the short term.
Considering the index’s performance relative to its 3-day, 52-week, and YTD highs and lows, it is currently trading near its peak levels, with only a -0.76% difference from the 52-week and YTD highs (4478.15), indicating strong annual performance. The significant rise from the 52-week and YTD lows (3372.38) by 31.79% underscores a robust recovery and bullish sentiment throughout the year.
In summary, the STI index exhibits strong bullish signals across various technical indicators, with potential caution near overbought conditions as suggested by the proximity to the upper Bollinger Band and a higher RSI. Investors should monitor for any signs of reversal, but the prevailing trend points towards continued strength in the near term.
Technical Metrics
| Metric | Value |
|---|---|
| Current Price | 4444.33 |
| Today’s Change (%) | 0.35 |
| 20-day MA | 4413.52 |
| % from 20-day MA | 0.70 |
| 50-day MA | 4348.12 |
| % from 50-day MA | 2.21 |
| 200-day MA | 4041.36 |
| % from 200-day MA | 9.97 |
| Bollinger Upper | 4489.46 |
| % from BB Upper | -1.01 |
| Bollinger Lower | 4337.58 |
| % from BB Lower | 2.46 |
| RSI (14) | 61.76 |
| MACD | 27.59 |
| MACD Signal | 26.74 |
| 3-day High | 4458.13 |
| % from 3-day High | -0.31 |
| 3-day Low | 4417.00 |
| % from 3-day Low | 0.62 |
| 52-week High | 4478.15 |
| % from 52-week High | -0.76 |
| 52-week Low | 3372.38 |
| % from 52-week Low | 31.79 |
| YTD High | 4478.15 |
| % from YTD High | -0.76 |
| YTD Low | 3372.38 |
| % from YTD Low | 31.79 |
| ATR (14) | 33.28 |
The technical outlook for the STI index presents a generally bullish sentiment as it currently trades above its key moving averages (20-day, 50-day, and 200-day), indicating a strong upward trend over short, medium, and long-term periods. The index’s current price of 4444.33 is positioned just below the upper Bollinger Band and comfortably above the middle and lower bands, suggesting that it is nearing a potential resistance area around the upper band at 4489.46, but not yet overextended.
The Relative Strength Index (RSI) at 61.76 points towards a moderately bullish momentum without entering the overbought territory (typically above 70). The MACD, currently above its signal line, further supports the bullish momentum, indicating ongoing buying pressure.
Volatility, as measured by the Average True Range (ATR) of 33.28, remains relatively stable, suggesting that the current price movements are within normal bounds, without excessive volatility.
Potential resistance could be tested near the recent 52-week high of 4478.15, while support might be found around the 20-day moving average at 4413.52, which has recently acted as a reliable support level in the upward trend. The index’s consistent performance above its 200-day moving average also underscores a strong bullish backdrop over a longer-term horizon.
Overall, market sentiment appears positive, with technical indicators supporting further potential upside, albeit with usual market fluctuations. Investors should watch for any changes in RSI and MACD for early signs of momentum shifts and adjust their strategies accordingly to either capitalize on continued gains or protect against a potential pullback.


