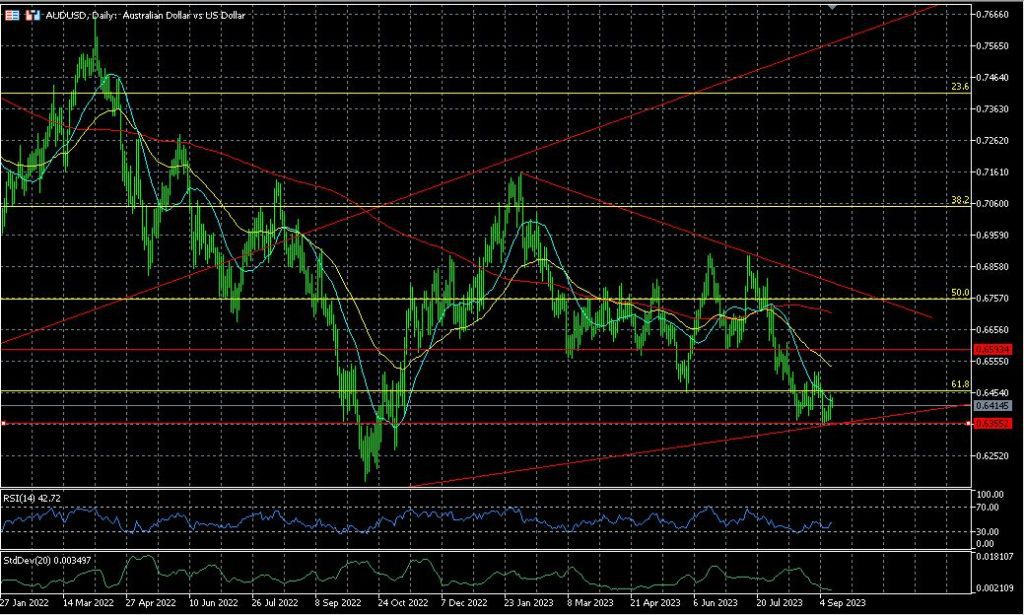
AUD/USD made multiple bottoms in area 0.6352, its 2023 low. This level at the moment can be considered a barrier between trend followers which would be happy to see another bearish leg and market timing traders, ready to find turning points in the markets to grasp the initial new trend.

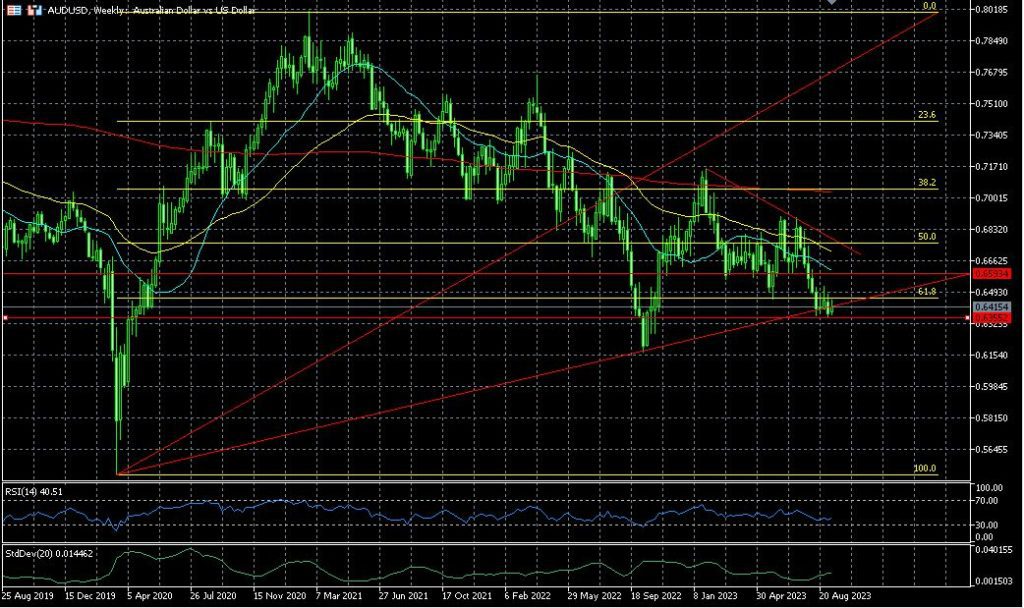
If prices would slide beneath 0.6352 likely to see a test of last year lows in area 0.6160. AUD/USD retraced more than the 61.8% of the uprend March 2020-February 2021 ( weekly chart below) and to complete a full retracement the rate would need to slid circa further 1,000 pips.

There is a bullish trendline, on the weekly chart as well, which links higher lows: at the moment AUD/USD seems have fallen below it but better to give a 100 pips circa (circa 1.5% price change) of price downtrend before to confirm.
In case of a rebound thanks to the validity of the bullish trendline, 0.66 and then the 200 day SMA in area 0.671 would be the most relevant resistance before to reach the trendline that links lower high.


