Top 10 Performers
Bassett Furniture Industries Inc (BSET) (4.91%)
Technical Analysis
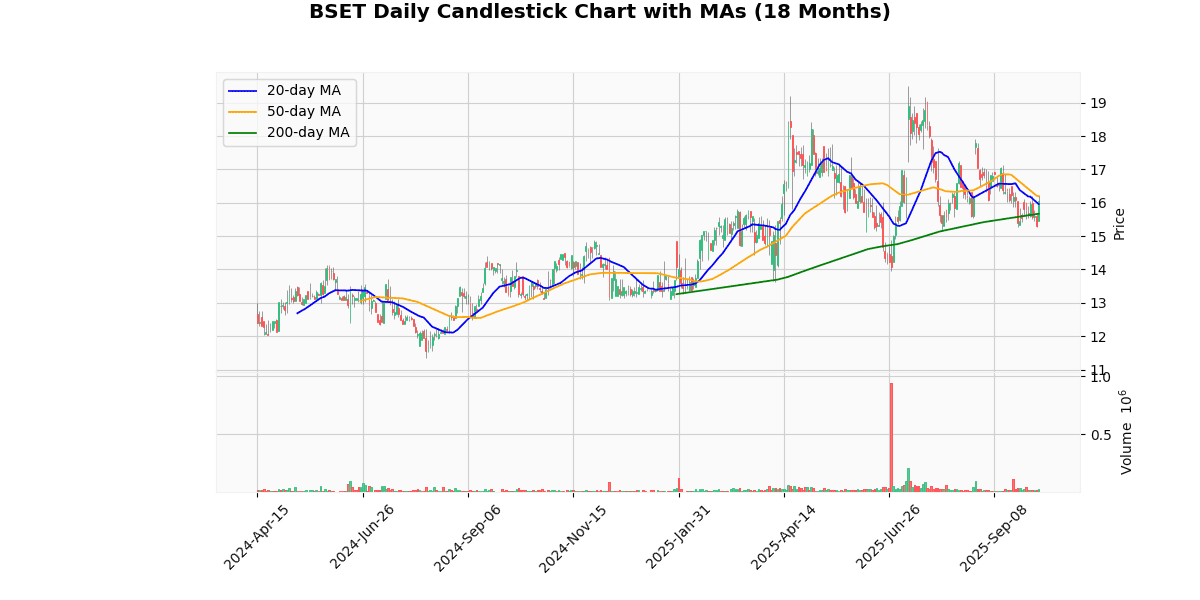
The current price of the asset at $16.04 exhibits a modest uptrend when analyzed against its moving averages. It is slightly above the 20-day moving average (MA20) of $15.96, indicating a short-term bullish sentiment as the price has recently moved above this average. However, it is positioned below the 50-day moving average (MA50) of $16.19, suggesting some resistance in the medium term that could limit upward movements. The price stands well above the 200-day moving average (MA200) of $15.67, reinforcing a stronger bullish outlook in the longer term. This positioning above the MA200 but below the MA50 reflects a mixed sentiment, where investors might be cautious in the medium term but optimistic about long-term prospects. Overall, the asset appears to be in a generally favorable market position with potential for further gains, contingent on breaking past the medium-term resistance level.
Recent Ratings
| Date | Status | Outer | Rating | Price |
|---|---|---|---|---|
| 2023-09-07 00:00:00 | Downgrade | Noble Capital Markets | Outperform → Market Perform | |
| 2017-06-30 00:00:00 | Reiterated | Stifel | Hold | $28 → $36 |
| 2016-04-06 00:00:00 | Initiated | Stifel | Hold | |
| 2016-01-27 00:00:00 | Downgrade | Sidoti | Buy → Neutral |
Iradimed Corp (IRMD) (3.89%)
Technical Analysis
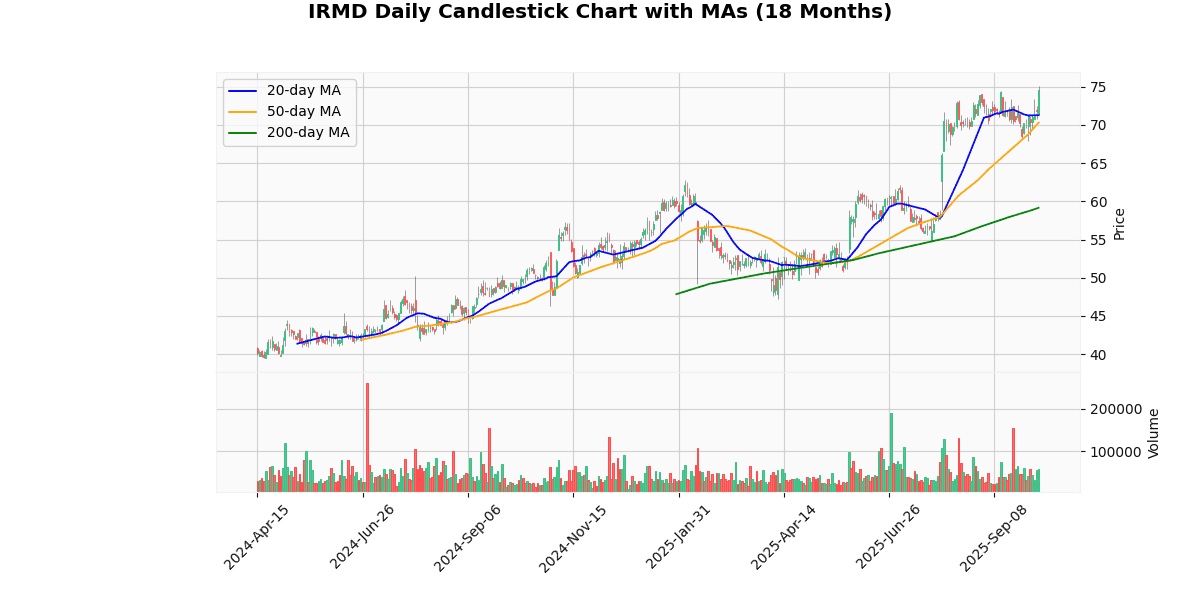
The current price of the asset at $74.9 shows a bullish trend when analyzed in the context of its moving averages (MAs). It is trading above all key MAs: the 20-day MA at $71.29, the 50-day MA at $70.3, and significantly above the 200-day MA at $59.17. This positioning indicates a strong upward momentum in the short-term, as the price is not only above the shorter-term MAs (20-day and 50-day) but also far exceeds the long-term 200-day MA, suggesting a robust longer-term uptrend. The consistent increase in the MAs, with the 200-day MA being the lowest, further supports this bullish sentiment. Investors might view these indicators as a sign of sustained strength, potentially attracting more buying interest in the market.
Recent Ratings
| Date | Status | Outer | Rating | Price |
|---|---|---|---|---|
| 2023-04-12 00:00:00 | Initiated | Lake Street | Buy | $50 |
| 2017-10-31 00:00:00 | Resumed | ROTH Capital | Buy | |
| 2016-10-05 00:00:00 | Downgrade | ROTH Capital | Buy → Neutral | |
| 2015-11-02 00:00:00 | Reiterated | ROTH Capital | Buy | $25 → $30 |
Sky Harbour Group Corporation (SKYH) (3.34%)
Technical Analysis
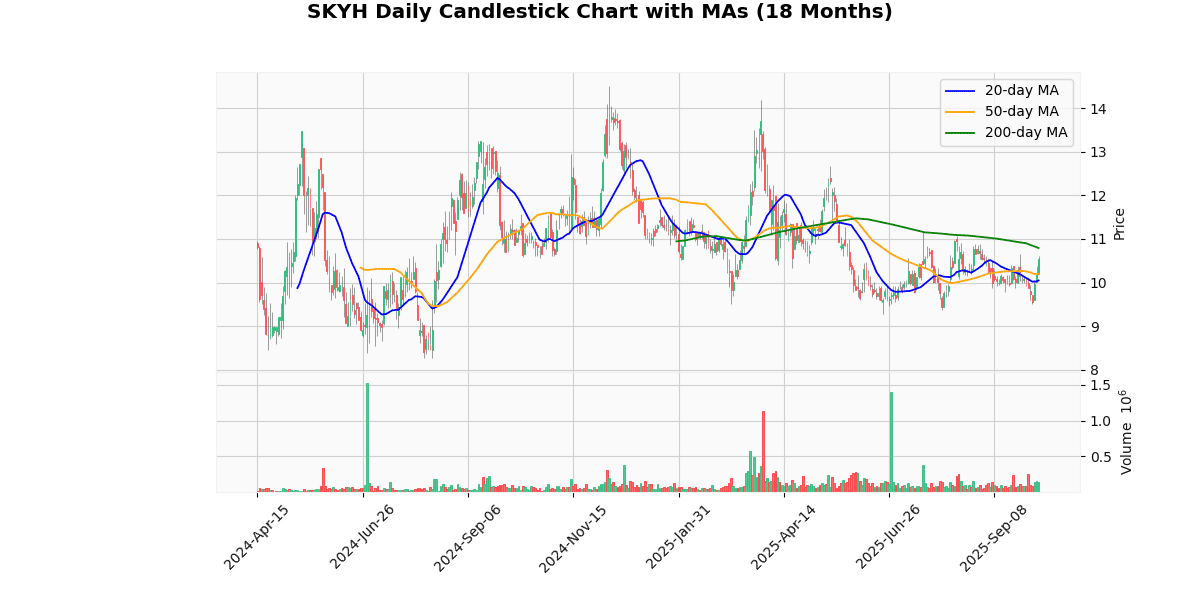
The current price of the asset at $10.53 shows a positive trend when compared to the shorter-term moving averages (MA20 at $10.05 and MA50 at $10.2), indicating a recent uptick in price momentum. This upward movement suggests a bullish sentiment in the near term, as the price has surpassed these averages, which often act as dynamic support levels. However, the price remains below the longer-term MA200, which is at $10.79. This indicates that while there has been recent positive performance, the asset is still facing challenges in overcoming longer-term bearish pressures. Investors might view the current positioning between the MA50 and MA200 as a potential consolidation zone, with a key resistance near the MA200 level. A sustained move above this level could signal a shift towards a longer-term bullish trend.
Recent Ratings
| Date | Status | Outer | Rating | Price |
|---|---|---|---|---|
| 2025-06-09 00:00:00 | Initiated | Lake Street | Buy | $14 |
| 2025-05-12 00:00:00 | Initiated | Noble Capital Markets | Outperform | $23 |
| 2025-04-25 00:00:00 | Initiated | Alliance Global Partners | Buy | $14.50 |
| 2024-11-20 00:00:00 | Reiterated | Maxim Group | Buy | $17 → $25 |
Kratos Defense & Security Solutions Inc (KTOS) (3.29%)
Recent News (Last 24 Hours)
Kratos Defense & Security Solutions, Inc. (KTOS) has seen a notable uptick in its stock price today, as highlighted in recent financial news. The surge in Kratos’ stock is primarily attributed to its significant role in the American drone industry, which is gaining momentum due to increased defense spending and technological advancements in unmanned systems. Articles from both StockStory and Zacks emphasize the company’s strategic positioning within the defense sector, particularly in drone technology, which is becoming increasingly vital for national security and military operations.
The broader context of the defense industry’s performance, as discussed in a MarketBeat article, points to a robust growth trajectory for companies like Kratos, which are at the forefront of the 2025 defense momentum wave. This industry-wide momentum, combined with Kratos’ specific advancements and contracts in drone technology, suggests a positive outlook for the company’s stock. Investors and stakeholders in the defense sector may see continued growth potential in Kratos, driven by ongoing technological innovations and governmental defense priorities.
Technical Analysis
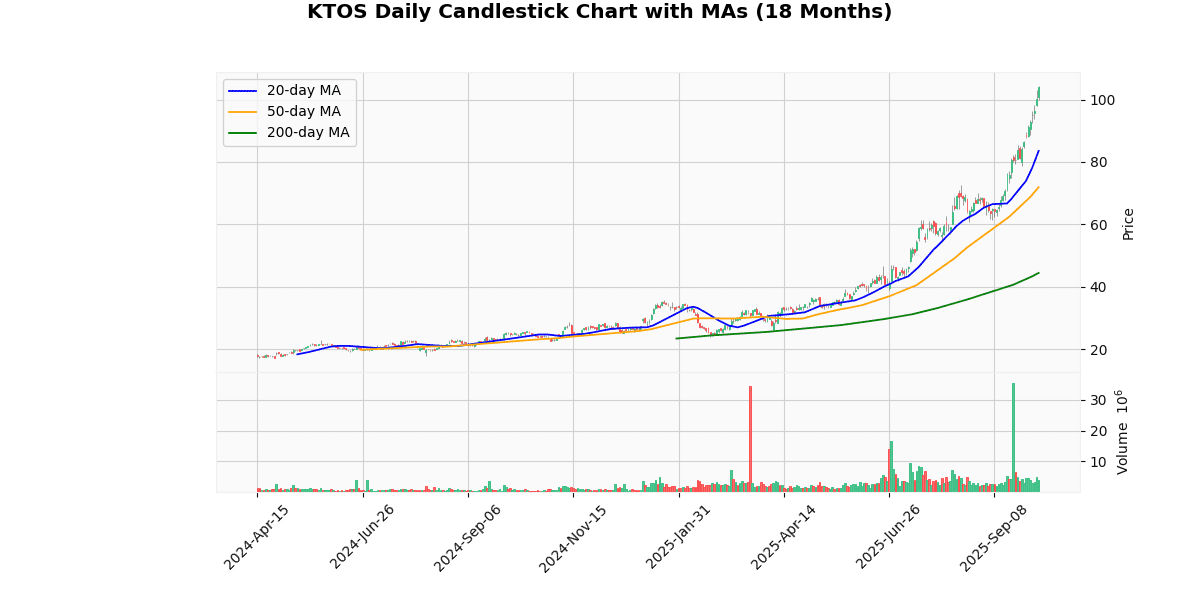
The current price of the asset at $104.09 indicates a robust upward trend, significantly outpacing its 20-day, 50-day, and 200-day moving averages (MA) of $83.55, $71.93, and $44.44, respectively. This substantial premium over all three MAs suggests strong bullish momentum in the short, medium, and long term. The considerable distance above the 200-day MA, in particular, highlights a dramatic shift in market sentiment over the longer horizon, potentially indicating sustained investor confidence and a revaluation of the asset’s fundamentals. The steep gradient between the MAs, with each progressively lower as the time frame extends, further underscores accelerating price appreciation. Investors might view these metrics as signals for continued upward movement, though caution is warranted as such steep inclines could also precede volatility or corrective pullbacks.
Recent Ratings
| Date | Status | Outer | Rating | Price |
|---|---|---|---|---|
| 2025-08-14 00:00:00 | Upgrade | BTIG Research | Neutral → Buy | $80 |
| 2025-08-12 00:00:00 | Resumed | Canaccord Genuity | Buy | $74 |
| 2025-08-11 00:00:00 | Initiated | Canaccord Genuity | Buy | $74 |
| 2025-07-08 00:00:00 | Initiated | Cantor Fitzgerald | Overweight | $60 |
Verde Clean Fuels Inc (VGAS) (3.18%)
Technical Analysis
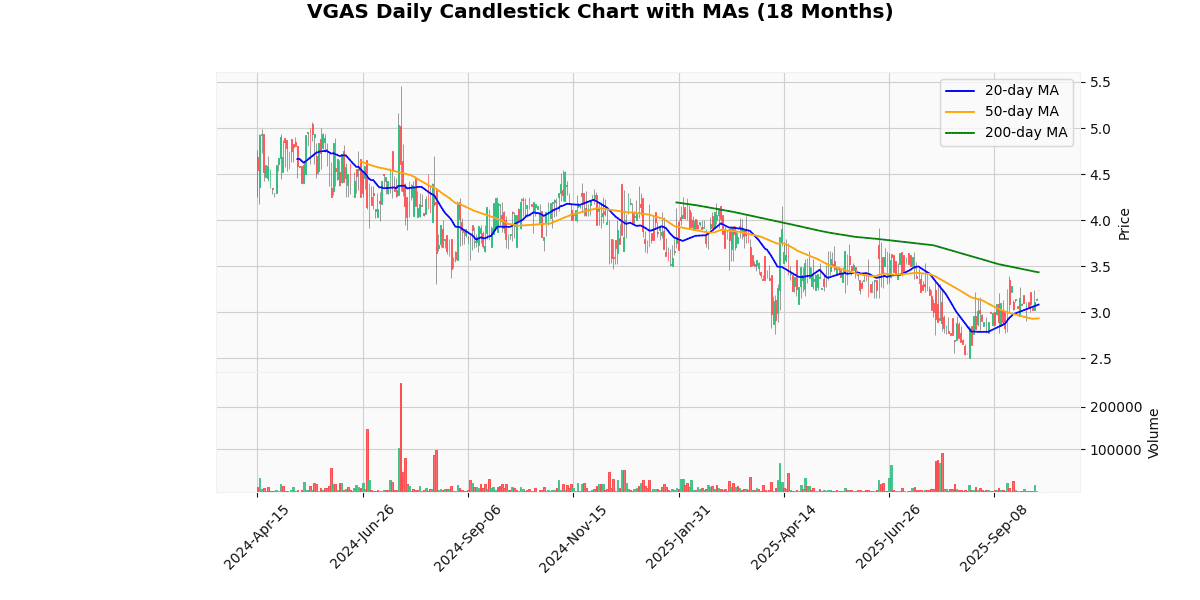
The current price of the asset is $3.04, which shows a slight deviation below the 20-day moving average (MA20) of $3.07, indicating a potential short-term bearish sentiment. However, the price is above the 50-day moving average (MA50) of $2.93, suggesting an intermediate bullish trend as it surpasses this mid-term benchmark. This position above the MA50 could attract buying interest from traders who follow trend momentum. Conversely, the price is significantly below the 200-day moving average (MA200) of $3.43, highlighting a longer-term bearish trend. This disparity between the MA200 and current price may signal underlying weaknesses or a broader negative market sentiment. Investors might be cautious, considering this as a potential resistance level for future upward movements. Overall, the asset exhibits mixed signals, with short-term pressures and a more pronounced long-term bearish outlook.
Eastern Co (EML) (2.83%)
Technical Analysis
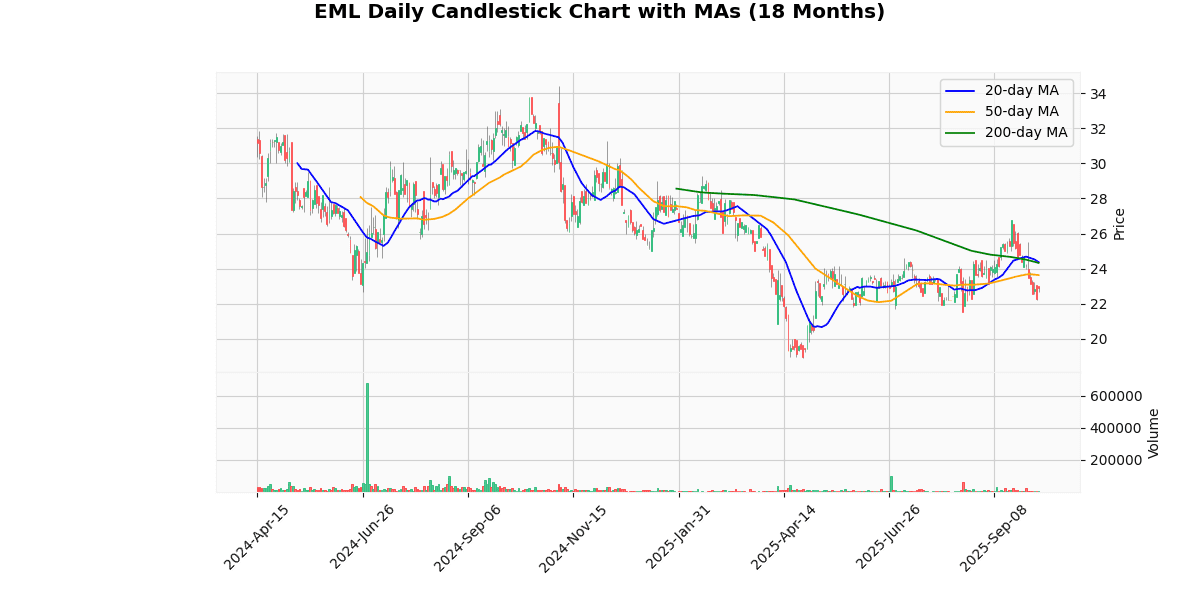
The current price of the asset stands at $22.92, which is positioned below all key moving averages: the 20-day MA at $24.37, the 50-day MA at $23.63, and the 200-day MA at $24.33. This alignment indicates a bearish trend in the short to medium term, as the price is consistently underperforming relative to historical averages. The fact that the current price is below the shorter-term 20-day MA and the longer-term 200-day MA suggests that both short-term traders and long-term investors may view this as a period of negative momentum. The gap between the current price and these averages could imply potential resistance levels if the price attempts to rise. Investors might be cautious, watching for any signs of a reversal or further decline based on upcoming market catalysts or changes in underlying fundamentals.
Consumer Portfolio Service Inc (CPSS) (2.48%)
Technical Analysis
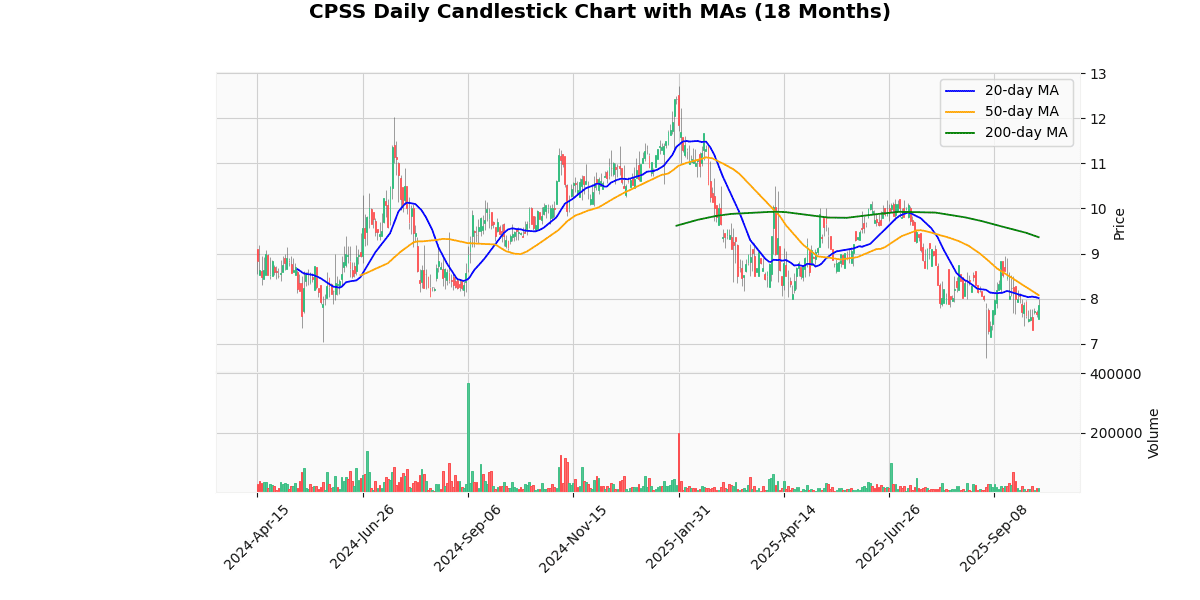
The current price of the asset at $7.85 reflects a downward trend when compared against its moving averages (MAs) across various time frames. It is trading below the 20-day MA of $8.01 and the 50-day MA of $8.08, indicating a short-term bearish sentiment. More significantly, the price is substantially below the 200-day MA of $9.36, suggesting a longer-term downtrend. This positioning below all key MAs typically signals weakness and may deter bullish investors until signs of a reversal are evident. The consistent decrease from the 200-day MA to the current price points to sustained selling pressure. Investors might be cautious, watching for potential support levels or a shift in momentum before considering entry. Overall, the market positioning and MA trends suggest a bearish outlook in the near to medium term.
Recent Ratings
| Date | Status | Outer | Rating | Price |
|---|---|---|---|---|
| 2016-04-27 00:00:00 | Reiterated | Compass Point | Neutral | $5.50 → $5 |
| 2016-03-16 00:00:00 | Downgrade | JMP Securities | Mkt Outperform → Mkt Perform | |
| 2016-02-25 00:00:00 | Downgrade | Compass Point | Buy → Neutral | $9 → $5.50 |
| 2014-07-08 00:00:00 | Initiated | Compass Point | Buy | $10 |
Ballys Corporation (BALY) (2.27%)
Recent News (Last 24 Hours)
As of the latest update, there have been no significant news developments related to the stock in the past 24 hours. The absence of fresh news could imply a period of stability for the stock, with no immediate external factors likely to influence its price movement in the short term. Investors should continue to monitor broader market conditions and sector-specific trends that could indirectly affect the stock’s performance. Additionally, the lack of recent updates might suggest that the company is in a steady state of operations, without any disruptive changes or announcements. This could be perceived positively by investors seeking stability, but it may prompt those looking for growth triggers to adopt a cautious approach. It’s advisable for stakeholders to stay updated on upcoming financial reports or industry developments that could provide deeper insights into the company’s performance and strategic direction.
Technical Analysis
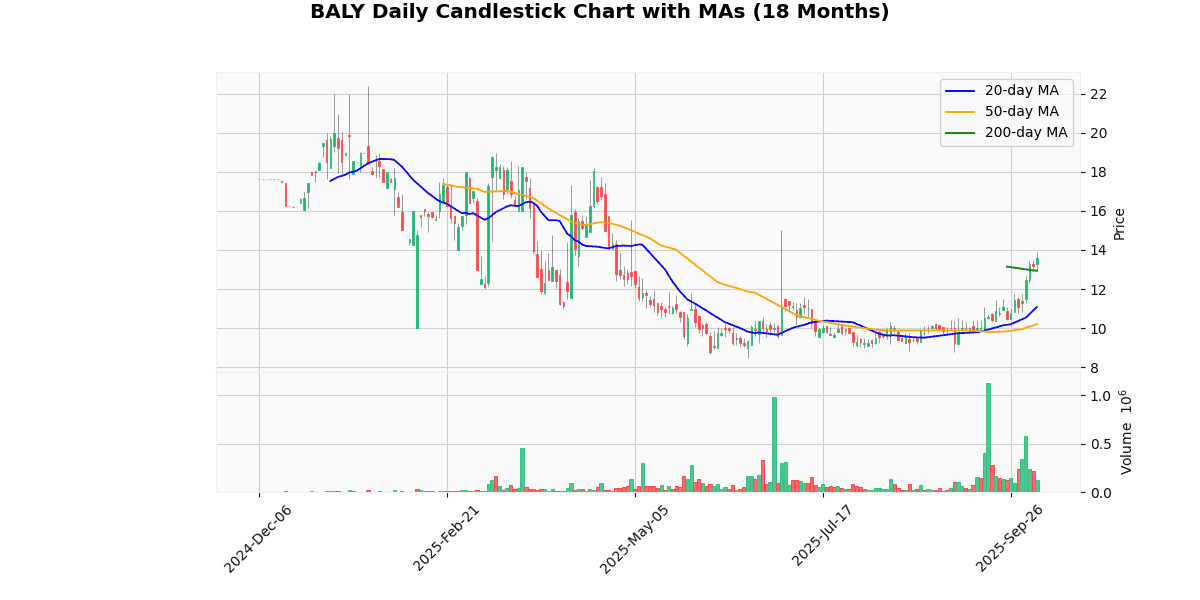
The current price of the asset at $13.58 exhibits a bullish trend when analyzed against its moving averages (MAs). The price is currently above the 20-day MA of $11.09, the 50-day MA of $10.21, and the 200-day MA of $12.94, indicating a strong upward momentum in the short, medium, and long term. This positioning above all key MAs suggests that the asset has been consistently gaining value and the market sentiment is likely positive. The significant gap between the current price and the 50-day MA further underscores a robust bullish phase, potentially attracting more buyers into the market. Investors might view these indicators as a confirmation of a sustained uptrend, possibly leading to increased buying pressure in the near future.
Recent Ratings
| Date | Status | Outer | Rating | Price |
|---|---|---|---|---|
| 2024-01-17 00:00:00 | Downgrade | Macquarie | Outperform → Neutral | |
| 2024-01-05 00:00:00 | Downgrade | Wells Fargo | Equal Weight → Underweight | $10 |
| 2022-11-02 00:00:00 | Downgrade | Stifel | Buy → Hold | $28 → $25 |
| 2022-10-06 00:00:00 | Initiated | Deutsche Bank | Hold | $23 |
XOMA Royalty Corp (XOMA) (2.15%)
Technical Analysis
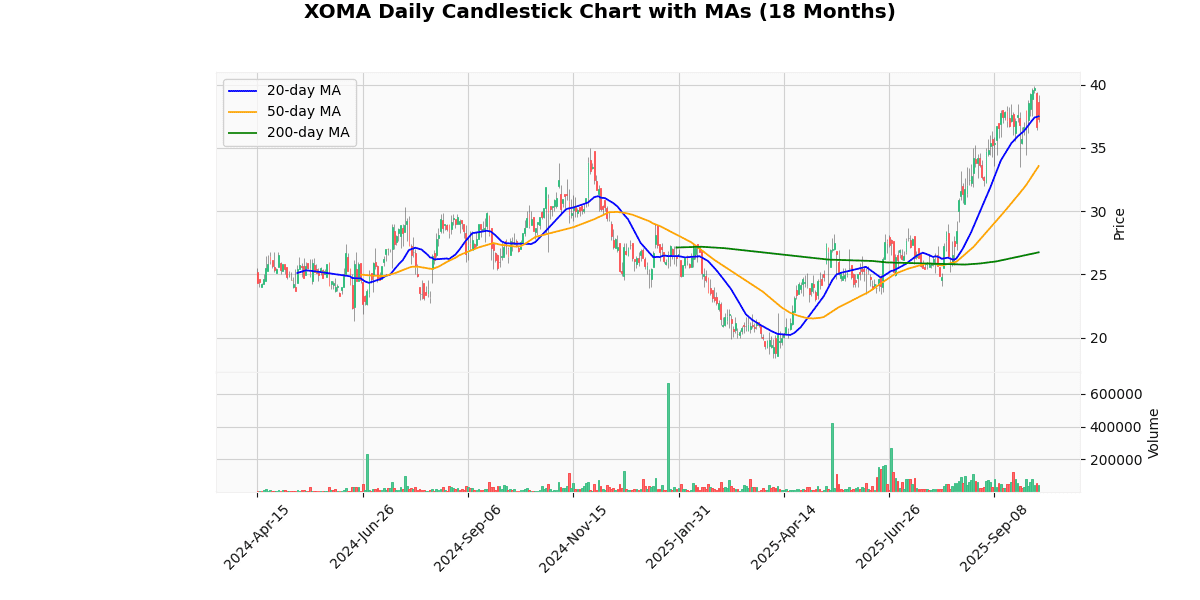
The current price of the asset is $37.33, which is slightly below the 20-day moving average (MA20) of $37.49, indicating a potential short-term bearish sentiment or consolidation phase. However, the price is significantly above both the 50-day moving average (MA50) at $33.56 and the 200-day moving average (MA200) at $26.73. This positioning above the longer-term averages suggests a strong bullish trend over the medium to long term. The substantial gap between the MA50 and MA200, along with the current price maintaining close proximity to the MA20, underscores a robust upward momentum that has been sustained over recent periods. Investors might view the slight dip below the MA20 as a minor pullback within a broader bullish market context, potentially presenting a buying opportunity if the upward trend continues.
Recent Ratings
| Date | Status | Outer | Rating | Price |
|---|---|---|---|---|
| 2025-04-17 00:00:00 | Initiated | The Benchmark Company | Buy | $35 |
| 2024-04-29 00:00:00 | Initiated | Leerink Partners | Outperform | $40 |
| 2021-09-07 00:00:00 | Downgrade | Wedbush | Outperform → Neutral | $22 |
| 2021-06-29 00:00:00 | Initiated | Aegis Capital | Buy | $60 |
CSP Inc (CSPI) (2.07%)
Technical Analysis
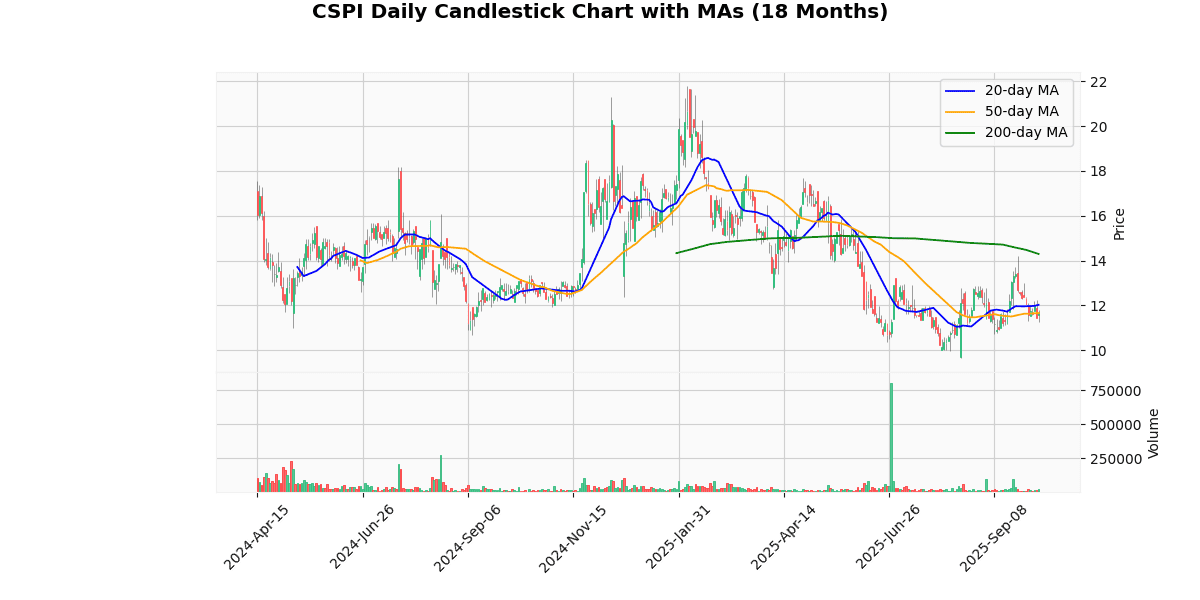
The current price of the asset at $11.48 is indicative of a bearish trend when analyzed against its moving averages. It is trading below the 20-day moving average (MA20) of $12.01, the 50-day moving average (MA50) of $11.64, and significantly below the 200-day moving average (MA200) of $14.29. This positioning suggests a sustained downward trend over both the short and long term. The fact that the current price is below both the MA20 and MA50 indicates that the asset has been losing momentum in the recent past and continues to underperform in the medium term. The substantial gap between the current price and the MA200 highlights a longer-term depreciation in value, suggesting potential bearish sentiment among investors and a possible reevaluation of the asset’s fundamental value.
Worst 10 Performers
Ispire Technology Inc (ISPR) (-6.35%)
Technical Analysis
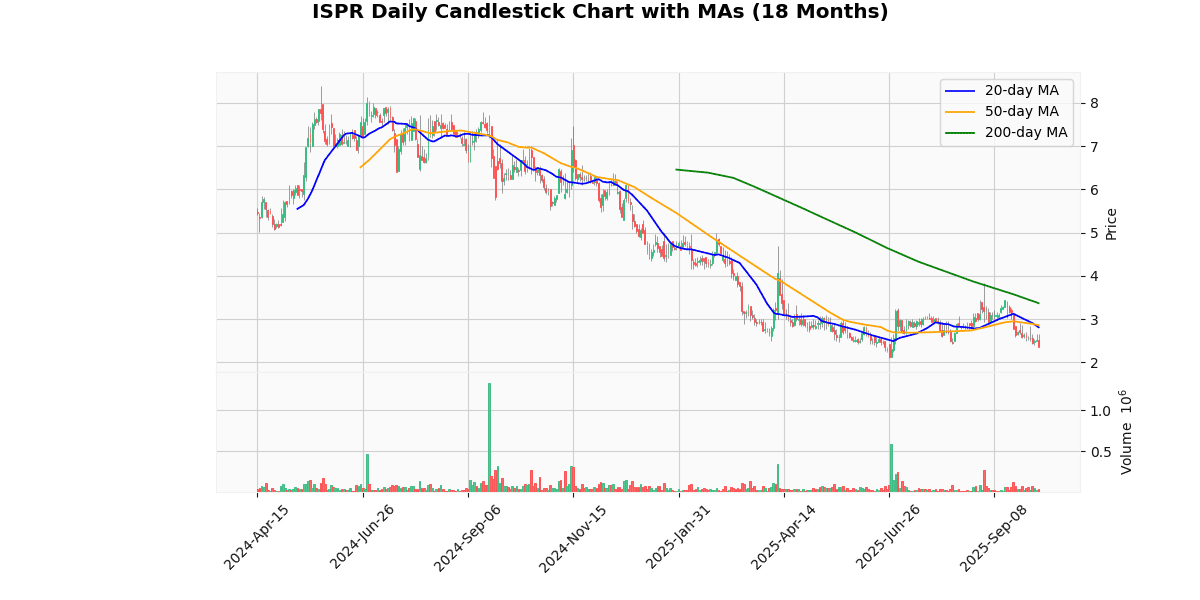
The price metrics indicate a bearish trend for the asset under consideration. The current price of $2.35 is significantly below the short-term moving averages (MA20 at $2.81 and MA50 at $2.86), suggesting a downward momentum in recent weeks. This is further corroborated by the price being well below the long-term moving average (MA200 at $3.37), highlighting a sustained negative trend over a longer period. The substantial gap between the current price and all three moving averages may also suggest that the asset is currently undervalued or facing strong selling pressure. Investors might view this as a potential entry point if they believe in a market correction, or alternatively, it could signal a need for caution if the downward trend is expected to continue. This positioning requires careful market analysis to anticipate future movements accurately.
Recent Ratings
| Date | Status | Outer | Rating | Price |
|---|---|---|---|---|
| 2024-05-20 00:00:00 | Initiated | ROTH MKM | Buy | $11 |
Credo Technology Group Holding Ltd (CRDO) (-6.00%)
Technical Analysis
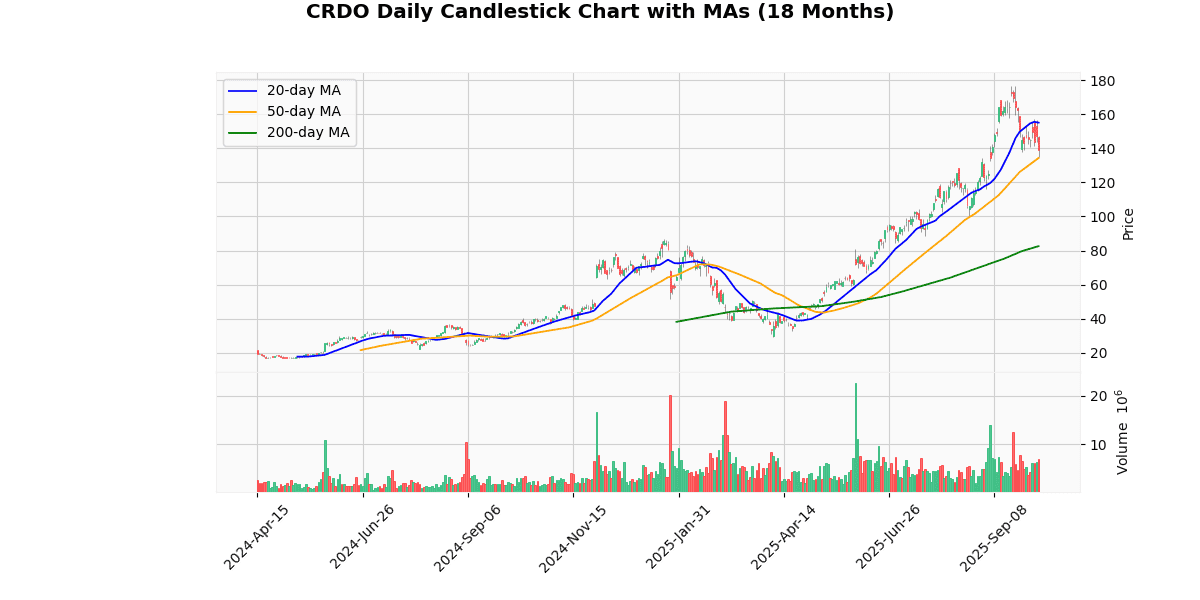
The current price of the asset at $139.13 indicates a recent downturn when compared to the 20-day moving average (MA20) of $155.01, suggesting a short-term bearish sentiment in the market. However, the price is currently above the 50-day moving average (MA50) of $134.32 and significantly higher than the 200-day moving average (MA200) of $82.62, which points to a strong upward trend in the medium to long term. This positioning above both the MA50 and MA200, but below the MA20, could indicate that the recent pullback might be a temporary correction within a broader bullish trend. Investors might view this as a potential buying opportunity, assuming the price will realign with the longer-term positive trajectory indicated by the substantial rise above the MA200.
Recent Ratings
| Date | Status | Outer | Rating | Price |
|---|---|---|---|---|
| 2025-10-01 00:00:00 | Resumed | TD Cowen | Buy | $170 |
| 2025-09-18 00:00:00 | Initiated | William Blair | Outperform | |
| 2025-09-04 00:00:00 | Reiterated | TD Cowen | Buy | $140 → $160 |
| 2025-09-04 00:00:00 | Reiterated | Needham | Buy | $85 → $150 |
EVI Industries Inc (EVI) (-5.89%)
Technical Analysis
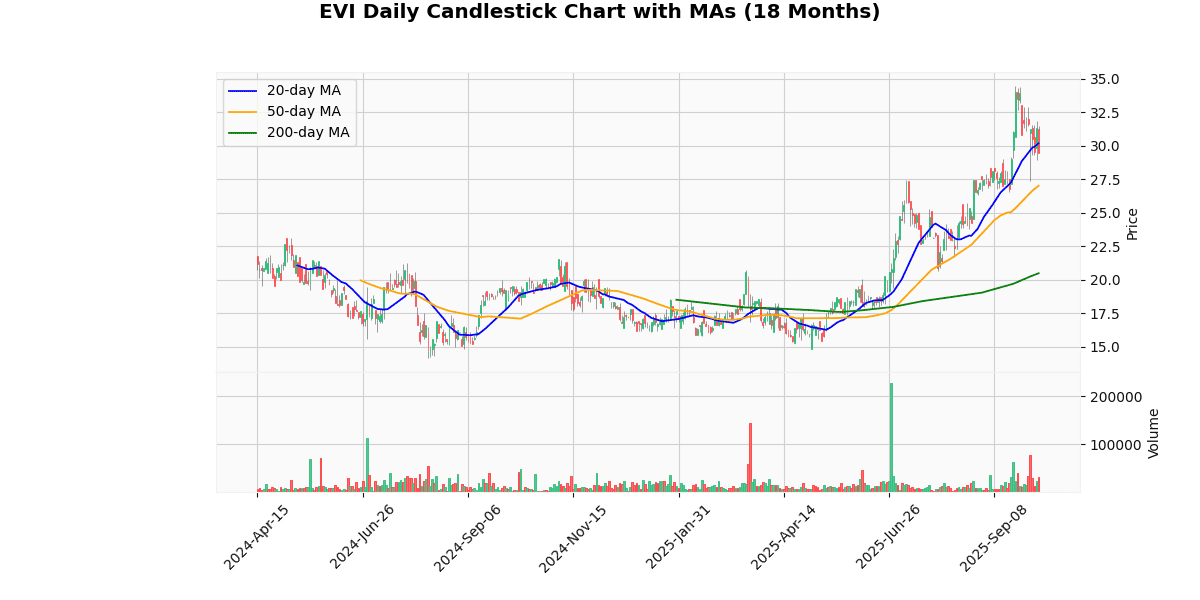
The current price of the asset at $29.49 is positioned below the 20-day moving average (MA20) of $30.18, indicating a potential short-term bearish sentiment as the price has recently declined relative to the past month’s average. However, the price stands above both the 50-day and 200-day moving averages, at $27.02 and $20.49 respectively, suggesting a stronger bullish trend in the medium to long term. The significant gap between the 50-day and 200-day averages highlights a robust upward momentum over the longer period. This divergence between the short-term and longer-term moving averages may suggest some volatility or a possible reversion to the mean in the near term. Investors might view the current dip as a buying opportunity, assuming the longer-term bullish trend continues.
Recent Ratings
| Date | Status | Outer | Rating | Price |
|---|---|---|---|---|
| 2025-06-06 00:00:00 | Initiated | DA Davidson | Buy | $28 |
Universal Logistics Holdings Inc (ULH) (-4.93%)
Technical Analysis
The provided price metrics indicate a bearish trend for the asset in question. The current price of $20.61 is significantly below all listed moving averages: 20-day MA at $23.6, 50-day MA at $24.16, and 200-day MA at $28.41. This positioning suggests a sustained downward movement in price over both short and long-term periods. The consistent decline across these time frames, with the current price trailing the 20-day MA by nearly 13%, and even more so from the 200-day MA, underscores a strong bearish sentiment in the market. Investors might view this as a potential signal for further declines unless a reversal pattern is observed. This setup could be of particular interest to short sellers or those looking for entry points in anticipation of a market bottom.
Recent Ratings
| Date | Status | Outer | Rating | Price |
|---|---|---|---|---|
| 2024-04-29 00:00:00 | Downgrade | Stifel | Buy → Hold | $36 → $46 |
| 2024-01-10 00:00:00 | Upgrade | Stifel | Hold → Buy | $35 → $36 |
| 2022-11-02 00:00:00 | Downgrade | Stifel | Buy → Hold | $36 |
| 2019-08-02 00:00:00 | Upgrade | Stifel | Hold → Buy | $31 → $30 |
Enpro Inc (NPO) (-4.69%)
Technical Analysis
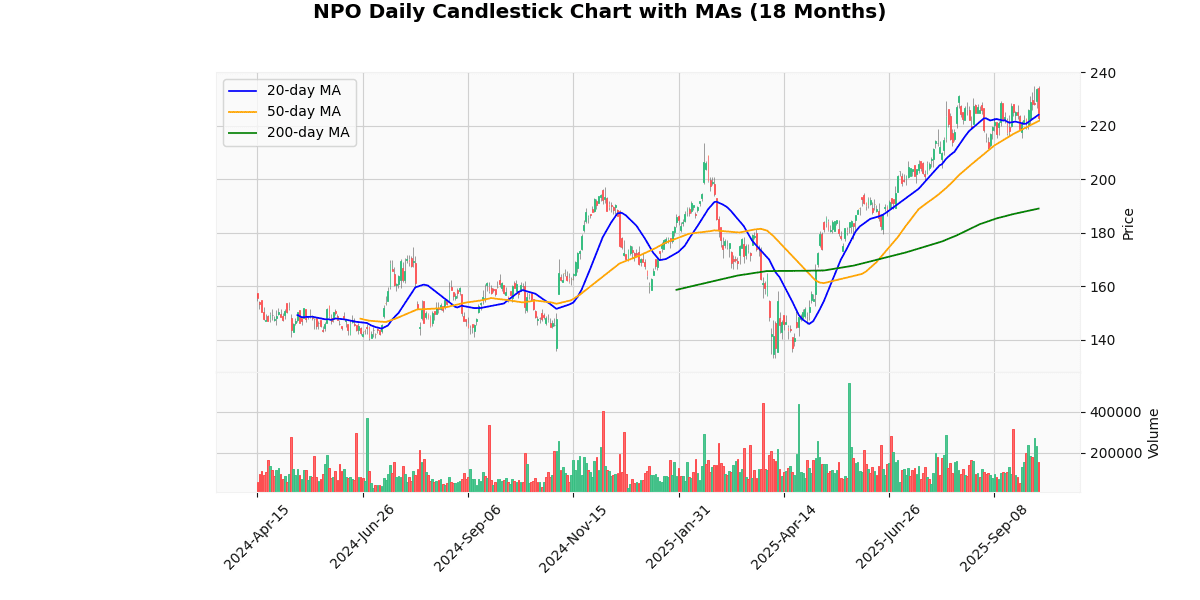
The current price of the asset at $222.52 is positioned between the 20-day moving average (MA20) of $224.06 and the 50-day moving average (MA50) of $221.72, indicating a slight short-term downtrend as the price has recently dipped below the MA20. However, the price remains above the MA50, suggesting that the medium-term trend is still bullish. The significant gap between the current price and the 200-day moving average (MA200) at $189.03 underscores a robust long-term upward trend. This disparity between the MA200 and current price points to strong gains over the past months, although the recent positioning between the MA20 and MA50 could signal a consolidation phase or a potential for minor pullbacks before further upward movement. Investors should monitor if the price will stabilize or revert above the MA20 to maintain its short-term bullish outlook.
Recent Ratings
| Date | Status | Outer | Rating | Price |
|---|---|---|---|---|
| 2020-09-24 00:00:00 | Upgrade | KeyBanc Capital Markets | Sector Weight → Overweight | $68 |
| 2019-02-19 00:00:00 | Downgrade | KeyBanc Capital Markets | Overweight → Sector Weight | |
| 2018-07-11 00:00:00 | Initiated | SunTrust | Buy | $92 |
| 2017-12-08 00:00:00 | Upgrade | KeyBanc Capital Mkts | Sector Weight → Overweight |
Graham Holdings Co (GHC) (-4.66%)
Technical Analysis
The current price of the asset at $1095.0 is positioned below the 20-day moving average (MA20) of $1157.63, indicating a recent downtrend or correction in the short term. However, it is slightly above the 50-day moving average (MA50) of $1089.45, suggesting that the medium-term trend remains moderately bullish. Significantly, the current price is well above the 200-day moving average (MA200) of $967.86, which underscores a strong long-term upward trend. This positioning above the MA200 but below the MA20 could imply potential volatility or a consolidation phase in the market as it finds support at levels near the MA50. Investors might view the proximity to the MA50 as a potential pivot point for the asset, indicating a cautious outlook for immediate price movements while maintaining a positive long-term perspective.
Taylor Morrison Home Corp (TMHC) (-4.63%)
Technical Analysis
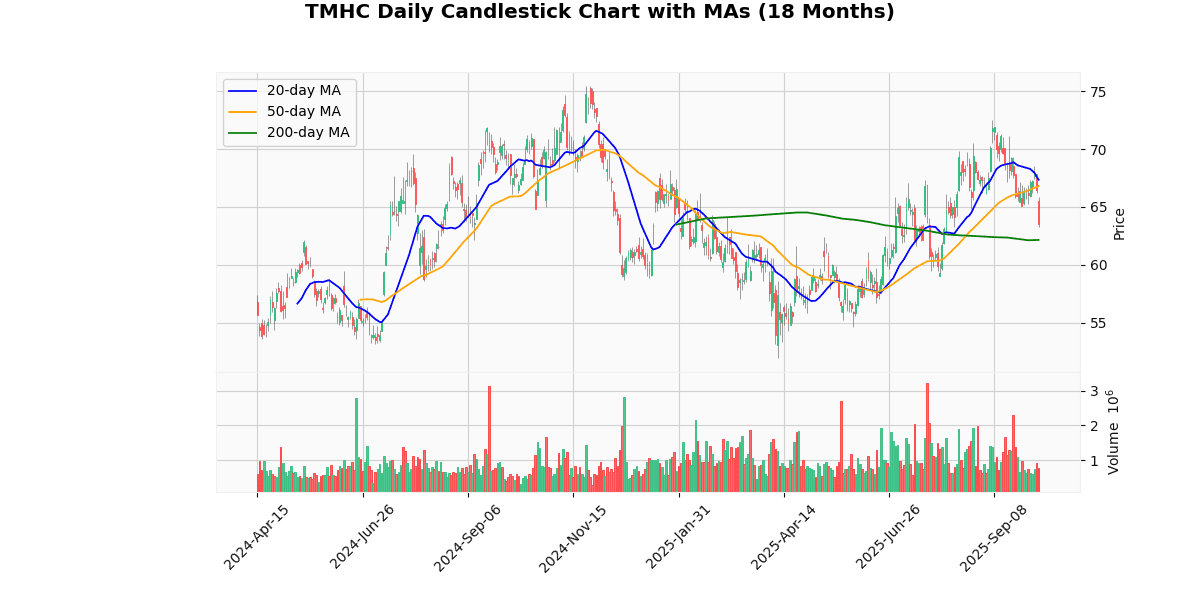
The current price of the asset is $63.49, which is positioned below both the 20-day and 50-day moving averages (MA20 at $67.35 and MA50 at $66.81, respectively). This indicates a short-term bearish trend as the price has recently declined relative to these averages. However, the price remains above the 200-day moving average (MA200 at $62.14), suggesting that the longer-term trend is still bullish. The positioning below the shorter MAs but above the MA200 may indicate a potential consolidation phase or a temporary pullback within a broader upward trend. Investors should monitor if the price can stabilize and reclaim higher levels beyond the MA20 and MA50 to confirm the continuation of the long-term bullish sentiment. Conversely, a sustained drop below the MA200 could signal a shift to a bearish market regime.
Recent Ratings
| Date | Status | Outer | Rating | Price |
|---|---|---|---|---|
| 2025-07-23 00:00:00 | Upgrade | Seaport Research Partners | Neutral → Buy | $85 |
| 2025-05-05 00:00:00 | Initiated | BofA Securities | Buy | $70 |
| 2025-03-06 00:00:00 | Upgrade | Seaport Research Partners | Sell → Neutral | $55 |
| 2025-01-27 00:00:00 | Downgrade | Seaport Research Partners | Neutral → Sell |
MI Homes Inc (MHO) (-4.54%)
Technical Analysis
The current price of the asset at $136.83 reflects a downward trend when compared to the shorter-term moving averages, with the 20-day moving average (MA20) at $147.62 and the 50-day moving average (MA50) at $142.75. This indicates a recent decline in price, suggesting bearish momentum in the near term as the price is trading below the MA20 and MA50. However, the price remains well above the 200-day moving average (MA200) at $123.48, which suggests that the longer-term trend is still bullish. The positioning below the shorter-term moving averages but above the MA200 indicates a potential consolidation phase or a correction within a broader uptrend. Investors might view dips as buying opportunities, anticipating potential rebounds towards or above the shorter-term moving averages.
Recent Ratings
| Date | Status | Outer | Rating | Price |
|---|---|---|---|---|
| 2025-03-06 00:00:00 | Upgrade | Seaport Research Partners | Neutral → Buy | $151 |
| 2024-11-04 00:00:00 | Upgrade | Wedbush | Neutral → Outperform | $155 → $185 |
| 2024-08-28 00:00:00 | Initiated | Seaport Research Partners | Neutral | |
| 2024-07-24 00:00:00 | Initiated | Raymond James | Strong Buy | $200 |
Marriott Vacations Worldwide Corp (VAC) (-4.40%)
Recent News (Last 24 Hours)
Shares of Marriott Vacations, Xponential Fitness, WeightWatchers, Peloton, and Caleres experienced significant declines today, as reported by StockStory. This downward movement in stock prices could have several implications for investors and the companies involved. For Marriott Vacations, a drop in share price might affect its capital structure and could potentially limit its ability to invest in new properties or services. Xponential Fitness and Peloton, both in the health and fitness sector, could see impacts on their expansion plans and investor confidence, which might slow down their growth strategies in a competitive market. WeightWatchers, facing a similar decline, might need to reassess its marketing strategies and customer engagement approaches to regain momentum. Lastly, for Caleres, a footwear and accessories retailer, the decrease in stock value could influence its inventory purchasing decisions and partnership opportunities. Overall, this collective slump could reflect broader market trends or sector-specific issues, impacting investor sentiment and future business operations.
Technical Analysis
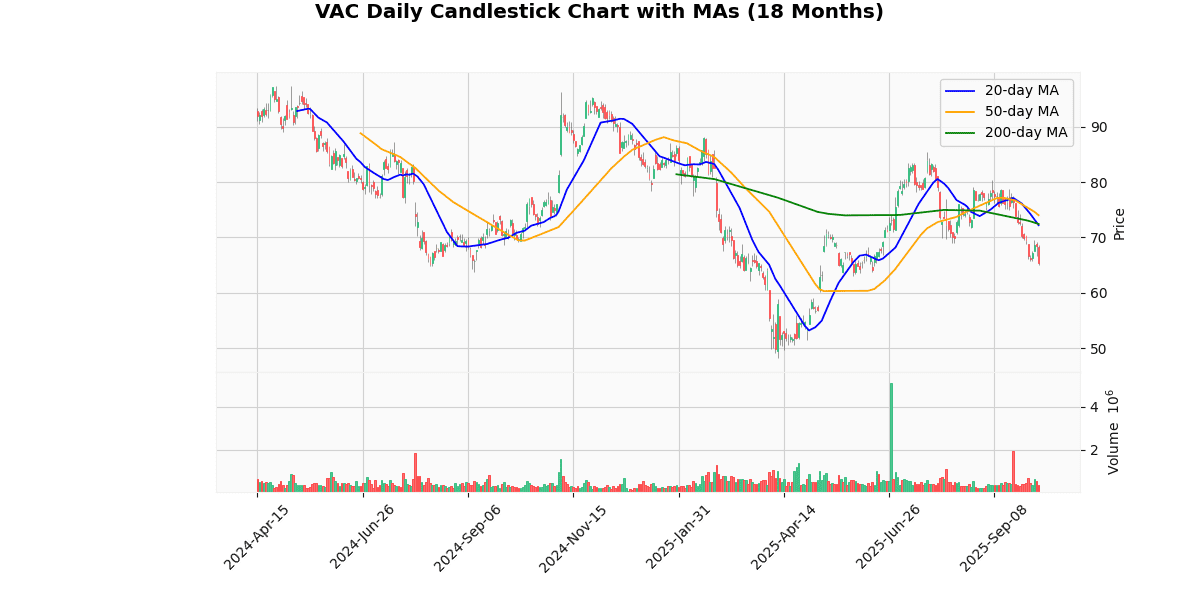
The current price of the asset at $65.24 is notably below its 20-day, 50-day, and 200-day moving averages, which are $72.20, $74.01, and $72.43 respectively. This positioning indicates a bearish trend, as the asset is trading well below the short-term and long-term averages. The significant deviation from these key moving averages suggests a strong downward momentum and potential bearish sentiment in the market. Investors might view this as a negative signal, indicating that the asset is currently out of favor and could face further declines unless a reversal pattern emerges. The fact that all major moving averages are above the current price also reinforces the strength of the current downtrend, potentially influencing future trading strategies focused on short selling or waiting for stabilization before considering entry points for long positions.
Recent Ratings
| Date | Status | Outer | Rating | Price |
|---|---|---|---|---|
| 2025-04-22 00:00:00 | Upgrade | Morgan Stanley | Underweight → Equal-Weight | $57 |
| 2025-01-06 00:00:00 | Initiated | Morgan Stanley | Underweight | $87 |
| 2024-12-13 00:00:00 | Upgrade | Barclays | Equal Weight → Overweight | $97 → $116 |
| 2024-09-18 00:00:00 | Initiated | Goldman | Sell | $62 |
StepStone Group Inc (STEP) (-4.36%)
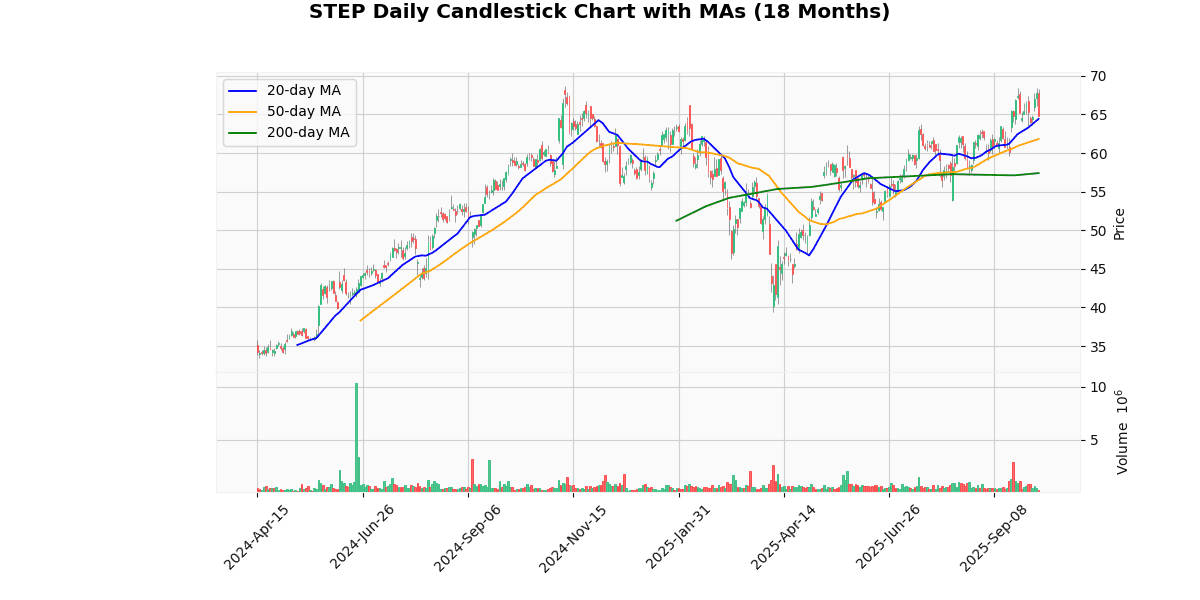
Technical Analysis
The current price of the asset at $64.72 shows a bullish trend when analyzed against its moving averages (MAs). It is trading above the 20-day moving average (MA20) of $64.43, indicating short-term bullish momentum. Furthermore, the price surpasses the 50-day moving average (MA50) of $61.83 and the 200-day moving average (MA200) of $57.4, reinforcing a strong medium to long-term uptrend. This positioning above all key MAs suggests sustained buying interest and positive sentiment in the market. Investors might view these indicators as a confirmation of an ongoing upward trajectory, potentially leading to increased buying pressure. However, vigilance is advised as the proximity of the current price to the MA20 could also signal potential volatility or price corrections in the near term.
Recent Ratings
| Date | Status | Outer | Rating | Price |
|---|---|---|---|---|
| 2025-10-03 00:00:00 | Initiated | BMO Capital Markets | Outperform | $74 |
| 2025-09-18 00:00:00 | Upgrade | Goldman | Neutral → Buy | $83 |
| 2024-04-11 00:00:00 | Upgrade | JP Morgan | Neutral → Overweight | $40 → $49 |
| 2024-03-20 00:00:00 | Initiated | Oppenheimer | Outperform | $48 |
Disclaimer
The content on MarketsFN.com is provided for educational and informational purposes only. It does not constitute financial advice, investment recommendations, or trading guidance. All investments involve risks, and past performance does not guarantee future results. You are solely responsible for your investment decisions and should conduct independent research and consult a qualified financial advisor before acting. MarketsFN.com and its authors are not liable for any losses or damages arising from your use of this information.


