CarMax, Inc., founded in 1993 by Richard L. Sharp and William Austin Ligon, is a prominent used vehicle retailer headquartered in Richmond, VA. The company operates through two segments: CarMax Sales Operations, which handles auto merchandising and services, and CarMax Auto Finance (CAF), which provides financing services to customers purchasing retail vehicles. CarMax also engages in wholesale vehicle auction operations.
Recent news highlights significant developments in the stock market and specific companies, with potential impacts on their stock performance. CarMax has been a focal point, experiencing a notable decline in its stock price following a weaker-than-expected earnings report. The company’s Q2 earnings and revenues fell short of Wall Street estimates, primarily due to an unexpected drop in used-car sales, even at lower prices. This development sent CarMax shares tumbling, hitting a 52-week low, and reflects broader challenges in the tariff-strained auto sector, suggesting more pain ahead for the industry.
Additionally, Wall Street is showing signs of cooling off after a recent rally, with U.S. stocks trading lower. This shift in market sentiment could influence investor confidence and stock valuations across various sectors. Companies like Intel, Oracle, and IBM are also on investors’ radar, potentially affecting their market performance depending on broader economic indicators and individual corporate achievements.
Overall, these developments could lead to increased market volatility and necessitate a cautious approach from investors, particularly in sectors directly impacted by these trends.
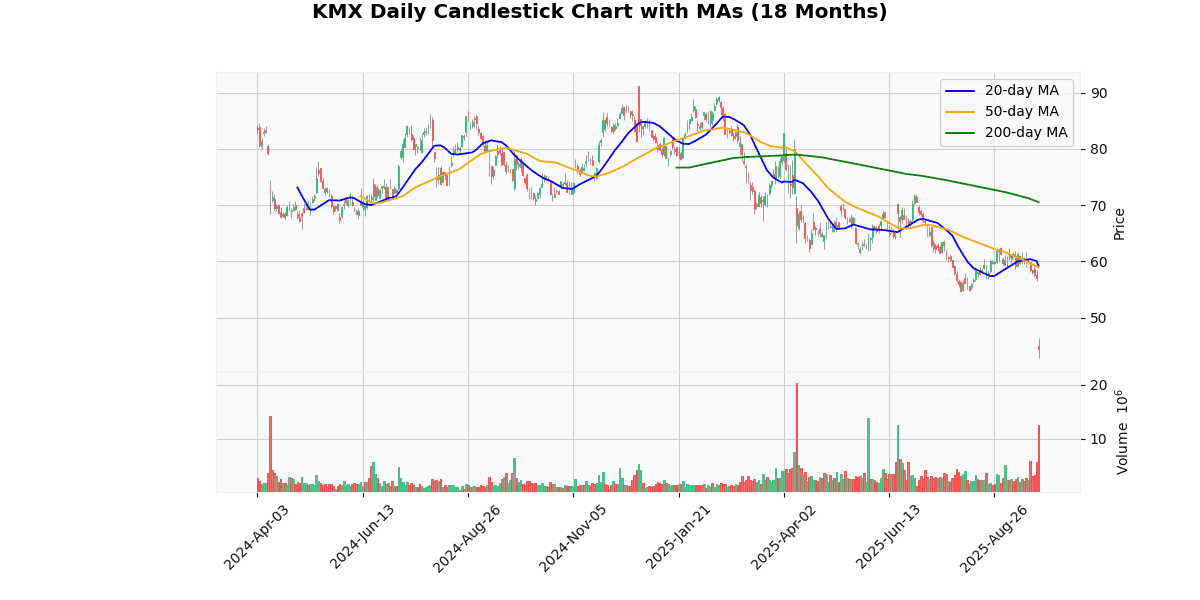
The price metrics indicate a significant bearish trend for the asset. The current price of $44.4473 represents a sharp decline of 22.77% today alone, positioning it near its 52-week and year-to-date lows of $42.75. This proximity to the lows suggests a strong downward momentum, supported by the asset’s substantial declines from both its 52-week high of $91.25 and YTD high of $89.47, down approximately 51% and 50% respectively.
The moving averages further underscore the bearish sentiment, with the current price underperforming against the MA20, MA50, and MA200 by approximately 25%, 25%, and 37% respectively. This indicates sustained negative price movement over short, medium, and long-term periods.
Technical indicators like the RSI at 18.86 suggest the asset is heavily oversold, which sometimes precedes a potential reversal if buyers step in. However, the MACD at -1.63, being negative, aligns with the ongoing bearish trend, indicating that the downward momentum is still strong. Overall, the asset is experiencing a pronounced downtrend with potential for volatility or a corrective rebound if market conditions change.
## Price Chart

CarMax, Inc. (NYSE: KMX) reported a decline in its financial performance for the second quarter of fiscal year 2026, with notable decreases in unit sales and earnings per share. Retail used unit sales dropped by 5.4%, and comparable store sales fell by 6.3%. Wholesale units also saw a decrease of 2.2%. Total revenue from retail used vehicles was down 7.2% to $5.27 billion, while wholesale vehicle revenues slightly declined by 0.4% to $1.15 billion.
The company’s earnings per diluted share significantly decreased by 24.7% to $0.64, compared to $0.85 in the same quarter the previous year. CarMax Auto Finance income fell by 11.2% to $102.6 million, primarily due to a higher provision for loan losses, which rose to $142.2 million from $112.6 million.
Despite these challenges, gross profit margins remained stable with gross profit per retail used unit at $2,216 and per wholesale unit at $993. SG&A expenses were reduced by 1.6% to $601.1 million, and the company has targeted future reductions of at least $150 million over the next 18 months. Additionally, CarMax repurchased $180 million in common stock during the quarter.
The company also expanded its physical presence by opening three new stores and a reconditioning/auction center, enhancing its operational footprint. No quarterly dividend was declared following these results.
## Earnings Trend Table
| Date | Estimate EPS | Reported EPS | Surprise % | |
|---|---|---|---|---|
| 0 | 2025-09-25 | 1.03 | 0.64 | -37.86 |
| 1 | 2025-06-20 | 1.17 | 1.38 | 17.95 |
| 2 | 2025-04-10 | 0.65 | 0.64 | -1.10 |
| 3 | 2024-12-19 | 0.61 | 0.81 | 33.00 |
| 4 | 2024-09-26 | 0.86 | 0.85 | -0.67 |
| 5 | 2024-06-21 | 0.96 | 0.97 | 1.46 |
| 6 | 2024-04-11 | 0.49 | 0.32 | -34.96 |
| 7 | 2023-12-21 | 0.43 | 0.52 | 21.78 |
Over the last eight quarters, the EPS trends of the company have shown significant fluctuations, with both notable underperformances and overperformances relative to estimates. A closer examination reveals a pattern of variability in the company’s ability to meet analyst expectations.
Starting from the most recent quarter (Q3 2025), there was a substantial miss with reported EPS at $0.64 against an estimate of $1.03, marking a -37.86% surprise. This sharp decline contrasts starkly with the previous quarter (Q2 2025), where the company exceeded expectations by 17.95%, reporting an EPS of $1.38 against an estimate of $1.17.
The pattern of inconsistency is further evidenced in earlier quarters. For instance, Q4 2024 saw a positive surprise of 33.00%, significantly outperforming the estimate. However, this was followed by a near-estimate performance in Q3 2024 and a slight overperformance in Q2 2024.
Notably, Q1 2024 and Q4 2023 also displayed significant variance from expectations, with a -34.96% surprise in Q1 2024 and a 21.78% positive surprise in Q4 2023.
This trend suggests a degree of unpredictability in the company’s financial performance, with sharp swings between underperformance and overperformance relative to analyst expectations. Such volatility might indicate underlying operational or market challenges affecting the company’s earnings consistency. Investors and analysts should consider these factors when evaluating the company’s future financial health and stock performance.
The most recent rating changes for the company in question reflect a mix of market sentiment and valuation perspectives from several reputable financial institutions.
1. **Wedbush Downgrade (2025-09-25)**: Wedbush downgraded their rating from “Outperform” to “Neutral.” This adjustment suggests a shift in their outlook on the company’s performance potential, possibly due to reaching a valuation threshold that aligns more closely with market averages, or emerging risks that could cap further stock appreciation. The specific target price was not provided, indicating a general change in sentiment rather than a precise valuation update.
2. **JP Morgan Upgrade (2025-08-06)**: JP Morgan upgraded their rating from “Underweight” to “Neutral” with a target price of $58. This change indicates a reassessment of the company’s previous underperformance relative to market expectations or an improvement in fundamental aspects of the company that could stabilize its stock performance around the given target price.
3. **The Benchmark Company Initiation (2025-07-17)**: The Benchmark Company initiated coverage with a “Buy” rating and a target price of $75. This initiation at a relatively high price point suggests a positive outlook on the company’s growth prospects or market position, potentially driven by innovative developments or strong financial results not yet reflected in the stock price.
4. **Morgan Stanley Resumption (2025-07-01)**: Morgan Stanley resumed coverage with an “Overweight” rating and a target price of $80. This suggests that, based on their analysis, the company is expected to perform better than the average industry performance. The high target price indicates confidence in the company’s future growth trajectory and operational efficiency.
These rating changes provide a nuanced view of the company’s evolving financial landscape, reflecting varying degrees of optimism and caution from different analysts, which could influence investor decisions.
The current price of the stock is $44.45. This price is significantly lower than the average target price suggested by recent analyst ratings. For instance, Morgan Stanley has a target price of $80, The Benchmark Company suggests $75, and JP Morgan sets it at $58. These figures suggest a potential upside from the current market price.
The recent ratings vary, with JP Morgan upgrading the stock from Underweight to Neutral and Wedbush downgrading it from Outperform to Neutral. This indicates a mixed sentiment among analysts, reflecting varying perspectives on the stock’s future performance.
Disclaimer
The content on MarketsFN.com is provided for educational and informational purposes only. It does not constitute financial advice, investment recommendations, or trading guidance. All investments involve risks, and past performance does not guarantee future results. You are solely responsible for your investment decisions and should conduct independent research and consult a qualified financial advisor before acting. MarketsFN.com and its authors are not liable for any losses or damages arising from your use of this information.


